. 2021 Sep;11(9):e553.
doi: 10.1002/ctm2.553.

Interplay of m6 A and histone modifications contributes to temozolomide resistance in glioblastoma

Affiliations

Interplay of m6 A and histone modifications contributes to temozolomide resistance in glioblastoma

Fuxi Li et al. Clin Transl Med. 2021 Sep.

Abstract

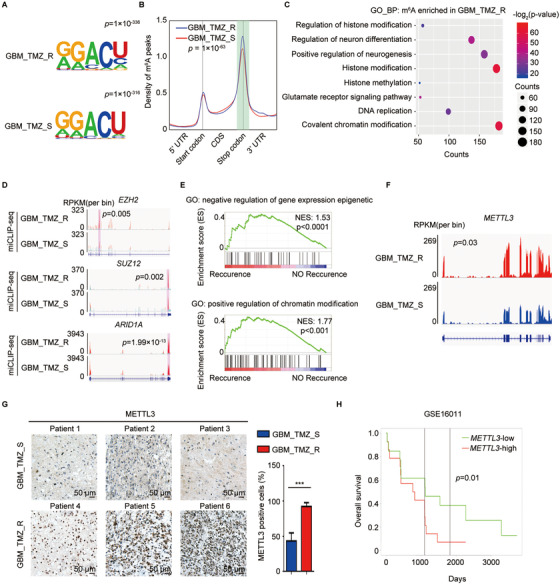
Background: Despite the development of new treatment protocols for glioblastoma (GBM), temozolomide (TMZ) resistance remains a primary hindrance. Previous studies, including our study, have shown that aberrant N6-methyladenosine (m6 A) modification is implicated in GBM pathobiology. However, the roles and precise mechanisms of m6 A modification in the regulation of TMZ resistance in GBM remain unclear.

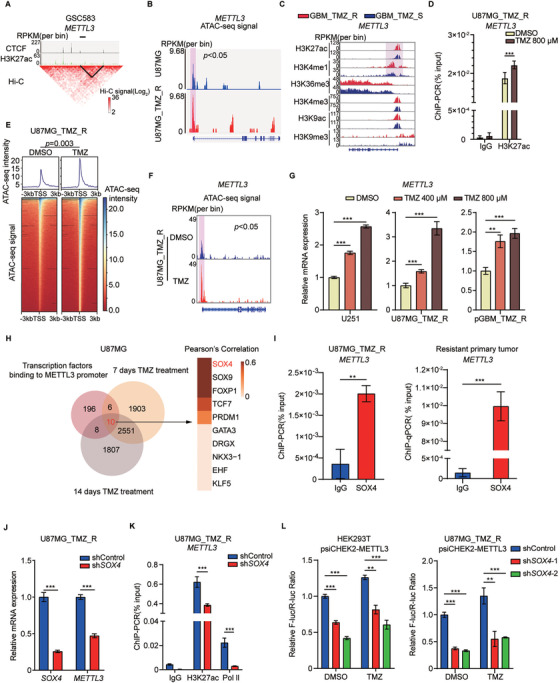
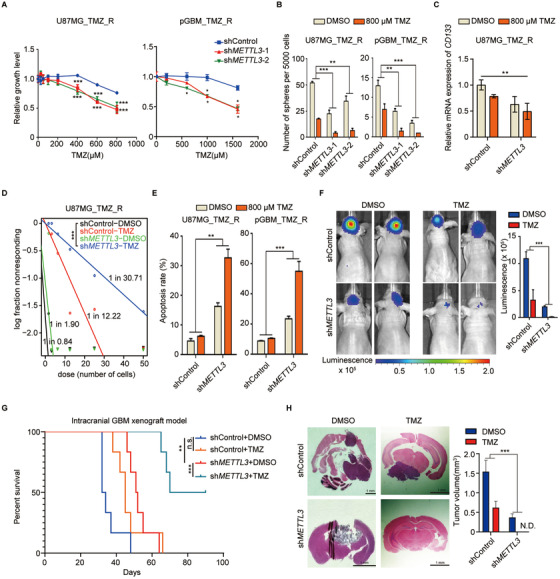
Methods: m6 A individual-nucleotide-resolution cross-linking and immunoprecipitation sequencing (miCLIP-seq) was performed to identify m6 A modification of transcripts in TMZ-resistant and -sensitive tumors. To explore the role of METTL3 in TMZ resistance, TMZ-resistant GBM cells were transfected with METTL3 shRNA or overexpression lentivirus and then assessed by cell viability, tumor sphere formation, and apoptosis assays. An intracranial GBM xenograft model was developed to verify the effect of METTL3 depletion during TMZ treatment in vivo. ATAC-seq, ChIP-qPCR, and dual-luciferase reporter assays were carried out to verify the role of SOX4/EZH2 in the modulation of METTL3 expression upon TMZ treatment.

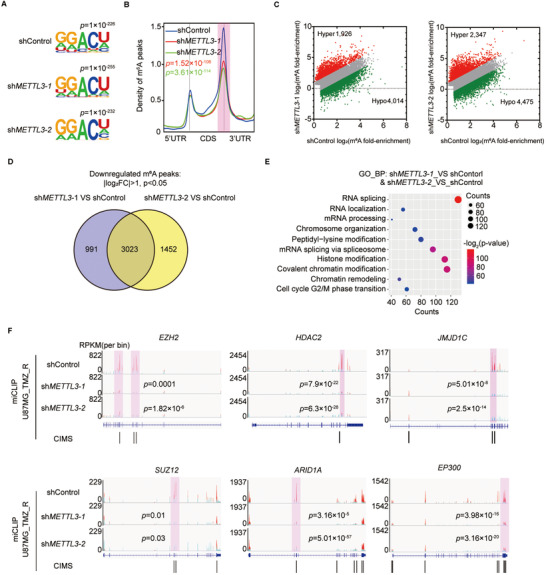
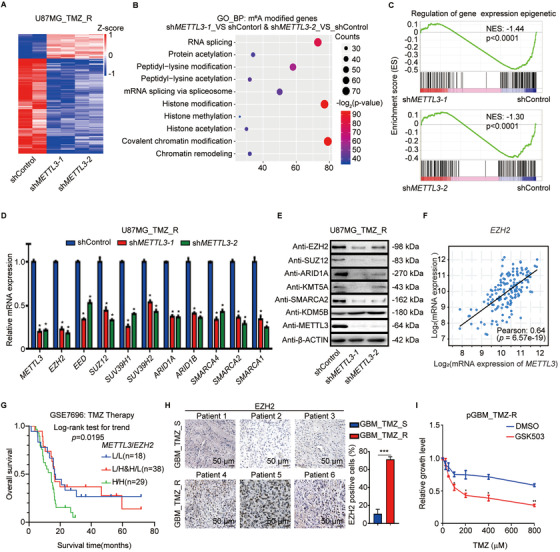
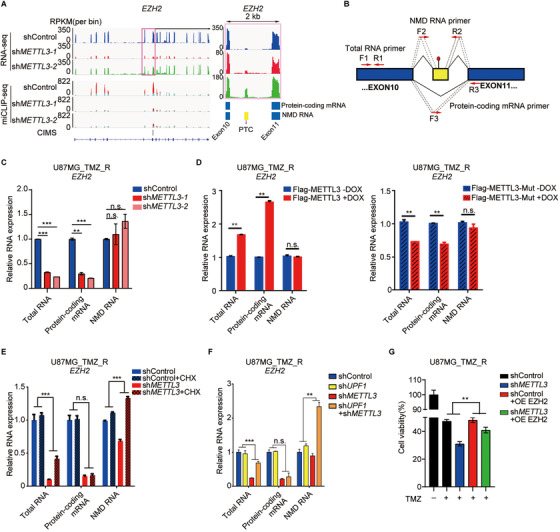
Results: We demonstrated that TMZ treatment upregulated the expression of the m6 A methyltransferase METTL3, thereby increasing m6 A modification of histone modification-related gene transcripts. METTL3 is required to maintain the features of GBM stem cells. When combined with TMZ, METTL3 silencing suppressed orthotopic TMZ-resistant xenograft growth in a cooperative manner. Mechanistically, TMZ induced a SOX4-mediated increase in chromatin accessibility at the METTL3 locus by promoting H3K27ac levels and recruiting RNA polymerase II. Moreover, METTL3 depletion affected the deposition of m6 A on histone modification-related gene transcripts, such as EZH2, leading to nonsense-mediated mRNA decay. We revealed an important role of EZH2 in the regulation of METTL3 expression, which was via an H3K27me3 modification-independent manner.

Conclusions: Our findings uncover the fundamental mechanisms underlying the interplay of m6 A RNA modification and histone modification in TMZ resistance and emphasize the therapeutic potential of targeting the SOX4/EZH2/METTL3 axis in the treatment of TMZ-resistant GBM.

Keywords: METTL3; TMZ resistance; glioblastoma; histone modifications; m6A.


Conflict of interest statement

No potential conflict of interest to disclose.

Figures

FIGURE 1
FIGURE 1
Difference in m6A methylome between TMZ‐resistant and ‐sensitive GBM patient samples. (A) Motif analysis of m6A modification peaks in TMZ‐resistant and ‐sensitive GBM miCLIP‐seq data. (B) Distribution of m6A modification peaks across all mRNAs in TMZ‐resistant and ‐sensitive GBM. GBM_TMZ_R exhibited higher amount of m6A levels around stop codon (shadow) compared with GBM_TMZ_S (Student's t‐test). (C) Gene Ontology (GO) analyses of genes with increased m6A modifications in TMZ‐resistant GBM sample. (D) m6A modification status of histone modification‐related genes EZH2, SUZ12, and ARID1A in TMZ‐resistant and ‐sensitive GBM samples. The y‐axis shows the nomalized RPKM (per bin, bin = 25 bp) value. Exomepeak R package was used for statistical comparison. (E) Gene Set Enrichment Analysis (GSEA) plots show the selected GO gene sets enriched in recurrent patients after TMZ therapy. (F) Integrative genomics viewer (IGV) plots of RNA‐seq peaks at METTL3 mRNA. The y‐axis shows the normalized RPKM (per bin, bin = 25 bp) value. DESeq2 was used for statistical comparison. (G) IHC staining of METTL3 in TMZ‐resistant (n = 3) and TMZ‐sensitive (n = 3) GBM tumors. The statistical results show the proportion of METTL3‐positive cells in each group. (H) Association between METTL3 expression and overall survival of the GBM patients from GSE16011 datasets was analyzed by Kaplan‐Meier analysis. *P < 0.05; **P < 0.01; and ***P < 0.001; n.s., no significant difference, compared to control (Student's t‐test). All the results were obtained from three independent experiments. Values are presented as mean ± SD. GBM_TMZ_R, TMZ‐resistant GBM patient; GBM_TMZ_S, TMZ‐sensitive GBM patient
FIGURE 2
FIGURE 2
SOX4 participates in TMZ‐induced enhancement of transcription of METTL3. (A) Comprehensive analysis of the METTL3 locus in the GSC583 sample (datasets from http://promoter.bx.psu.edu/hi‐c/). METTL3 locus displayed highly accessible and active in gioblastoma, marked by higher enrichment of H3K27ac, which are proximal to the boundary of topological domain. (B) IGV plots of ATAC‐seq peaks at the METTL3 locus in TMZ‐sensitive U87MG cells and TMZ‐resistant U87MG cells (U87MG_TMZ_R). The y‐axis shows the normalized RPKM (per bin, bin = 25 bp) value. ATAC‐seq signal around TSS of METTL3 (shadow) was compared by MACS2. (C) Integrated analysis of histone modifications at the METTL3 locus (datasets from GSE113816). The y‐axis shows the normalized RPKM (per bin, bin = 25 bp) value. (D) ChIP‐qPCR analysis of H3K27ac enrichment at the METTL3 promoter region in U87MG_TMZ_R cells treated with DMSO or TMZ. (E) Heatmap showing the ATAC‐seq signal at transcription start sites (TSSs) ± 3 kb regions for all genes in U87MG_TMZ_R cells treated with DMSO or 800 μM TMZ. ATAC‐seq signal at TSSs in METTL3 KD and control U87MG_TMZ_R cell was compared by Student's t‐test. (F) IGV plots of ATAC‐seq peaks at the METTL3 locus in U87MG_TMZ_R cells treated with DMSO or 800 μM TMZ. The y‐axis shows the normalized RPKM (per bin, bin = 25 bp) value. ATAC‐seq signal around TSS of METTL3 (shadow) was compared by MACS2. (G) qRT‐PCR analysis of METTL3 expression in U251, U87MG_TMZ_R, and pGBM_TMZ_R cells treated with DMSO or different concentrations of TMZ for 72 h. (H) Venn diagram showing the shared 10 potential TFs binding to METTL3 promoters and upregulated in U87MG cells genes after 7 or 14 days of TMZ treatment. Pearson's correlation coefficients of these 10 TFs are shown on the right. (I) ChIP‐qPCR analysis of SOX4 enrichment at the METTL3 promoter region in U87MG_TMZ_R cells and TMZ‐resistant GBM. (J) mRNA expression of SOX4 and METTL3 in SOX4 KD (pooled SOX4 shRNAs) or control U87MG_TMZ_R cells. (K) ChIP‐qPCR analysis of H3K27ac and RNA Pol II enrichment at the METTL3 promoter region in SOX4 KD (pooled SOX4 shRNAs) or control U87MG_TMZ_R cells. (L) Dual‐luciferase reporter assay for the effects of SOX4 KD on the luciferase activity of the METTL3 promoter (–3000 bp‐0 bp) in HEK293T and U87MG_TMZ_R cells. *P < 0.05; **P < 0.01; and ***P < 0.001, compared to control (Student's t‐test). All the results were obtained from three independent experiments. Values are presented as mean ± SD
FIGURE 3
FIGURE 3
METTL3 inhibition enhances sensitivity of TMZ‐resistant GBM cells to TMZ. (A) Cell viability assays of U87MG_TMZ_R and pGBM_TMZ_R cells transduced with shMETTL3 and treated with different concentrations of TMZ were performed using CellTiter‐Glo. U87MG_TMZ_R, TMZ‐resistant U87MG cells; pGBM_TMZ_R, TMZ‐resistant primary GBM cells. (B) Sphere formation assay of U87MG_TMZ_R and pGBM_TMZ_R cells after METTL3 silencing and TMZ treatment compared with the control (two‐way ANOVA). The number of spheres formed was counted on day seven. (C) Expression of CD133 in U87MG_TMZ_R‐derived spheres (7 days) after METTL3 silencing and TMZ treatment compared with the control. (D) Limiting dilution assay (LDA) of U87MG_TMZ_R‐derived sphere cells after METTL3 silencing (pooled METTL3 shRNAs) and TMZ treatment compared with the control. (E) Proportion of apoptotic cells in METTL3 KD (pooled METTL3 shRNAs), control U87MG_TMZ_R, and pGBM_TMZ_R cells following TMZ treatment for 72 h (two‐way ANOVA). (F) Representative images of brain tumors in mice intracranially injected with shMETTL3 (pooled METTL3 shRNAs)‐treated or control TMZ‐resistant U87MG cells and treated with TMZ (40 mg/kg/day) (two‐way ANOVA). The scale bar of bioluminescence intensity is shown at the bottom. (G) Kaplan‐Meier survival curve for the four different treatment groups. (H) Representative images of H&E‐stained sections of the brain tissue of mice at 4 weeks after the intracranial injection of shMETTL3‐treated (pooled METTL3 shRNAs) or control TMZ‐resistant U87MG cells and treated with TMZ (40 mg/kg/day). *P < 0.05; **P < 0.01; and ***P < 0.001, compared to control (Student's t‐test and two‐way ANOVA). All the results were obtained from three independent experiments. Values are presented as mean ± SD
FIGURE 4
FIGURE 4
METTL3 regulates the m6A level of histone modification factors. (A) Motif analysis of m6A modification peaks in METTL3 KD and control U87MG_TMZ_R cell miCLIP‐seq data. (B) Distribution of m6A modification peak reads across all mRNAs in METTL3 KD and control U87MG_TMZ_R cells. The levels of m6A modification near the stop codon (shadow) in METTL3 KD and control U87MG_TMZ_R cell were compared by Student's t‐test. (C) Scatter plot shows m6A enrichment on mRNAs in METTL3 KD and control U87MG_TMZ_R cells. (D) Venn diagram indicates the shared 3023 genes with decreased m6A modification in shMETTL3‐treated U87MG_TMZ_R cell. (E) GO analysis of m6A modification reduced genes in U87MG_TMZ_R cells upon METTL3 silencing. (F) IGV plots of m6A peaks at the gene loci of histone modifiers in METTL3 KD and control U87MG_TMZ_R cells. The y‐axis shows the normalized RPKM (per bin, bin = 25 bp) value. Exomepeak R package was used for statistical comparison. CIMS, crosslinking‐induced mutation sites
FIGURE 5
FIGURE 5
METTL3 regulates the expression of histone modification factors. (A) Heatmap shows the mRNA expression changes in U87MG_TMZ_R cells upon METTL3 silencing. Z‐score = log2(x/μ), μ means the average RPKM value of a set of data. (B) GO analysis of downregulated m6A modified genes in U87MG_TMZ_R cells upon METTL3 silencing. (C) GSEA plots of differentially regulated genes between shMETTL3‐treated and control cells. (D) RT‐qPCR analysis of the indicated mRNAs in U87MG_TMZ_R cells with or without METTL3 silencing. (E) Immunoblotting of the indicated proteins in U87MG_TMZ_R cells transduced with shMETTL3 and control shRNA. (F) Analysis of the correlation between METTL3 and EZH2 mRNA expression levels in GBM patients from TCGA database. (G) Overall survival curve of GBM patients divided by different combinations of METTL3 and EZH2 expression (L/L, low EZH2 and METTL3 expression; L/H&H/L, low EZH2 expression and high METTL3 expression & high EZH2 expression and low METTL3 expression; H/H, high EZH2 and METTL3 expression). (H) IHC staining of EZH2 in TMZ‐resistant GBM samples (n = 3) and comparison with TMZ‐sensitive GBM samples (n = 3). The statistical results showed the proportion of EZH2‐positive cells in each group. (I) Cell viability assays of primary TMZ‐resistant GBM cells treated with the inhibitor of EHZ2 (GSK503) and different concentrations of TMZ. *P < 0.05; **P < 0.01, compared to control (Student's t‐test). All the results were obtained from three independent experiments. Values are presented as mean ± SD
FIGURE 6
FIGURE 6
METTL3‐mediated NMD regulates EZH2 expression. (A) IGV plots of m6A and RNA‐seq peaks at EZH2 mRNAs. The y‐axis shows the normalized RPKM (per bin, bin = 25 bp) value, blue boxes represent protein‐coding exons, and yellow boxes represent NMD exons. (B) Schematic diagrams of total RNA primers (F1 and R1), protein‐coding mRNA primers (F3 and R3), and NMD RNA primers (F2 and R2) for real‐time qPCR analyses. (C) RT‐qPCR analysis of the total, protein‐coding, or NMD RNA levels of EZH2 in U87MG_TMZ_R cells transduced with shMETTL3. (D) RT‐qPCR analysis of the total, protein‐coding, or NMD RNA levels of EZH2 in U87MG_TMZ_R cells transduced with METTL3 or a mutated catalytic domain (METTL3‐mut). (E) RT‐qPCR analysis of the total, protein coding, or NMD RNA levels of EZH2 in METTL3 KD (pooled METTL3 shRNAs) U87MG_TMZ_R cells treated with 10 μg/mL CHX (cycloheximide) or DMSO for 8 h (two‐way ANOVA). (F) RT‐qPCR analysis of the total, protein coding, or NMD RNA levels of EZH2 in U87MG_TMZ_R cells transduced with indicated shRNA(s) (pooled shRNAs) (two‐way ANOVA). (G) Cell viability assays of TMZ‐resistant U87MG cells cotransfected with indicated shRNA (pooled shRNAs) and/or overexpression plasmid and treated with TMZ (two‐way ANOVA). *P < 0.05; **P < 0.01; ***P < 0.001; And n.s., no significant difference, compared to control (Student's t‐test and two‐way ANOVA). All the results were obtained from three independent experiments. Values are presented as mean ± SD
FIGURE 7
FIGURE 7
EZH2‐mediated H3K27ac enhances METTL3 locus accessibility in GBM cells. (A) Venn diagram illustrates overlap among EZH2, H3K27ac, and H3K27me3 binding sites. ChIP‐seq data were acquired from GSE128275 and GSE112240. (B) METTL3 promoter is occupied by EZH2 and H3K27ac but not by H3K27me3. ChIP‐seq data were acquired from GSE128275 and GSE112240. The y‐axis shows the normalized RPKM (per bin, bin = 25 bp) value. (C) ChIP‐qPCR analysis of EZH2 enrichment at the METTL3 promoter region in U87MG_TMZ_R cells. (D) ChIP‐qPCR analysis of H3K27ac enrichment at the METTL3 promoter region in EZH2 KD (pooled EZH2 shRNAs) or control U87MG_TMZ_R cells. (E) Average intensities of ATAC‐seq signals in EZH2 KD (pooled EZH2 shRNAs) or control U87MG_TMZ_R cells. The ATAC‐seq data of EZH2‐binding genes with H3K27ac modification and EZH2‐binding genes with H3K27me3 modification were analyzed. ATAC‐seq signal around TSSs (shadow) were compared by Student's t‐test. (F) IGV plots of ATAC‐seq peaks at METTL3 mRNAs in U87_TMZ_R cells with or without EZH2 KD (pooled EZH2 shRNAs). The y‐axis shows the normalized RPKM (per bin, bin = 25 bp) value. ATAC‐seq signal around TSS of METTL3 (shadow) was compared by MACS2. (G) mRNA expression of EZH2 and METTL3 in EZH2 KD (pooled EZH2 shRNAs) or control U87MG_TMZ_R cells. (H) Dual‐luciferase reporter assay for the effects of EZH2 KD on the luciferase activity of the METTL3 promoter (–3000 bp‐0 bp) in HEK293T and U87MG_TMZ_R cells. (I) Co‐IP analysis of the interaction between SOX4 and PRC2 complex components in U87MG_TMZ_R cells. (J) Schematic illustration of the working model. *P < 0.05; **P < 0.01; and ***P < 0.001, compared to control (Student's t‐test). All the results were obtained from three independent experiments. Values are presented as mean ± SD. n.s., no significant difference

References

    1. Wen PY, Kesari S. Malignant gliomas in adults. N Engl J Med. 2008;359(5):492‐507. - PubMed
    1. Ostrom QT, Gittleman H, Fulop J, et al. CBTRUS statistical report: primary brain and central nervous system tumors diagnosed in the United States in 2008–2012. Neuro‐oncology. 2015;17(4):iv1‐iv62. - PMC - PubMed
    1. Stupp R, Brada M, van den Bent MJ, Tonn JC, Pentheroudakis G. High‐grade glioma: ESMO Clinical Practice Guidelines for diagnosis, treatment and follow‐up. Ann Oncol. 2014;25(3):iii93‐101. - PubMed
    1. Hottinger AF, Pacheco P, Stupp R. Tumor treating fields: a novel treatment modality and its use in brain tumors. Neuro‐oncol. 2016;18(10):1338‐1349. - PMC - PubMed
    1. Gerson SL. MGMT: its role in cancer aetiology and cancer therapeutics. Nat Rev Cancer. 2004;4(4):296‐307. - PubMed

Publication types

LinkOut - more resources