. 2021 Oct;7(40):eabh3243.
doi: 10.1126/sciadv.abh3243. Epub 2021 Sep 29.

G-CSF secreted by mutant IDH1 glioma stem cells abolishes myeloid cell immunosuppression and enhances the efficacy of immunotherapy

Affiliations

G-CSF secreted by mutant IDH1 glioma stem cells abolishes myeloid cell immunosuppression and enhances the efficacy of immunotherapy

Mahmoud S Alghamri et al. Sci Adv. 2021 Oct.

Abstract

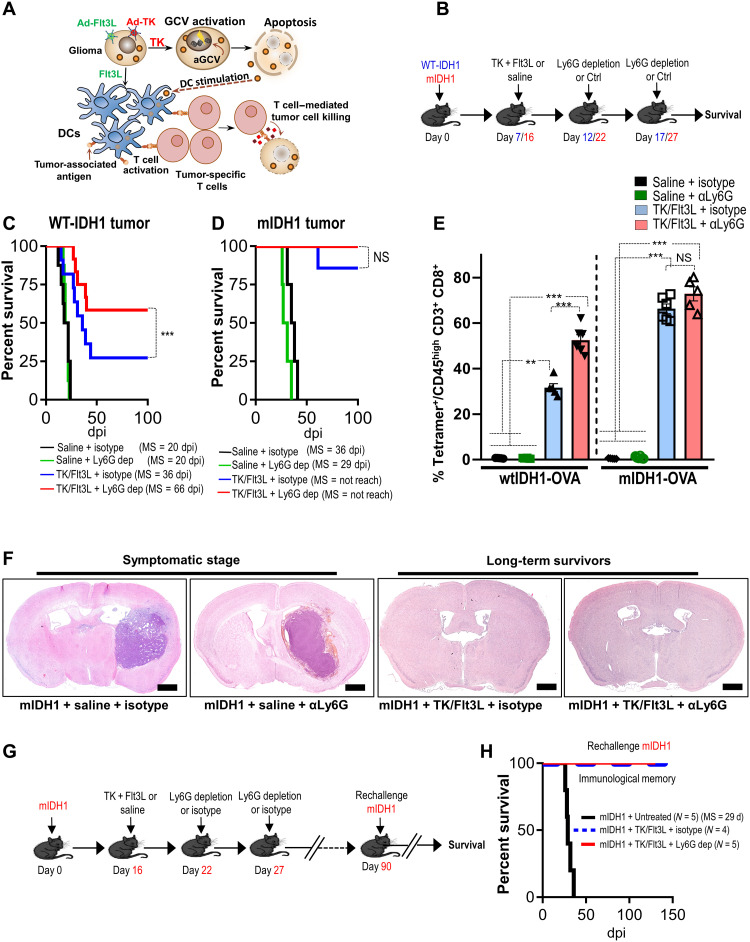
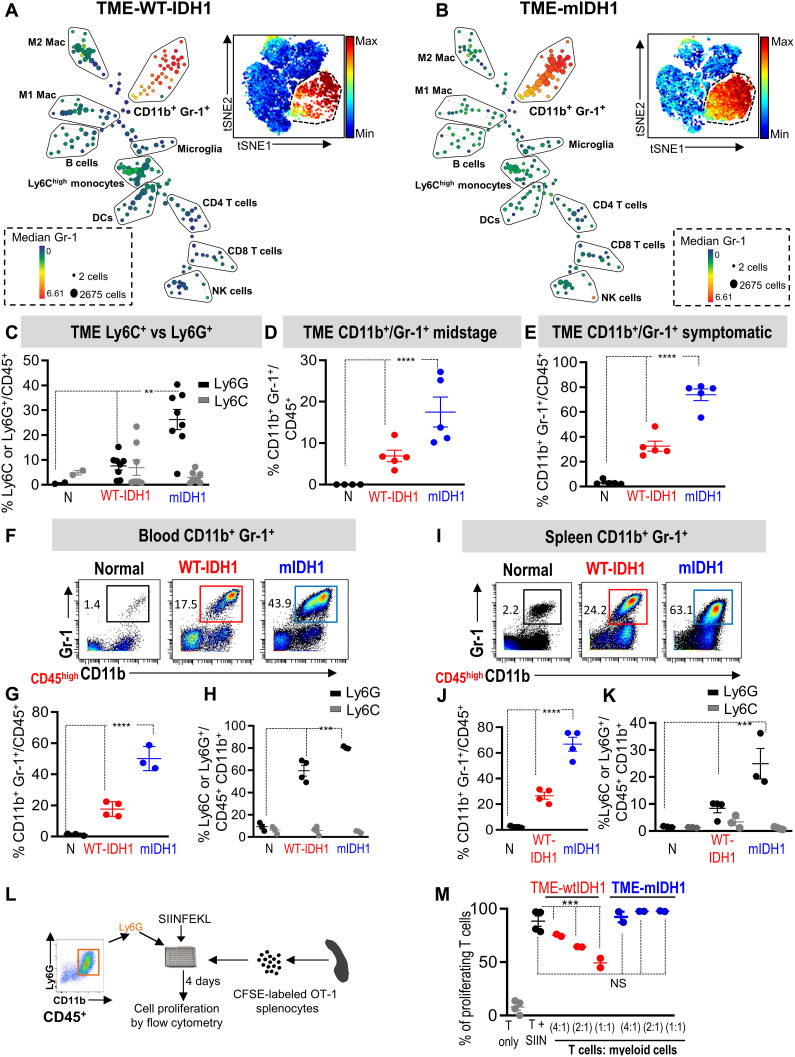
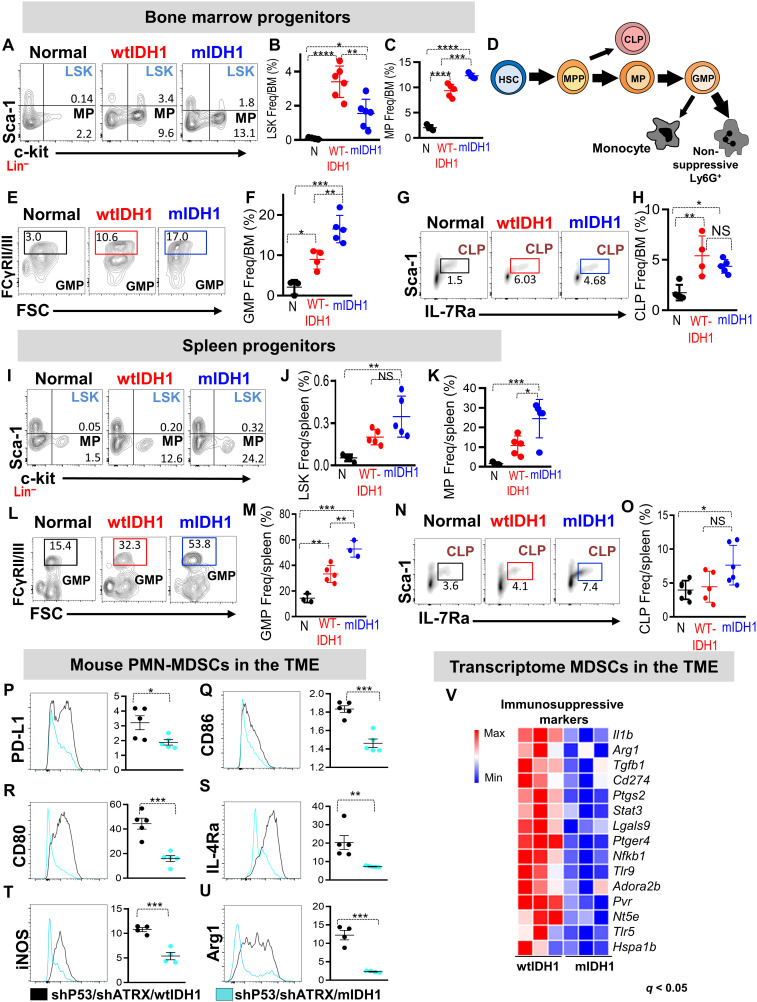
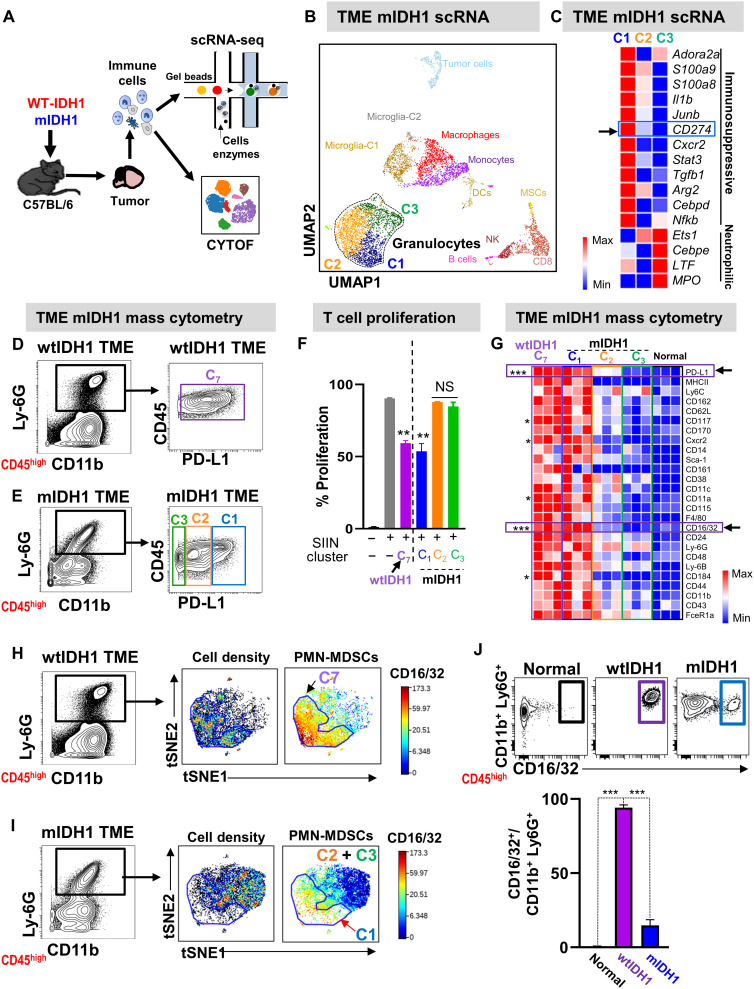
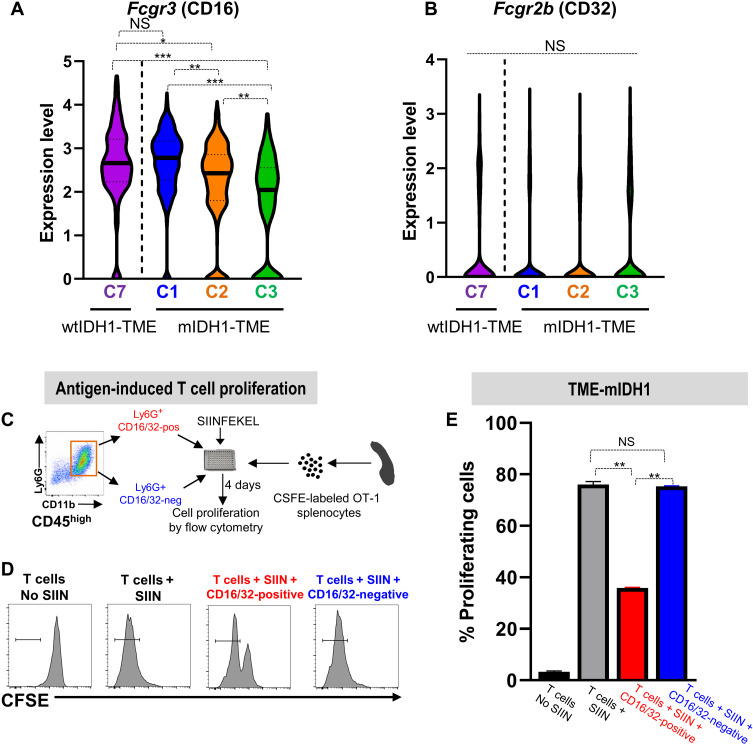
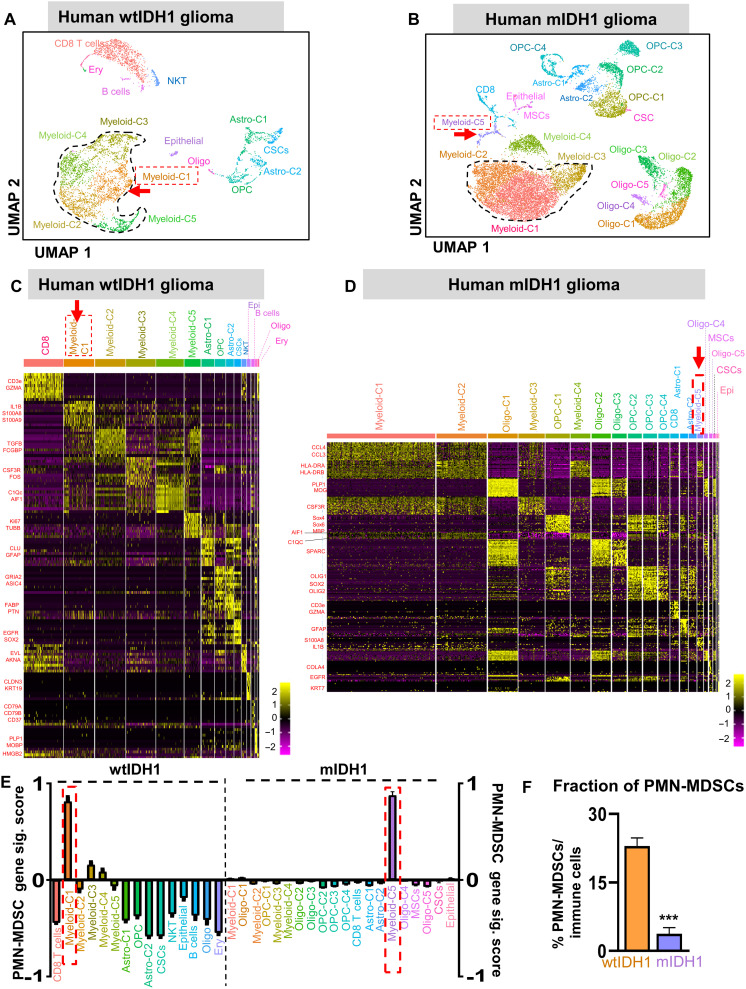
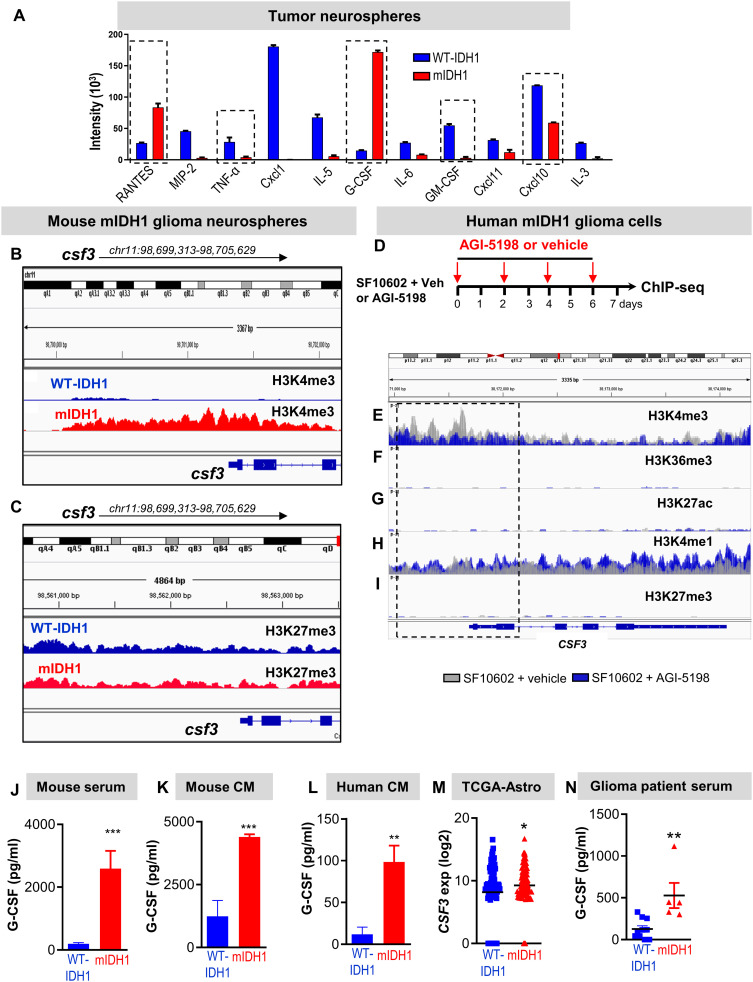
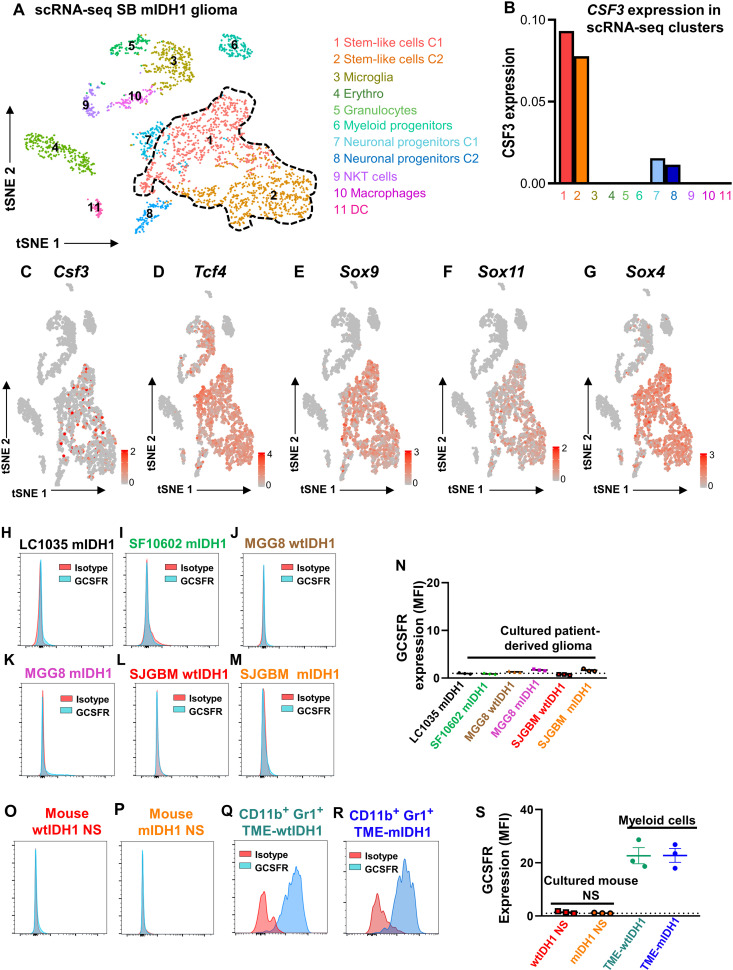
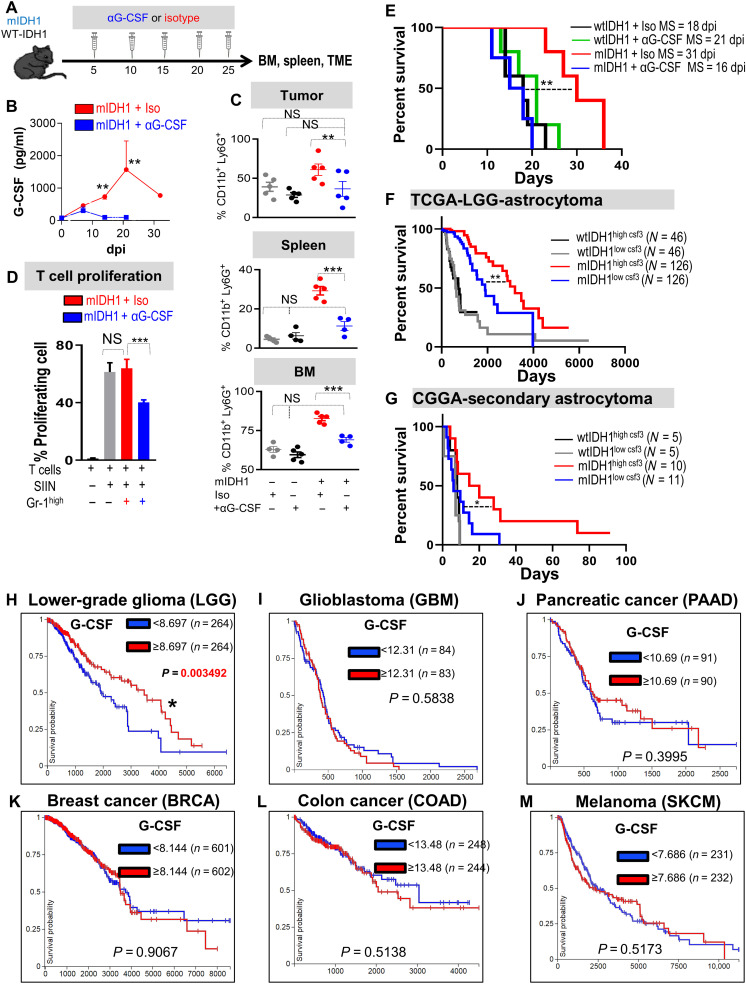
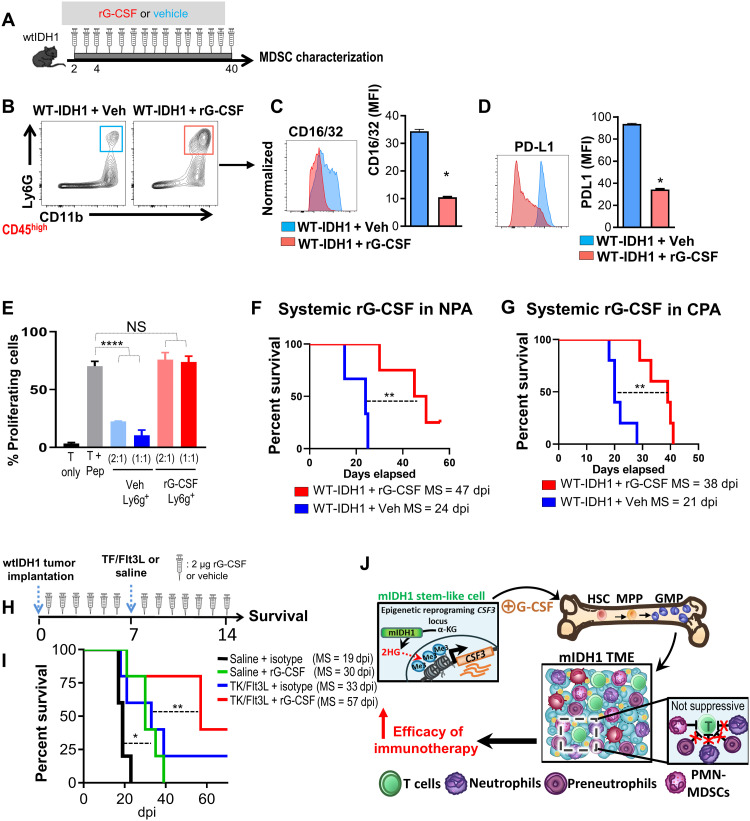
Mutant isocitrate-dehydrogenase 1 (mIDH1) synthesizes the oncometabolite 2-hydroxyglutarate (2HG), which elicits epigenetic reprogramming of the glioma cells’ transcriptome by inhibiting DNA and histone demethylases. We show that the efficacy of immune-stimulatory gene therapy (TK/Flt3L) is enhanced in mIDH1 gliomas, due to the reprogramming of the myeloid cells’ compartment infiltrating the tumor microenvironment (TME). We uncovered that the immature myeloid cells infiltrating the mIDH1 TME are mainly nonsuppressive neutrophils and preneutrophils. Myeloid cell reprogramming was triggered by granulocyte colony-stimulating factor (G-CSF) secreted by mIDH1 glioma stem/progenitor-like cells. Blocking G-CSF in mIDH1 glioma–bearing mice restores the inhibitory potential of the tumor-infiltrating myeloid cells, accelerating tumor progression. We demonstrate that G-CSF reprograms bone marrow granulopoiesis, resulting in noninhibitory myeloid cells within mIDH1 glioma TME and enhancing the efficacy of immune-stimulatory gene therapy.


Figures

Fig. 1.
Fig. 1.. mIDH1 tumor models have enhanced response to immune-stimulatory gene therapy irrespective of myeloid cell depletion.
(A) Schematic showing the mechanism by which TK/Flt3L gene therapy recruits and activates a tumor-specific T cell response. (B) Schematic illustrating the treatment strategy of the TK + Flt3L gene therapy in combination with Ly6G depletion in wtIDH1 or mIDH1 tumor–bearing mice. WT, wild type. (C and D) Kaplan-Meier survival curves of implanted mice-bearing wtIDH1 or mIDH1 tumors, treated with TK + Flt3L, Ly6G depletion, or combination therapy. dpi, days postimplantation; NS, not significant. (E) Tumor-specific CD8 T cell frequency within the TME of wtIDH1 or mIDH1 tumors treated with TK + Flt3L, Ly6G depletion, or combination therapy was analyzed by staining for SIINFEKL-Kb tetramers. (F) Hematoxylin and eosin staining of brain sections from mIDH1 tumors treated with saline, αLy6G, TK/Flt3L, and TK/Flt3L + αLy6G. (G) Schematic illustrating the treatment strategy of the TK + Flt3L gene therapy in combination with Ly6G depletion in mIDH1 tumor–bearing mice. Most mIDH1 tumor–bearing mice (90%) survived long term in response to TK/Flt3L gene therapy regardless of Ly6G depletion. The long-term survived mice were rechallenged at day 90 after implantation. (H) Kaplan-Meier survival plot for rechallenged long-term survivors from mIDH1 + TK/Flt3L + isotype (N = 4), mIDH1 + TK/Flt3L + Ly6G dep (N = 5), or control (mIDH1 + untreated) (N = 5). Data were analyzed using the log-rank (Mantel-Cox) test. Scale bars, 1 mm. **P < 0.01 and ***P < 0.005, One-way analysis of variance (ANOVA).
Fig. 2.
Fig. 2.. mIDH1 glioma models have high expansion of granulocytic myeloid cell population (CD45high/CD11b+/Ly6G+).
(A and B) SPADE analysis of mass cytometry (CyTOF) data represents immune cell composition within the TME of SB-induced wtIDH1 (A) or mIDH1 (B) tumors. Insets are viSNE visualizations of high-dimensional mass cytometry data; color intensity represents the Gr-1 expression level. (C) Phenotypic characterization of CD45high/CD11b+/Gr-1+ population as granulocytic or monocytic based on the expression of Ly6G or Ly6C at symptomatic stage. Most of the CD45high/CD11b+/Gr-1+ in the mIDH1 glioma TME are CD45high/CD11b+/Ly6G+ (granulocytic) cells. (D and E) Flow cytometry analysis of the frequency of MDSCs (CD45high/CD11b+/Gr-1+) within the TME at the midstage of tumor implantation (D) and at the symptomatic stage (E). The percentage of CD45high/CD11b+/Gr-1+ cells was higher in mIDH1 tumors compared to wtIDH1 tumors. (F and G) CyTOF analysis of CD45high/CD11b+/Gr-1+ cells in blood from mice with no tumor (normal) and SB-induced wtIDH1 or mIDH1 glioma. (H) Phenotypic characterization of circulating CD45high/CD11b+/Gr-1+ cells according to expression of Ly6C or Ly6G. (I and J) CyTOF analysis of CD45high/CD11b+/Gr-1+ cells from the spleens of mice with no tumor and SB-induced wtIDH1 or mIDH1 glioma. (K) Phenotypic characterization of splenic CD45high/CD11b+/Gr-1+ cells according to expression of Ly6C or Ly6G. (L) Schematic figure of the in vitro T cell proliferation assay. (M) Flow analysis of the inhibitory potential of CD45high/CD11b+/Ly6G+ cells from TME of wtIDH1 or mIDH1 tumor. N = normal, **P < 0.01, ***P < 0.005, and ****P < 0.0001, ANOVA.
Fig. 3.
Fig. 3.. Phenotypic and molecular characterization of myeloid cell lineages in mIDH1 glioma.
(A to C) Representative flow cytometry plots and quantification of the percentage of (B) LSK (Lin/c-Kit+/Sca-1+) and (C) MP (Lin/c-Kit+/Sca-1) in BM from normal mice (N), and mice implanted with wtIDH1 or mIDH1 neurospheres. (D) Schematic diagram representing the shift in myelopoeisis within mIDH1 tumor–bearing mice. Thick arrows represent predominant developmental pathways in mIDH1 tumor–bearing mice. (E to H) Flow cytometry analysis of the frequency of (E and F) GMPs (Lin/IL-7Rα/c-Kit+/Sca-1/CD34+/FcyRII/IIIhigh) and (G and H) CLPs (c-Kitlow/Sca-1low/Lin/IL-7Rα+) in the BM from normal and wtIDH1 or mIDH1 tumor–bearing mice. (I to K) Representative flow cytometry plots and quantification of the percentage of (J) LSK and (K) MPs in spleen from normal and wtIDH1 or mIDH1 tumor–bearing mice. (L and M) Representative flow cytometry plot and quantitation analysis showing the frequency of common GMPs in spleens from normal mice and wtIDH1 and mIDH1 tumor–bearing animals. (N and O) Representative flow cytometry plot and quantitation analysis showing the frequency of CLPs in spleens from normal mice, wtIDH1 and mIDH1 tumor–bearing mice. (P to U) Flow cytometry analysis of immunosuppressive/costimulatory markers in the CD45high/CD11b+/Ly6G+ population within TME of wtIDH1 (black) or mIDH1 (blue). (V) Heatmap showing the normalized expression of genes related to PMN-MDSC immunosuppressive signature in myeloid cells (CD11b+/ Gr-1+) from wtIDH1 or mIDH1 TME. *P < 0.05, **P < 0.01, ***P < 0.005, and ****P < 0.0001, one-way ANOVA.
Fig. 4.
Fig. 4.. Nonsuppressive neutrophils and preneutrophils are the major granulocyte population in mIDH1 tumors.
(A) Schematic overview of single-cell sequencing and CyTOF analysis of immune cells infiltrating wtIDH1 and mIDH1 tumors. (B) Combined Seurat analysis of immune cells from mIDH1 shown in Uniform Manifold Approximation and Projection (UMAP) projection results in various distinct clusters of immune cells (N = 2). (C) Heatmap of differentially expressed immunosuppressive and neutrophil-related genes between the three granulocytic clusters in mIDH1 TME. (D and E) Mass cytometry analysis of granulocytes from TME of (D) wtIDH1 or (E) mIDH1 tumors. (F) T cell proliferation analysis to assess the inhibitory potential of myeloid cells cluster (C7) from wtIDH1 tumors and C1, C2, and C3 myeloid cell clusters isolated from mIDH1 tumors. (G) Heatmap representing normalized expression level of myeloid biomarkers within granulocytes from the TME of normal mice, mice implanted with wtIDH1 tumors, and C1, C2, and C3 clusters from the TME of mIDH1 tumors. (H and I) Unsupervised clustering and viSNE visualization of granulocytes from wtIDH1 (H) or mIDH1 (I) tumors using the biomarker shown in (G). (J) Flow plots and quantitation analysis of the proportion of bona fide PMN-MDSCs (CD45high/CD11b+/Ly6G+/CD16/32+) infiltrating normal mice and wtIDH1 or mIDH1 tumors. *P < 0.05, **P < 0.01, ***P < 0.005, ANOVA.
Fig. 5.
Fig. 5.. CD16/32 is a specific marker that defines bona fide immunosuppressive PMN-MDSCs.
(A and B) Violin plot showing the expression of the Fcgr3 (A) or Fcgr2b (B) gene in each granulocytic cluster infiltrating the wtIDH1 tumor (C7) or mIDH1 tumors (C1, C2, and C3). Fcgr3, but not Fcgr2b, is expressed at high level in both immunosuppressive granulocytic MDSCs clusters (C7 and C1). (C) Schematic of the in vitro T cell proliferation assay to analyze immune suppressive properties of CD45high/CD11b+/Ly6G+/CD16/32−/+. Sorted CD45high/CD11b+/Ly6G+/CD16/32-positive or CD45high/CD11b+/Ly6G+/CD16/32-negative cells were cocultured with CFSE-labeled splenocytes from Rag2/OT-1 transgenic mouse. Cultures were stimulated with 100 nM SIINFEKL peptide for 4 days, after which proliferation was analyzed by flow cytometry. (D) Representative flow plots showing CFSE staining of unstimulated splenocytes (T only), splenocytes undergoing rapid proliferation in response to SIINFEKL (T + SIIN), and the effect of SIINFEKL-induced T cell proliferation in the presence of CD45high/CD11b+/Ly6G+/CD16/32-negative or CD45high/CD11b+/Ly6G+/CD16/32-positive cells from the TME of mIDH1 tumors. (E) Quantitation analysis of the inhibitory potential of CD45high/CD11b+/Ly6G+/CD16/32-negative or CD45high/CD11b+/Ly6G+/CD16/32-positive cells sorted from TME of mIDH1 tumor. CD45high/CD11b+/Ly6G+/CD16/32-positive cells inhibit T cell proliferation, whereas CD45high/CD11b+/Ly6G+/CD16/32-negative cells did not suppress T cell proliferation. *P < 0.05, **P < 0.01, and ***P < 0.005, one-way ANOVA.
Fig. 6.
Fig. 6.. PMN-MDSC gene signature is expressed in a higher proportion of tumor-infiltrating immune cells in human wtIDH1 glioma.
Seurat analysis of immune cells from (A) wtIDH1 or (B) mIDH1 primary tumor samples, shown in UMAP projection, results in various distinct clusters. (C and D) Heatmaps showing the differentially expressed genes in each cluster of (C) wtIDH1 tumor and (D) mIDH1 tumor samples. (E) Bar plots showing the relative PMN-MDSC gene signature score in each cluster of primary human samples. (F) Quantification of the tumor-infiltrating PMN-MDSCs/total immune cells calculated from scRNA-seq data. ***P < 0.001, Student’s t test.
Fig. 7.
Fig. 7.. G-CSF is a major epigenetically regulated cytokine expressed by glioma stem-like cells.
(A) Cytokine array analysis performed on conditioned media from wtIDH1 and mIDH1 neurospheres. (B) H3K4me3 and (C) H3K27me3 occupancy at specific genomic regions of Csf3 gene. (D) Experimental design for ChIP-seq analysis of mIDH1 patient-derived neurospheres (SF10602) treated with vehicle or the mIDH1 inhibitor (AGI-5198). (E to I) Histone marks occupancy at specific genomic regions of CSF3 gene in SF10602 treated with mIDH1 inhibitor (AGI-5198, blue) compared to untreated cells (gray). (J to L) Quantitative ELISA of the G-CSF level in mouse serum of tumor-bearing animals (J), conditioned media from cultured mouse neurospheres (K), and conditioned media from cultured human neurospheres (L) expressing wtIDH1 or mIDH1. (M) Analysis of TCGA data for CSF3 gene expression in mIDH1 glioma patients harboring TP53 and ATRX mutation (n = 99) and wtIDH1 (n = 82). (N) Quantitative ELISA of serum G-CSF from glioma patients with wtIDH1 or mIDH1 (astrocytoma). *P < 0.05, **P < 0.01, and ***P < 0.005, Student’s t test.
Fig. 8.
Fig. 8.. Glioma mIDH1 stem-like cells are the major source of G-CSF expression.
(A and B) Combined Seurat analysis shown in tSNE projection of whole tumor from mIDH1 GEMM of glioma resulted in various distinct clusters of cells. The expression of CSF3 was analyzed between the clusters. Stem-like cells were the major clusters that have the highest CSF3 expression (N = 2). (C to G) Feature plots represent the expression of (C) csf3, (D) tcf4, (E) sox9, (F) sox11, and (G) sox4. (H to M) Flow cytometry analysis of the GCSFR expression in glioma patient-derived cells with wtIDH1 or mIDH1. (N) Quantification of GCSFR expression in cultured human glioma cells with wtIDH1 or mIDH1. MFI, Mean fluorescence intensity. (O and P) Flow cytometry analysis of the GCSFR expression in mouse neurospheres developed by the SB model with wtIDH1 or mIDH1. (Q and R) Flow cytometry analysis of the GCSFR expression on CD11b+ Gr-1+ derived from the TME of wtIDH1 or mIDH1 tumor–bearing mice. (S) Quantification of GCSFR expression in conditions (O) to (R).
Fig. 9.
Fig. 9.. G-CSF neutralization restores the immunosuppressive properties in myeloid cells and enhances the efficacy of immunotherapy.
(A) Schematic showing experimental design of G-CSF neutralization in wtIDH1 and mIDH1 tumor–bearing mice. (B) Quantitative ELISA of serum G-CSF from mIDH1 glioma-bearing mice treated with either isotype (red) or αG-CSF (blue). (C) Flow analysis of CD45high/CD11b+/Ly6G+ cells from tumor, spleen, and BM of tumor-bearing mice treated with either isotype or αG-CSF. (D) T cell proliferation assay of CD45high/CD11b+/Ly6G+ infiltrating mIDH1 tumor treated with isotype or αG-CSF. (E) Kaplan-Meier survival analysis of mice implanted with either wtIDH1 or mIDH1 neurospheres treated with isotype or αG-CSF. (F) Kaplan-Meier survival analysis of TCGA-LGG astrocytoma wtIDH1 or mIDH1 patients with high and low CSF3 expression. (G) Kaplan-Meier survival analysis of Chinese Glioma Genome Atlas (CGGA)–secondary astrocytoma wtIDH1 or mIDH1 patients with high and low levels of CSF3 expression. (H to M) Kaplan-Meier survival analysis of the different types of tumors in the TCGA data according to CSF3 expression (high or low). LGG is the sole tumor within the TCGA database in which patients who express a high level of CSF3 have a favorable prognosis compared to patients with low CSF3 expression. *P < 0.05, **P < 0.01, and ***P < 0.005, ANOVA.
Fig. 10.
Fig. 10.. G-CSF induces the expansion of nonsuppressive neutrophils and enhances the efficacy of TK/Flt3L immunotherapy in wtIDH1 glioma.
(A) Experimental design of rG-CSF or vehicle administration in wtIDH1 tumor–bearing animals. (B) Flow analysis of granulocytes infiltrating wtIDH1 tumors after treatment with vehicle or rG-CSF. (C and D) Flow analysis of CD16/32 and PD-L1 expression on granulocytes isolated from wtIDH1 tumor–bearing animals treated with vehicle (blue) or rG-CSF (red). (E) Flow analysis of the inhibitory potential of CD45high/CD11b+/Ly6G+ cells isolated from TME of wtIDH1 tumor–bearing mice treated with vehicle (blue) or with rG-CSF (red). (F and G) Kaplan-Meier survival analysis of mice bearing wtIDH1 tumors (F) (NPA) or (G) (CPA) treated with either isotype (blue) or rG-CSF (red). (H) Schematic diagram illustrates the treatment strategy of the TK + Flt3L gene therapy in combination with rG-CSF in wtIDH1 tumor–bearing mice. (I) Kaplan-Meier survival curves of mice bearing wtIDH1 tumors, treated with TK + Flt3L, rG-CSF, or combination therapy. (J) Proposed model of aberrant granulocyte differentiation in the mIDH1 tumor. *P < 0.05, **P < 0.01, and ****P < 0.0001, ANOVA.

References

    1. Ceccarelli M., Barthel F. P., Malta T. M., Sabedot T. S., Salama S. R., Murray B. A., Morozova O., Newton Y., Radenbaugh A., Pagnotta S. M., Anjum S., Wang J., Manyam G., Zoppoli P., Ling S., Rao A. A., Grifford M., Cherniack A. D., Zhang H., Poisson L., Carlotti C. G. Jr., Tirapelli D. P. C., Rao A., Mikkelsen T., Lau C. C., Yung W. K. A., Rabadan R., Huse J., Brat D. J., Lehman N. L., Barnholtz-Sloan J. S., Zheng S., Hess K., Rao G., Meyerson M., Beroukhim R., Cooper L., Akbani R., Wrensch M., Haussler D., Aldape K. D., Laird P. W., Gutmann D. H., Noushmehr H., Iavarone A., Verhaak R. G. W., Anjum S., Arachchi H., Auman J. T., Balasundaram M., Balu S., Barnett G., Baylin S., Bell S., Benz C., Bir N., Black K. L., Bodenheimer T., Boice L., Bootwalla M. S., Bowen J., Bristow C. A., Butterfield Y. S. N., Chen Q. R., Chin L., Cho J., Chuah E., Chudamani S., Coetzee S. G., Cohen M. L., Colman H., Couce M., D’Angelo F., Davidsen T., Davis A., Demchok J. A., Devine K., Ding L., Duell R., Elder J. B., Eschbacher J. M., Fehrenbach A., Ferguson M., Frazer S., Fuller G., Fulop J., Gabriel S. B., Garofano L., Gastier-Foster J. M., Gehlenborg N., Gerken M., Getz G., Giannini C., Gibson W. J., Hadjipanayis A., Hayes D. N., Heiman D. I., Hermes B., Hilty J., Hoadley K. A., Hoyle A. P., Huang M., Jefferys S. R., Jones C. D., Jones S. J. M., Ju Z., Kastl A., Kendler A., Kim J., Kucherlapati R., Lai P. H., Lawrence M. S., Lee S., Leraas K. M., Lichtenberg T. M., Lin P., Liu Y., Liu J., Ljubimova J. Y., Lu Y., Ma Y., Maglinte D. T., Mahadeshwar H. S., Marra M. A., McGraw M., McPherson C., Meng S., Mieczkowski P. A., Miller C. R., Mills G. B., Moore R. A., Mose L. E., Mungall A. J., Naresh R., Naska T., Neder L., Noble M. S., Noss A., O’Neill B. P., Ostrom Q. T., Palmer C., Pantazi A., Parfenov M., Park P. J., Parker J. S., Perou C. M., Pierson C. R., Pihl T., Protopopov A., Radenbaugh A., Ramirez N. C., Rathmell W. K., Ren X., Roach J., Robertson A. G., Saksena G., Schein J. E., Schumacher S. E., Seidman J., Senecal K., Seth S., Shen H., Shi Y., Shih J., Shimmel K., Sicotte H., Sifri S., Silva T., Simons J. V., Singh R., Skelly T., Sloan A. E., Sofia H. J., Soloway M. G., Song X., Sougnez C., Souza C., Staugaitis S. M., Sun H., Sun C., Tan D., Tang J., Tang Y., Thorne L., Trevisan F. A., Triche T., van den Berg D. J., Veluvolu U., Voet D., Wan Y., Wang Z., Warnick R., Weinstein J. N., Weisenberger D. J., Wilkerson M. D., Williams F., Wise L., Wolinsky Y., Wu J., Xu A. W., Yang L., Yang L., Zack T. I., Zenklusen J. C., Zhang J., Zhang W., Zhang J., Zmuda E., Molecular profiling reveals biologically discrete subsets and pathways of progression in diffuse glioma. Cell 164, 550–563 (2016). - PMC - PubMed
    1. Yan H., Parsons D. W., Jin G., McLendon R., Rasheed B. A., Yuan W., Kos I., Batinic-Haberle I., Jones S., Riggins G. J., Friedman H., Friedman A., Reardon D., Herndon J., Kinzler K. W., Velculescu V. E., Vogelstein B., Bigner D. D., IDH1 and IDH2 mutations in gliomas. N. Engl. J. Med. 360, 765–773 (2009). - PMC - PubMed
    1. Figueroa M. E., Abdel-Wahab O., Lu C., Ward P. S., Patel J., Shih A., Li Y., Bhagwat N., Vasanthakumar A., Fernandez H. F., Tallman M. S., Sun Z., Wolniak K., Peeters J. K., Liu W., Choe S. E., Fantin V. R., Paietta E., Löwenberg B., Licht J. D., Godley L. A., Delwel R., Valk P. J. M., Thompson C. B., Levine R. L., Melnick A., Leukemic IDH1 and IDH2 mutations result in a hypermethylation phenotype, disrupt TET2 function, and impair hematopoietic differentiation. Cancer Cell 18, 553–567 (2010). - PMC - PubMed
    1. Lu C., Ward P. S., Kapoor G. S., Rohle D., Turcan S., Abdel-Wahab O., Edwards C. R., Khanin R., Figueroa M. E., Melnick A., Wellen K. E., O’Rourke D. M., Berger S. L., Chan T. A., Levine R. L., Mellinghoff I. K., Thompson C. B., IDH mutation impairs histone demethylation and results in a block to cell differentiation. Nature 483, 474–478 (2012). - PMC - PubMed
    1. Ward P. S., Patel J., Wise D. R., Abdel-Wahab O., Bennett B. D., Coller H. A., Cross J. R., Fantin V. R., Hedvat C. V., Perl A. E., Rabinowitz J. D., Carroll M., Su S. M., Sharp K. A., Levine R. L., Thompson C. B., The common feature of leukemia-associated IDH1 and IDH2 mutations is a neomorphic enzyme activity converting alpha-ketoglutarate to 2-hydroxyglutarate. Cancer Cell 17, 225–234 (2010). - PMC - PubMed