. 2021 Oct;7(40):eabj0534.
doi: 10.1126/sciadv.abj0534. Epub 2021 Sep 29.

Iron oxide nanoparticles augment the intercellular mitochondrial transfer-mediated therapy

Affiliations

Iron oxide nanoparticles augment the intercellular mitochondrial transfer-mediated therapy

Ting Huang et al. Sci Adv. 2021 Oct.

Abstract

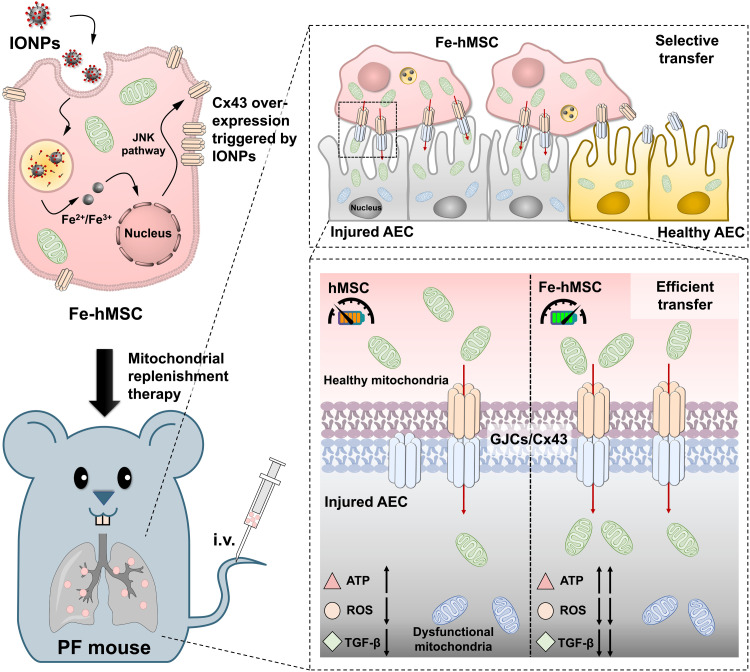
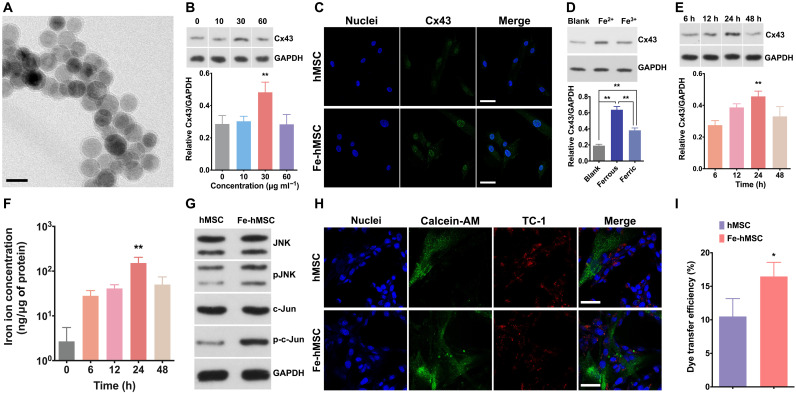
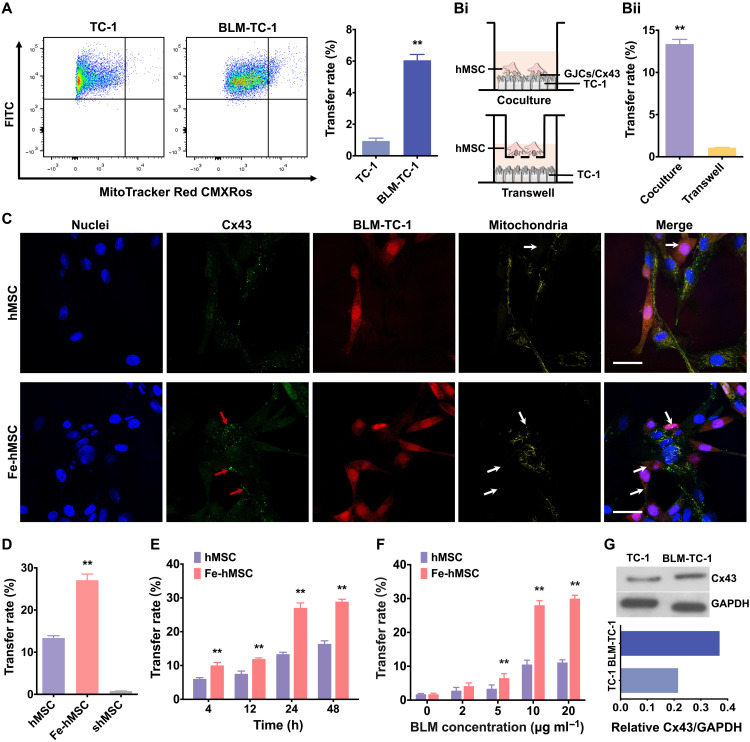
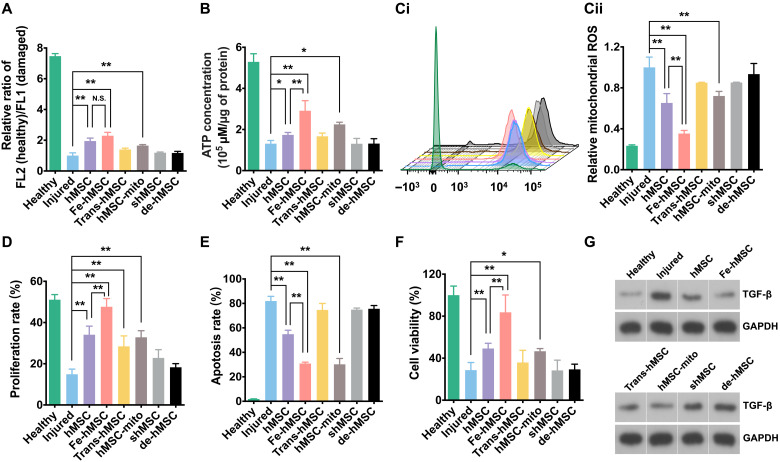
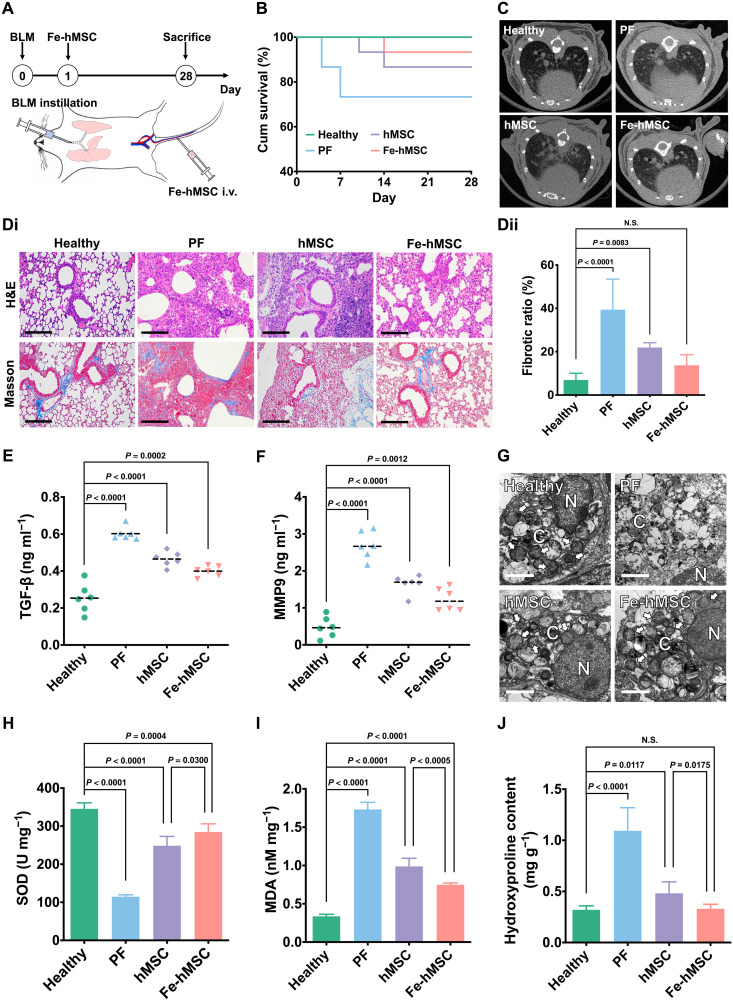
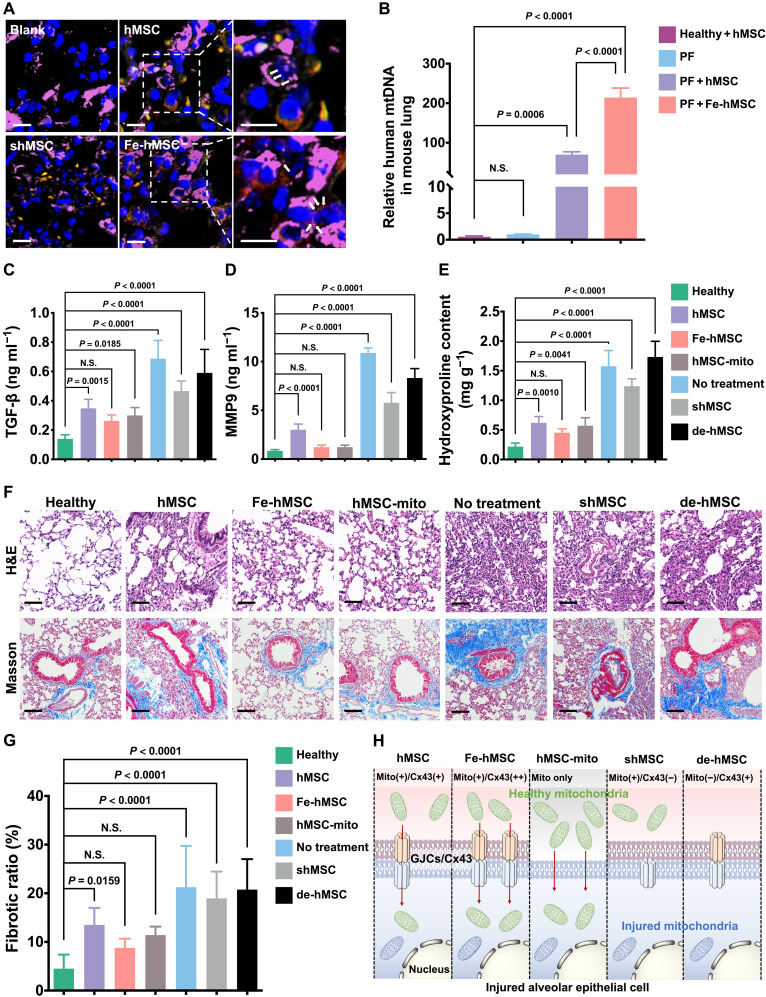
The transfer of mitochondria between cells has recently been revealed as a spontaneous way to protect the injured cells. However, the utilization of this natural transfer process for disease treatment is so far limited by its unsatisfactory transfer efficiency and selectivity. Here, we demonstrate that iron oxide nanoparticles (IONPs) can augment the intercellular mitochondrial transfer from human mesenchymal stem cells (hMSCs) selectively to diseased cells, owing to the enhanced formation of connexin 43–containing gap junctional channels triggered by ionized IONPs. In a mouse model of pulmonary fibrosis, the IONP-engineered hMSCs achieve a remarkable mitigation of fibrotic progression because of the promoted intercellular mitochondrial transfer, with no serious safety issues identified. The present study reports a potential method of using IONPs to enable hMSCs for efficient and safe transfer of mitochondria to diseased cells to restore mitochondrial bioenergetics.


Figures

Fig. 1.
Fig. 1.. Schematic illustration showing a potential strategy of using IONPs to augment the intercellular mitochondrial transfer from hMSCs specialized to injured AECs to prevent the progression of PF.
The cellular uptake of IONPs efficiently triggered the up-regulation of Cx43-containing GJCs of hMSCs, probably through c-Jun N-terminal kinase (JNK) pathway activation. These IONP-activated hMSCs (Fe-hMSCs) demonstrated the ability of transferring their healthy mitochondria to injured AECs selectively with a high transfer rate through the Cx43-containing GJCs, bringing significantly improved therapeutic outcomes in recovering adenosine triphosphate (ATP) levels and decreasing intracellular reactive oxygen species (ROS) and transforming growth factor–β (TGF-β) expression of injured AECs. Consequently, Fe-hMSCs could serve as a living battery of mitochondria to restore the bioenergetics in injured AECs for efficient PF intervention. i.v., intravenous injection.
Fig. 2.
Fig. 2.. IONPs significantly activated Cx43 overexpression in hMSCs.
(A) TEM image of the IONPs with hydrophilic surface coating. Scale bar, 20 nm. (B) Representative image of Western blot analysis and semiquantification of Cx43 expression after treating hMSCs with IONPs at various concentrations (n = 3). (C) Fluorescence images indicate Cx43 expression in hMSCs and Fe-hMSCs (IONPs at 30 μg ml−1). Blue, nuclei; green, Cx43. Scale bars, 20 μm. (D) Representative image and semiquantitative data of Cx43 expression after treating hMSCs with Fe2+ or Fe3+ at the iron concentration of 30 μg ml−1 assessed by Western blot analysis. hMSCs without any iron ion treatment were regarded as the blank group. The Cx43 expression levels among these groups were compared (n = 3). (E) Representative image of Western blot analysis and semiquantification of Cx43 expression in hMSCs at the indicated time points (n = 3). (F) Concentrations of iron ions in hMSCs at the indicated time points after the IONPs uptake (n = 4). (G) The intracellular signaling cascades of JNK pathway of hMSCs and Fe-hMSCs were assessed by Western blot analysis. (H) Intercellular transfer of calcein-AM from hMSCs to TC-1 cells observed by CLSM (blue, nuclei of cocultured hMSCs and TC-1 cells; green, calcein-AM; red, TC-1 cells). Scale bars, 20 μm. (I) Quantitative evaluation of intercellular dye transfer efficiency of calcein-AM from hMSCs or Fe-hMSCs toward TC-1 cells assessed by flow cytometry (n = 3). Data are presented as means ± SD (B, D to F, and I). Statistical significance was calculated using ordinary one-way analysis of variance (ANOVA) (B and D to F) and unpaired Student’s t test (I). *P < 0.05 and **P < 0.01.
Fig. 3.
Fig. 3.. IONPs significantly augmented intercellular mitochondrial transfer rates.
(A) Mitochondrial transfer rates from hMSCs to TC-1 and BLM-TC-1 cells were compared by assessing labeled mitochondria of hMSCs in GFP-expressing TC-1 cells or BLM-TC-1 cells using flow cytometry. The right panel shows quantitative data of the left panel (n = 3). (B) Comparison of mitochondrial transfer rate between the coculture system and Transwell system. (Bi) Schematic illustration showing the coculture system and Transwell system. (Bii) Quantitative data on the transfer rates of two types of cell culture systems (n = 3). (C) CLSM images of Cx43 expression and its relationship with the intercellular transfer of mitochondria from hMSCs or Fe-hMSCs to BLM-TC-1 cells. Red arrows indicate Cx43 expression localized in the transferred mitochondria; white arrows indicate the transferred mitochondria. Scale bars, 20 μm. (D) Quantitative comparison of mitochondrial transfer rates of hMSCs, Fe-hMSCs, and shMSCs to BLM-TC-1 cells after a 24-hour coculture (n = 3). (E) Mitochondrial transfer rates of hMSCs and Fe-hMSCs at the indicated time points following coculture with BLM-TC-1 cells (n = 3). (F) Mitochondrial transfer rate from hMSCs and Fe-hMSCs to TC-1 cells treated with different concentrations of BLM (n = 3). (G) Cx43 expression levels of TC-1 cells with or without BLM treatments assessed by Western blot analysis. Semiquantitative data of the top panel are shown in the bottom panel. Data are presented as means ± SD (A, B, and D to F). Statistical significance was calculated using unpaired Student’s t test (A and B), ordinary one-way ANOVA (D), and ordinary two-way ANOVA (E and F). **P < 0.01.
Fig. 4.
Fig. 4.. IONPs improved the therapeutic ability of hMSCs to restore injured cells.
(A) Mitochondrial membrane potentials of TC-1 cells after the indicated treatments assessed by comparing the ratio of healthy mitochondria to damaged mitochondria (n = 3). (B) Intracellular ATP levels of TC-1 cells after the indicated treatments (n = 3). (C) Relative mitochondrial ROS levels of TC-1 cells after the indicated treatments. (Ci) Fluorescence intensity of ROS probe evaluated by flow cytometry. (Cii) Quantitative data of Ci (n = 3). (D) Proliferation rates of TC-1 cells after the indicated treatments evaluated by the ethynyl deoxyuridine (EdU) cell proliferation detection kit (n = 3). (E and F) Cellular apoptosis and viability of TC-1 cells after the indicated treatments (n = 3). (G) TGF-β expression levels of TC-1 cells after the indicated treatments. Data are presented as means ± SD (A to F). Statistical significance was calculated using ordinary one-way ANOVA (A to F). *P < 0.05 and **P < 0.01. N.S., no significant difference.
Fig. 5.
Fig. 5.. The augmented mitochondrial transfer by using IONPs attributed to an efficient intervention of PF progression.
(A) Schematic illustration showing therapeutic evaluations. Intratracheal BLM was administered to C57BL/6 mice to induce PF. Therapeutic 5 × 10⁵ hMSCs were systemically administered through the tail vein on the next day after BLM-induced injury. Curative evaluations were conducted on day 28. (B) Kaplan-Meier survival curves of fibrotic mice with various treatments (n = 15). (C) Micro-CT images of mice lungs after various treatments on day 28. (D) Pathological examination of recipient mice pulmonary sections. (Di) Representative images of H&E staining and Masson’s trichrome staining of pulmonary sections. Scale bars, 100 μm. (Dii) Quantitative data of the fibrotic area calculated from pulmonary sections using Masson’s trichrome staining using ImageJ (n = 6). (E and F) Amount of TGF-β and MMP9 in the collected BALF (n = 6). (G) TEM images of AECs after the indicated treatments. N refers to the cell nucleus, and C refers to the cytoplasm. Scale bars, 2 μm. (H to J) Levels of SOD, MDA, and hydroxyproline in lung homogenates (n = 5). Data are presented as means ± SD (D and H to J) and means with scatter dot plot (E and F). Statistical significance was calculated using log-rank test (B) and ordinary one-way ANOVA (D to F and H to J).
Fig. 6.
Fig. 6.. The mitochondrial transfer rate determines the therapeutic efficiency against PF progression.
(A) Representative images of recipient mice pulmonary sections after immunofluorescence staining. The transferred mitochondria originating from hMSCs or Fe-hMSCs are indicated by white arrows. (Blue, nuclei; green, hMSCs, Fe-hMSCs, and shMSCs; red, mitochondria of hMSCs or Fe-hMSCs; purple, AECs). Scale bars, 10 μm (left); 5 μm (right). (B) Relative amount of human mtDNA in isolated AECs (n = 3). (C and D) Amount of TGF-β and MMP9 in collected BALF after the indicated treatments (n = 6). (E) Hydroxyproline content in lung homogenates after the indicated treatments (n = 3). (F) Representative images of H&E-stained and Masson’s trichrome–stained pulmonary sections after the indicated treatments. Scale bars, 100 μm. (G) Quantitative analysis of the fibrotic area according to the above Masson’s trichrome staining was conducted in ImageJ (n = 6). (H) Schematic figure illustrating that the efficiency of the current therapeutic strategy is closely related to the mitochondrial transfer rate through Cx43-containing GJC approach. Data are presented as means ± SD (B to E and G). Statistical significance was calculated using ordinary one-way ANOVA (B to E and G).

References

    1. Youle R. J., van der Bliek A. M., Mitochondrial fission, fusion, and stress. Science 337, 1062–1065 (2012). - PMC - PubMed
    1. Nicolás-Ávila J. A., Lechuga-Vieco A. V., Esteban-Martinez L., Sanchez-Diaz M., Diaz-Garcia E., Santiago D. J., Rubio-Ponce A., Li J. L., Balachander A., Quintana J. A., Martínez-de-Mena R., Castejón-Vega B., Pun-Garcia A., Traves P. G., Bonzon-Kulichenko E., Garcia-Marques F., Cussó L., A-González-Guerra N., Roche-Molina M., Martin-Salamanca S., Crainiciuc G., Guzman G., Larrazabal J., Herrero-Galan E., Alegre-Cebollada J., Lemke G., Rothlin C. V., Jimenez-Borreguero L. J., Reyes G., Castrillo A., Desco M., Muñoz-Cánoves P., Ibáñez B., Torres M., Ng L. G., Priori S. G., Bueno H., Vázquez J., Cordero M. D., Bernal J. A., Enriquez J. A., Hidalgo A., A network of macrophages supports mitochondrial homeostasis in the heart. Cell 183, 94–109.e23 (2020). - PubMed
    1. Islam M. N., Das S. R., Emin M. T., Wei M., Sun L., Westphalen K., Rowlands D. J., Quadri S. K., Bhattacharya S., Bhattacharya J., Mitochondrial transfer from bone-marrow-derived stromal cells to pulmonary alveoli protects against acute lung injury. Nat. Med. 18, 759–765 (2012). - PMC - PubMed
    1. Hayakawa K., Esposito E., Wang X., Terasaki Y., Liu Y., Xing C., Ji X., Lo E. H., Transfer of mitochondria from astrocytes to neurons after stroke. Nature 535, 551–555 (2016). - PMC - PubMed
    1. Fang E. F., Hou Y., Palikaras K., Adriaanse B. A., Kerr J. S., Yang B., Lautrup S., Hasan-Olive M. M., Caponio D., Dan X., Rocktaschel P., Croteau D. L., Akbari M., Greig N. H., Fladby T., Nilsen H., Cader M. Z., Mattson M. P., Tavernarakis N., Bohr V. A., Mitophagy inhibits amyloid-β and tau pathology and reverses cognitive deficits in models of Alzheimer’s disease. Nat. Neurosci. 22, 401–412 (2019). - PMC - PubMed