. 2021 Sep 29;17(9):e1009777.
doi: 10.1371/journal.pgen.1009777. eCollection 2021 Sep.

Dyrk1a gene dosage in glutamatergic neurons has key effects in cognitive deficits observed in mouse models of MRD7 and Down syndrome

Affiliations

Dyrk1a gene dosage in glutamatergic neurons has key effects in cognitive deficits observed in mouse models of MRD7 and Down syndrome

Véronique Brault et al. PLoS Genet. .

Abstract

Perturbation of the excitation/inhibition (E/I) balance leads to neurodevelopmental diseases including to autism spectrum disorders, intellectual disability, and epilepsy. Loss-of-function mutations in the DYRK1A gene, located on human chromosome 21 (Hsa21,) lead to an intellectual disability syndrome associated with microcephaly, epilepsy, and autistic troubles. Overexpression of DYRK1A, on the other hand, has been linked with learning and memory defects observed in people with Down syndrome (DS). Dyrk1a is expressed in both glutamatergic and GABAergic neurons, but its impact on each neuronal population has not yet been elucidated. Here we investigated the impact of Dyrk1a gene copy number variation in glutamatergic neurons using a conditional knockout allele of Dyrk1a crossed with the Tg(Camk2-Cre)4Gsc transgenic mouse. We explored this genetic modification in homozygotes, heterozygotes and combined with the Dp(16Lipi-Zbtb21)1Yey trisomic mouse model to unravel the consequence of Dyrk1a dosage from 0 to 3, to understand its role in normal physiology, and in MRD7 and DS. Overall, Dyrk1a dosage in postnatal glutamatergic neurons did not impact locomotor activity, working memory or epileptic susceptibility, but revealed that Dyrk1a is involved in long-term explicit memory. Molecular analyses pointed at a deregulation of transcriptional activity through immediate early genes and a role of DYRK1A at the glutamatergic post-synapse by deregulating and interacting with key post-synaptic proteins implicated in mechanism leading to long-term enhanced synaptic plasticity. Altogether, our work gives important information to understand the action of DYRK1A inhibitors and have a better therapeutic approach.


Conflict of interest statement

I have read the journal’s policy and the authors of this manuscript have the following competing interests: SDG is Founder, President and CEO of Proteas Bioanalytics Inc., BioLabs at the Lundquist Institute, 1124 West Carson Street, Torrance, CA, USA.

Figures
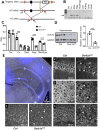
Fig 1
Fig 1. Generation of mice deficient for Dyrk1a in the glutamatergic neurons.
(A) Targeting strategy for conditional inactivation of Dyrk1a. Exon 7 containing the serine/threonine protein kinase active site was flanked with loxP sites (red arrowheads) in two steps: a targeted allele was first generated by homologous recombination in ES cells, then in vivo expression of the Flp recombinase resulted in recombinaison of the FRT sites (green arrowheads) and removal of the selection cassette (white box) generating the conditional allele (cKO). The knock-out allele (KO) was observed in the brain of Dyrk1aC/C. Arrows represent primers for PCR genotyping. (B) Genomic DNA was isolated from different organs from a Dyrk1aC/C mouse and genotyped for the presence of the knock-out allele with primers Lf and Er, giving a 232 bp PCR product for the KO allele. (C) Ratio of relative mRNA of Dyrk1a in different brain structures in Dyrk1aC/C and disomic control mice. (D) Autoradiographic image and quantification of immunoblots of DYRK1A protein in the hippocampus of Dyrk1aC/C mice relative to control mice. Band intensities were estimated using ImageJ and normalized against the loading control GAPDH. Data are presented as point plots with mean ± SD with unpaired Student’s t-test, *p<0.05, **p<0.01, ***p<0.001 (n = 5 ctrl and 4 Dyrk1aC/C hippocampus for mRNA analysis and n = 3 per genotype for protein analysis). (E) DYRK1A immunohistochemistry of coronal brain sections around Bregma -1.5 mm (Paxinos adult mouse brain atlas, Franklin and Paxinos, 1997) at the level of the hippocampus and of the cortex from a control and a Dyrk1aC/C mouse (2-month-old males). Expression of DYRK1A was detected in the cytoplasm of the neurons of the control (Ctrl) and a net decrease of expression was observed in Dyrk1aC/C neurons as visible in the high-magnification images of the cortex (1), Cornus Ammonis 1(CA1, 2), Cornus Ammonis 3(CA3, 3) and Dentate Gyrus (DG, 4) (white arrows point at neurons with little or no DYRK1A signal). DYRK1A signal is in grey while the blue color corresponds to DAPI in the representative image of the analyzed brain region. DAPI signal was removed from high-magnification images to better visualize DYRK1A signal and nuclei hence appear as black dots on those images.
Fig 2
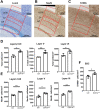
Fig 2. Consequence of Dyrk1a inactivation in glutamatergic neurons on brain morphology.
(A) Brain weight from male and female mice aged 3 months old (n = 7–9 per genotype). (B) Representative coronal sections of control (Ctrl) (left) and Dyrk1aC/C (right) brains at Bregma -1.5 stained with cresyl violet and luxol blue that were used for measurements (Magnification 20X). (C) Dot plots of total brain area measurements (red line around the brain in B). (D) Dot plots of hippocampal areas (red area around hipp in B). (E) Measurements of the thickness of the cortex at the 3 levels represented by red lines in figure B. (F) Representative cresyl violet and luxol blue stained coronal sections of somatosensory cortex layers in control (Ctrl) and Dyrk1aC/C brains at Bregma -1.5. (G) Measurements of the thickness of the different layers presented in F. Data are presented as point plots with mean ± SD with unpaired Student’s t-test, *p<0.05, **p<0.01, ***p<0.001 (n = 3 females per genotype). AUD: auditory cortex, SSC: somatosensory cortex, DMC: dorso motor cortex, Hipp: hippocampus.
Fig 3
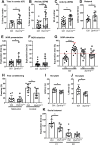
Fig 3. Analysis of cell density in the SSC of Dyrk1aC/C mice.
Representative cresyl violet and luxol blue stained (A), NeuN-labeled (B) and S100b-labeled (C) coronal sections at Bregma -1.5 with the counting frames. (D-F) Relative density of cells counted within a frame of 0.1 cm width at the level of the SSC. Data are presented as point plots with mean ± SD with unpaired Student’s t-test, *p<0.05, **p<0.01, ***p<0.001 (n = 3 females aged 3 months per genotype).
Fig 4
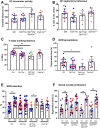
Fig 4. Impact of Dyrk1a inactivation in glutamatergic neurons on general behavior, locomotor activity and cognition.
(A) The exploratory behavior of a new environment was analyzed by the percentage of time spent in the center of an open field over 30 min of test. Dyrk1aC/C mice spent more time in the center of the arena, suggesting that they are less anxious. (B) Confirmation of the phenotype in a new group of mice using the Elevated Plus Maze test (EPM) with Dyrk1aC/C mice showing a higher percentage of time spent in the open arms of the maze. (C) Mouse activity, measured by the number of entries in both open and closed arms, was increased in Dyrk1aC/C animals. (D) Evaluation of the locomotor performance on the rotarod during consecutive trials with increased rotational speeds. The latency is the mean of 3 independent trials. Dyrk1aC/C mice showed increased performance. (E) In the NOR test, the percentage of time spent exploring the familiar (FO) and the new (NO) objects show that control mice spend significantly more time on the NO while Dyrk1aC/C mice do not make any difference between the two objects. (F) Exploration times of the two identical objects during the presentation phase of the NOR show that Dyrk1aC/C mice tend to have an increased exploration time. (G) Total exploratory time of the two objects during the test indicates that the absence of object discrimination of the Dyrk1aC/C mice is not due to a lack of interest of the objects. (H) Percentage of freezing time during the habituation phase (before the foot shock; basal level of activity) (Habituation; Mann-Whitney rank sum test, p = 0.71) and during the 6 min of contextual exposure 24 hours later indicate a deficit of contextual learning in Dyrk1aC/C mice. (I-J) Pain sensitivity was evaluated by measuring the mouse latency to elicit a response to pain when put on a plate (52°C). In this test, Dyrk1aC/C and Dyrk1a+/- mice had a lower threshold than their control littermates. (K) Interest in social interaction was measured by the time spent sniffing the cage containing a congener (C1) during the Crawley test. This time was reduced for Dyrk1aC/C mice compared to control mice (unpaired t-test p = 0.01) while the time spent exploring the empty cage (EC) was the same between the two groups (unpaired t-test p = 0.23). Data are presented as point plots with mean ± SD. Statistical analyses were done with unpaired Student’s t-test or Mann-Whitney rank sum test if normality test failed, except E: paired T-test FO vs NO and one sample T-test vs 50% mean (in red: ***p<0.001); A, D, H, I and K: tests were done on young males (1.5–3.5 months old depending on the test with animals aged ± 3 weeks), n = 8–10 per genotype,. B-C (EPM) and E-G (NOR) were done with another batch of males a 4 months of age, n = 18 and 16 controls for each test respectively and 13 Dyrk1aC/C(2 animals were removed from the NOR test because they did not reach the minimum exploration time during the presentation session); *p<0.05, **p<0.01, ***p<0.001.
Fig 5
Fig 5. Consequence of the normalization of Dyrk1a in glutamatergic neurons of Dp1Yey mice on animal cognition.
(A) The total distance travelled in the open field during a 30 min session is significantly increased in the Dp1Yey/Dyrk1aC/+ mice compared to the control mice (Kruskal-Wallis One Way Analysis of Variance on Ranks, p = 0.009 with Dunn’s post hoc multiple comparison procedures versus control, Dp1Yey/Dyrk1C//+ vs control, p = 0.007). (B) Percentage time spent in the center of the OF does not vary between genotypes (One way ANOVA, F(3, 40) = 2.76, p = 0.054). (C) Percentage of spontaneous alternation of the mice during a 5 min session in a Y-maze. Lower percentage of alternation was found in Dp1Yey mice and in Dp1Yey/Dyrk1aC/+ indicating a deficit in working memory in Dp1Yey mice that is not rescued in Dp1Yey/Dyrk1aC/+ mice (One way ANOVA, Holm-Sidak method for multiple comparisons versus control group, F(3,49) = 4.3, p = 0.009, Dp1Yey vs control q = 2.48, p = 0.03, Dp1Yey/Dyrk1aC/+ q = 3.24, p = 0.006). (D-E) Novel object recognition was assessed with 24 hours time laps. (D) Time spent exploring the two identical objects during the first object presentation session was decreased in Dp1Yey/Dyrk1aC/+ mice (Kruskal-Wallis One Way Analysis of Variance on Ranks, p = 0.02 with Dunn’s post hoc multiple comparison procedures versus control, Dp1Yey/Dyrk1aC//+ vs control, p = 0.02). (E) When introducing the novel object during the retention period, both control and Dp1Yey/Dyrk1aC/+ lines spent significantly more time exploring the novel object than the familiar one (Paired t-test novel object vs familiar object, ctrl p = 0.003, Dp1Yey/Dyrk1aC/+ p = 0.02), whereas Dp1Yey and Dyrk1aC/+ mice did not (Paired t-test novel object vs familiar object, Dp1Yey p = 0.57, Dyrk1aC/+ p = 0.56), revealing a significant deficit in memory for both Dp1Yey and Dyrk1aC/+ mice which is rescued in Dp1Yey/Dyrk1aC/+ mice. (F) Mice were tested for social novelty preference. All the genotypes but Dp1Yey spent significantly more time sniffing the new congener (Paired t-test congener vs empty cage, ctrl p = 0.004, Dp1Yey p = 0.13, Dp1Yey/Dyrk1aC/+ p = 0.002, Dyrk1aC/+ p = 0.002). Data are presented as point plots with mean ± SD. (n = 8–15 per genotype, *p<0.05, **p<0.01). Males (in blue) and females (in red) are pooled in the same graph as the statistical analyses did not reveal significant effect of sex.
Fig 6
Fig 6
Proteomic analysis (A) Venn diagram showing the numbers of deregulated proteins in the different mouse models. The numbers of proteins shown for the Dp1Yey/Dyrk1aC/+ model (in dark blue) correspond to proteins that were deregulated in the Dp1Yey and back to normal levels in this model (proteins that are regulated by Dyrk1a in the trisomy). Proteins deregulated by both Dyrk1a up and down-regulation (common to Dp1Yey, Dp1Yey/Dyrk1aC/+ and Dyrk1aC/+) are listed in the grey shaded box. (B) Radar plots of GO terms that are mostly enriched in the Dp1Yey model (in red with scale bar corresponding to the log of the p-value) and of the proportion of the proteins found deregulated in Dp1Yey which amount is normalized by the return in 2 copies in the Dp1Yey/Dyrk1aC/+ model (in blue with scale bar corresponding to the % of Dp1Yey deregulated protein back to normal levels). (C) Visual representation of the GO enrichments for the deregulated proteins in Dp1Yey and Dyrk1aC/+ hippocampi with connection between common terms. The different categories of GO are represented by different colors: pink for Cellular components”, blue for “Molecular functions”, green for “Pathways”, orange for “Biological processes” and grey for “Phenotypes”. The list of proteins in the box corresponds to proteins present in the common deregulated GO terms (in red deregulated proteins in Dp1Yey and in green proteins deregulated in Dyrk1aC/+). (D) Western blots of DYRK1A, NR2B, PSD95, SYNGAP and CAMK2 proteins following IPs of wild-type mice brain extracts. We found in NR2B, PSD95 and CAMK2 in the IPs of DYRK1A. We also detected DYRK1A in the IPs of NR2B, PSD95 and SYNGAP.

References

    1. van Bon BW, Coe BP, Bernier R, Green C, Gerdts J, Witherspoon K, et al.. Disruptive de novo mutations of DYRK1A lead to a syndromic form of autism and ID. Mol Psychiatry. 2016;21(1):126–32. Epub 2015/02/24. doi: 10.1038/mp.2015.5 ; PubMed Central PMCID: PMC4547916. - DOI - PMC - PubMed
    1. van Bon BW, Hoischen A, Hehir-Kwa J, de Brouwer AP, Ruivenkamp C, Gijsbers AC, et al.. Intragenic deletion in DYRK1A leads to mental retardation and primary microcephaly. Clin Genet. 2011;79(3):296–9. doi: 10.1111/j.1399-0004.2010.01544.x . - DOI - PubMed
    1. Duchon A, Herault Y. DYRK1A, a Dosage-Sensitive Gene Involved in Neurodevelopmental Disorders, Is a Target for Drug Development in Down Syndrome. Front Behav Neurosci. 2016;10:104. Epub 2016/06/03. doi: 10.3389/fnbeh.2016.00104; PubMed Central PMCID: PMC4891327. - DOI - PMC - PubMed
    1. Ji JL, Lee H, Argiropoulos B, Dorrani N, Mann J, Martinez-Agosto JA, et al.. DYRK1A haploinsufficiency causes a new recognizable syndrome with microcephaly, intellectual disability, speech impairment, and distinct facies. European Journal of Human Genetics. 2015;23(11):1473–81. doi: 10.1038/ejhg.2015.71 WOS:000362916200010. - DOI - PMC - PubMed
    1. Evers JM, Laskowski RA, Bertolli M, Clayton-Smith J, Deshpande C, Eason J, et al.. Structural analysis of pathogenic mutations in the DYRK1A gene in patients with developmental disorders. Hum Mol Genet. 2017;26(3):519–26. doi: 10.1093/hmg/ddw409 ; PubMed Central PMCID: PMC5409128. - DOI - PMC - PubMed

Publication types

MeSH terms

Substances