. 2021 Dec 2;138(22):2256-2268.
doi: 10.1182/blood.2021013231.

Insights in ChAdOx1 nCoV-19 vaccine-induced immune thrombotic thrombocytopenia

Affiliations

Insights in ChAdOx1 nCoV-19 vaccine-induced immune thrombotic thrombocytopenia

Andreas Greinacher et al. Blood. .

Abstract

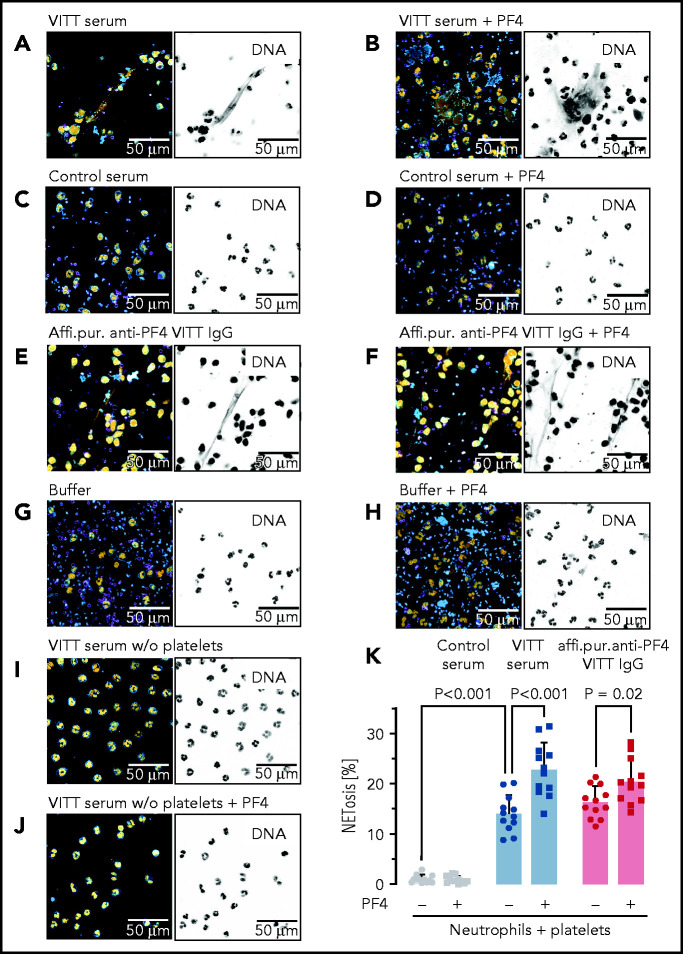
SARS-CoV-2 vaccine ChAdOx1 nCoV-19 (AstraZeneca) causes a thromboembolic complication termed vaccine-induced immune thrombotic thrombocytopenia (VITT). Using biophysical techniques, mouse models, and analysis of VITT patient samples, we identified determinants of this vaccine-induced adverse reaction. Super-resolution microscopy visualized vaccine components forming antigenic complexes with platelet factor 4 (PF4) on platelet surfaces to which anti-PF4 antibodies obtained from VITT patients bound. PF4/vaccine complex formation was charge-driven and increased by addition of DNA. Proteomics identified substantial amounts of virus production-derived T-REx HEK293 proteins in the ethylenediaminetetraacetic acid (EDTA)-containing vaccine. Injected vaccine increased vascular leakage in mice, leading to systemic dissemination of vaccine components known to stimulate immune responses. Together, PF4/vaccine complex formation and the vaccine-stimulated proinflammatory milieu trigger a pronounced B-cell response that results in the formation of high-avidity anti-PF4 antibodies in VITT patients. The resulting high-titer anti-PF4 antibodies potently activated platelets in the presence of PF4 or DNA and polyphosphate polyanions. Anti-PF4 VITT patient antibodies also stimulated neutrophils to release neutrophil extracellular traps (NETs) in a platelet PF4-dependent manner. Biomarkers of procoagulant NETs were elevated in VITT patient serum, and NETs were visualized in abundance by immunohistochemistry in cerebral vein thrombi obtained from VITT patients. Together, vaccine-induced PF4/adenovirus aggregates and proinflammatory reactions stimulate pathologic anti-PF4 antibody production that drives thrombosis in VITT. The data support a 2-step mechanism underlying VITT that resembles the pathogenesis of (autoimmune) heparin-induced thrombocytopenia.


Figures

Figure 1.
Figure 1.
Complex formation of PF4, vaccine components, and anti-PF4 antibodies on platelet surfaces. (A) 3D super-resolution microscopy of PF4, AV and affinity-purified anti-PF4 antibodies (obtained from VITT patients) reveals complex formation. Upper left panel: PF4 (green) and AV hexon protein (purple) accumulation on platelet surfaces. Scale bar, 1 µm. Lower left panel: Localization microscopy (dSTORM) of PF4 (green) at ChAdOx1 vaccine aggregates (AV, purple). Scale bar, 200 nm. Right panel: colocalization of ChAdOx1 AV hexon protein (AV; purple), PF4 (green) and purified anti-PF4 IgG from VITT patient sera (blue). Scale bar, 200 nm. (B) Relative composition of 192 complexes analyzed. Approximately 44.5% of complexes investigated showed VITT anti-PF4 IgG bound to particles containing both PF4 and AV hexon proteins. (C) Analyses of ChAdOx1 nCoV-19 vaccine by DLS. Diameter of ChAdOx1 nCoV-19 vaccine aggregates before (left) and after addition of PF4 (+PF4, 10 µg/ml). Incubation of mouse anti-P F4 recombinant antibody (clone RTO) or purified anti-PF4 IgG from VITT patients increased the size of vaccine aggregates in the presence of PF4. Addition of DNA further increased the size of PF4/vaccine aggregates (+DNA). In contrast, addition of heparin (100 IU/mL) dissociated previously formed vaccine/PF4/anti-PF4 IgG complexes. Each data point represents 12 runs of n ≥3 individual measurements. Statistical assessment by ordinary 1-way analysis of variance (ANOVA) with Sidak's multiple comparisons test. (D) Negative charge indicated by surface ζ potential (ζ,13 mV) of ChAdOx1 nCoV-19 vaccine particles in the presence of buffer (control), UFH (1 IU/mL), PF4 (reduced the negative charge; −5 mV), and coapplication of PF4 and heparin. Statistical assessment by Brown-Forsythe and Welch ANOVA test followed by Dunnett's T3 multiple comparisons test. Transmission electron microscopy images of aggregates formed in the vaccine upon addition of PF4. (E) Vaccine without added PF4 shows the virion particles and multiple small amorphous structures. (F) Aggregate (arrowhead) formation in the vaccine following addition of PF4. Biotinylated PF4 (arrow) is labeled with 10 nm gold particles. (G) Aggregate (arrowhead) as in panel F. Here, AV capsid protein (arrow) is labeled with 10 nm gold particles. Scale bars, 100 nm.
Figure 2.
Figure 2.
ChAdOx1 nCoV-19 vaccine contains multiple proteins originating from the AV production process. (A) Four distinct lots of ChAdOx1 nCoV-19 vaccine were separated by 1D SDS-PAGE and proteins were visualized by silver staining. (B) Proteomics of ChAdOx1 nCoV-19 vaccine: iBAQ protein intensities and theoretical molecular masses of identified proteins. Protein intensities of vaccine lot 3 were calculated using the iBAQ algorithm (≥3 unique peptides per protein) and plotted against theoretical molecular mass. Human proteins are indicated in gray and ChAdOx1 proteins in blue. Furthermore, green dots mark human membrane proteins (UniProt annotation) and the single red dot shows the SARS-CoV-2 spike protein. Total amount of protein determined in 5 different lots ranged between 70-80 µg/mL, with human proteins constituting ∼43% to 60% of total proteins.
Figure 3.
Figure 3.
ChAdOx1 nCoV-19 vaccine contains EDTA and induces inflammatory reactions in mouse edema models and vaccinated individuals. (A) 1H-NMR spectrum of ChAdOx1 nCoV-19 vaccine showed signals of sucrose, ethanol, histidine, and EDTA (∼100 µM). X-axis: NMR chemical shift signals in ppm relative to internal standard TSP; y-axis: relative signal intensity. (B) Skin edema in wild-type mice was induced by intradermal injection of 50 μL each saline, EDTA (100 μM), or ChAdOx1 nCoV-19. Evans blue dye was intravenously infused as a tracer, and after 30 minutes extravasated dye was quantified. Columns show mean ± SD, n = 41 per group. Paired 1-way ANOVA followed by Dunn’s multiple comparison test. (C) Digital PCR quantified AV DNA 30 minutes after intradermal injection of 50 μL ChAdOx1 nCoV-19 in wild-type mice. Segments give relative percentage in multiple organs of disseminated ChAdOx1 nCoV-19 AV copy numbers; n = 3 individual experiments. (D) Skin reaction 2 days after ChAdOx1 nCov-19 vaccination and following symptom resolution on day 14. D-Dimer was elevated at 4 and 6 days following ChAdOx1 nCoV-19 vaccination, with symptom resolution in following days.
Figure 4.
Figure 4.
VITT patient antibodies activate platelets in a PF4, FcγRIIA, and polyanion dependent manner. (A) Platelet activation by VITT sera in the presence of buffer (n = 60 independent experiments), PF4 (n = 78), DNA (n = 18), and short-chain polyphosphate (polyP70; n = 29). Numbers refer to total experiments with 14 VITT sera and healthy donor platelets. A shorter reaction time indicates stronger platelet activation. Patient sera and platelet donors were selected for these experiments by assessing those VITT sera that did not induce strong platelet activation in the presence of buffer to enable cross-reactivity testing. (B) Sera of VITT patients were incubated with washed platelets from healthy donors in the presence or absence of PF4 (10 µg/mL) and/or monoclonal antibody IV.3, which blocks the platelet FcγRIIA receptor (n = 31). Datasets were compared using Wilcoxon matched-pairs signed rank test.
Figure 5.
Figure 5.
VITT patient anti-PF4 antibodies trigger NETosis. (A-B) Confocal laser scanning microscopy images of in vitro NETs generated by human neutrophils and platelets following incubation with VITT patient serum alone (A) or VITT patient serum in combination with PF4 (B). (C-D) NET formation induced in healthy control serum alone (C) or healthy serum in the presence of PF4 (D). (E-H) NET formation induced by affinity-purified (Affi.pur.) anti-PF4 IgG from VITT patients (E); combination of anti-PF4 IgG from VITT patients and PF4 (F); buffer; (G) or PF4 only (H). (I-J) Neutrophils (without [w/o] platelets) were incubated with VITT patient serum (I) or VITT patient serum and PF4 (J), and NET formation was measured. (K) Quantification of NETs (NETosis [%]) from confocal laser scanning microscopy images obtained from nuclear and extracellular DNA fluorescent channels was performed using at least 12 individual images for each condition, n = 3 experimental replicates. Statistical analysis was performed using the Welch and Brown-Forsythe ANOVA multiple comparisons test with post hoc 2-stage step-up method per Benjamini, Krieger, and Yekutieli, q = 0.05.
Figure 6.
Figure 6.
NETs in VITT patient cerebral sinus vein thrombi. (A) Cell-free DNA serum levels of VITT patients and controls using fluorescent DNA-intercalating dye Sytox Green. Statistical comparison by unpaired Student t test; (B) Serum citrullinated histone H3 (CitH3) levels in VITT patients and healthy controls measured by ELISA. Statistical comparison by unpaired Student t test; (C) Serum MPO levels in VITT patients and healthy controls quantified using an ELISA. Mann-Whitney nonparametric test compared the 2 groups. (D) Hematoxylin and eosin (H&E) stained histologic section of a cerebral venous sinus thrombus of a VITT patient. Arrows indicate amorphous fibrin (green) and granulocyte-rich areas (white) in the thrombus core, respectively (E-J). Immunohistochemistry images of the VITT patient cerebral sinus vein thrombus shown in panel A. The section assessed in more detail in panels C, E, and G are given as small rectangles in panels B, D, and F. Markers for NETs and neutrophils include NE (red) in panels E and F, and MPO (red) in panels G and H. Von Willebrand factor (vWF, red) is shown in panels I and J for comparison. DAPI stains DNA in blue while chromatin (antihistone H2A/H2B/DNA-complexes) is shown in green.
Figure 7.
Figure 7.
Scheme of proposed procoagulant mechanisms in VITT. Early reactions: Initial VITT reactions are triggered by complexes formed by PF4 and vaccine constituents and are accompanied by an inflammation-induced “danger signal.” Both events occur early following vaccination (days 1-2). Late reactions: In some vaccine recipients, PF4/vaccine-induced activation of B cells produces high-titer anti-PF4 autoantibodies that bind to platelets and induce platelet activation. Anti-PF4 antibodies together with platelets activate granulocytes (neutrophils) to release procoagulant NETs (NETosis), culminating in VITT-associated thrombosis.

Comment in

References

    1. Vaxzevria (priviously COVID-19 Vaccine Astra Zeneca) : EPAR - Product information, vol. 2021. European Medicines Agency; 2021
    1. Greinacher A, Thiele T, Warkentin TE, Weisser K, Kyrle PA, Eichinger S.. Thrombotic Thrombocytopenia after ChAdOx1 nCov-19 Vaccination. N Engl J Med. 2021;384(22):2092-2101. - PMC - PubMed
    1. Schultz NH, Sørvoll IH, Michelsen AE, et al. . Thrombosis and Thrombocytopenia after ChAdOx1 nCoV-19 Vaccination. N Engl J Med. 2021;384(22):2124-2130. - PMC - PubMed
    1. Sánchez van Kammen M, Heldner MR, Brodard J, et al. . Frequency of Thrombocytopenia and Platelet Factor 4/Heparin Antibodies in Patients With Cerebral Venous Sinus Thrombosis Prior to the COVID-19 Pandemic. JAMA. 2021;326(4):332-338. - PMC - PubMed
    1. Krauel K, Pötschke C, Weber C, et al. . Platelet factor 4 binds to bacteria, [corrected] inducing antibodies cross-reacting with the major antigen in heparin-induced thrombocytopenia. Blood. 2011;117(4):1370-1378. - PubMed

Publication types

MeSH terms