. 2022 Jan 25;6(2):690-703.
doi: 10.1182/bloodadvances.2021005198.

FlowCT for the analysis of large immunophenotypic data sets and biomarker discovery in cancer immunology

Affiliations

FlowCT for the analysis of large immunophenotypic data sets and biomarker discovery in cancer immunology

Cirino Botta et al. Blood Adv. .

Abstract

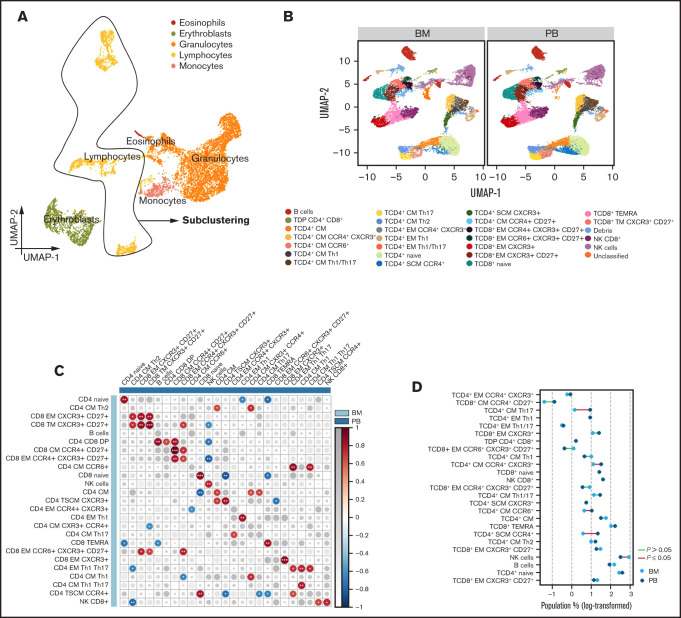
Large-scale immune monitoring is becoming routinely used in clinical trials to identify determinants of treatment responsiveness, particularly to immunotherapies. Flow cytometry remains one of the most versatile and high throughput approaches for single-cell analysis; however, manual interpretation of multidimensional data poses a challenge when attempting to capture full cellular diversity and provide reproducible results. We present FlowCT, a semi-automated workspace empowered to analyze large data sets. It includes pre-processing, normalization, multiple dimensionality reduction techniques, automated clustering, and predictive modeling tools. As a proof of concept, we used FlowCT to compare the T-cell compartment in bone marrow (BM) with peripheral blood (PB) from patients with smoldering multiple myeloma (SMM), identify minimally invasive immune biomarkers of progression from smoldering to active MM, define prognostic T-cell subsets in the BM of patients with active MM after treatment intensification, and assess the longitudinal effect of maintenance therapy in BM T cells. A total of 354 samples were analyzed and immune signatures predictive of malignant transformation were identified in 150 patients with SMM (hazard ratio [HR], 1.7; P < .001). We also determined progression-free survival (HR, 4.09; P < .0001) and overall survival (HR, 3.12; P = .047) in 100 patients with active MM. New data also emerged about stem cell memory T cells, the concordance between immune profiles in BM and PB, and the immunomodulatory effect of maintenance therapy. FlowCT is a new open-source computational approach that can be readily implemented by research laboratories to perform quality control, analyze high-dimensional data, unveil cellular diversity, and objectively identify biomarkers in large immune monitoring studies. These trials were registered at www.clinicaltrials.gov as #NCT01916252 and #NCT02406144.


Figures

None
Graphical abstract
Figure 1.
Figure 1.
T-cell distribution in paired BM and PB samples. (A) UMAP of eosinophils, erythroblasts, granulocytes, lymphocytes, and monocytes. (B) UMAP of 25 lymphocyte subsets identified in BM and PB samples from patients with SMM (n = 10). (C) Correlation map comparing the frequency of each lymphocyte subset in BM to the subsets in PB. Size and color of circles are proportional to the correlation coefficients, and the number of asterisks represents significance. *< .05; **< .01; ***< .001. (D) Dumbbell plot reporting lymphocyte subset distribution between BM and PB (statistically significant differences are identified by red lines).
Figure 2.
Figure 2.
CD4 T-cell subsets with singular transcriptional states. (A) UMAP of peripheral blood lymphocytes from 3 healthy adults analyzed by flow cytometry immunophenotyping. (B) Principal component (PC) analysis of RNA-seq data from 10 subsets identified within the CD4 T-cell compartment and isolated by multidimensional fluorescence-activated cell sorting. A putative trajectory is indicated in (A) and from Naïve to central memory (CM) CD4 T cells (B), which subsequently diverge according to T-helper polarization. (C) Heatmap based on gene expression of 10 CD4 T-cell subsets: naive, SCM CCR4+, TSCM CXCR3+, central memory (CM) CXCR3+ and CXCR4+, CM without expression of any marker, T-helper type 1 (Th1), T-helper type 1/17 (Th 1/17), T-helper type 2 (Th2), T-helper type 17 (Th17), and CCR6+ CM. Transcriptional programs were defined by k-means clustering. Gene expression is represented by a row z-score. (D) The z-score of gene expression in CD4 T-cell subsets according to their transcriptional program.
Figure 3.
Figure 3.
T-cell subsets associated with the malignant transformation of SMM. (A) UMAP of the entire T-cell compartment and CD4 and CD8 subsets in PB of 150 patients with SMM. (B) Risk stratification according to the presence of −4 or fewer vs −4 or more points (prognostic scores of 1 and 2, respectively) based on 1, 2, or 3 points being attributed according to low, intermediate, or high frequency of double-positive (DP), TCD4+CD28+CD127+, TCD4+CD28+TIGIT+CD127low, Treg TIGIT+CD39dim, Treg TIGIT+CD39+, and TCD8+CD28TIGIT+PD1+CD127+ T cells. (C) Pie charts display the distribution of patients based on the 2/20/20 [>2 g/dL of serum M-protein, >20% serum free light-chain ratio, and >20% plasma cells found by BM biopsy] risk model of the IMWG in each subgroup of patients defined by their immune score. Significant differences were observed in the frequency of patients with low risk according to the IMWG when comparing patients with low- and high-risk immune scores.
Figure 4.
Figure 4.
T-cell biomarkers of survival in active MM. (A) UMAP of BM lymphocytes in BM aspirates from 100 patients with MM that were collected after treatment intensification (GEM2012MENOS65) and before maintenance (GEM2014MAIN). (B-C) Gradient boosting was performed in all 33 subsets to identify prognostic T-cell biomarkers; 6 T-cell types (TCD4+Naive, TCD4+EM CD127lowPD1+, TCD4+CM CD127lowPD1, TCD8+EM CD127lowPD1+, TCD8+TEMRA CD127low PD1+, and Tγδ CD8 TEMRA) were associated with survival and were modeled to generate a prognostic score. Based on the negative or positive weight of the 6 subsets, a model was developed in which low frequency was assigned 1 point and high frequency was assigned 2 points. Patients were stratified according to the presence of ≤5 points (prognostic score 1) or >5 points (prognostic score 2). PFS (B) and OS are shown (C). (D) Number of MRD-positive and MRD-negative patients in each immune risk group.
Figure 5.
Figure 5.
Immune modulation of BM T cells during lenalidomide maintenance. (A) UMAP of BM lymphocytes from patients with active MM (n = 40). (B) Phylogenetic tree and hierarchical clustering of unique subpopulations within CD4, CD8, and γδ T cells. (C) Pie chart diagrams showing the distribution of T-cell subsets significantly altered from the pre-maintenance time point to the second year of maintenance within CD4+, CD8+, and γδ T cells. (D) Spider plots displaying the kinetics of T-cell subsets that were significantly different between patients treated with Rd and these 2 drugs plus ixazomib (IRd). M1, 1st year of maintenance; M2, 2nd year of maintenance; PC, post-consolidation; TEMRA, T-cell effector memory CD45RA+.

References

    1. Velasquez MP, Bonifant CL, Gottschalk S. Redirecting T cells to hematological malignancies with bispecific antibodies. Blood. 2018;131(1):30-38. - PMC - PubMed
    1. Wang Y, Nowakowski GS, Wang ML, Ansell SM. Advances in CD30- and PD-1-targeted therapies for classical Hodgkin lymphoma. J Hematol Oncol. 2018;11(1):57. - PMC - PubMed
    1. Botta C, Misso G, Martino EC, et al. . The route to solve the interplay between inflammation, angiogenesis and anti-cancer immune response. Cell Death Dis. 2016;7(7):e2299. - PMC - PubMed
    1. Sharma P, Allison JP. Dissecting the mechanisms of immune checkpoint therapy. Nat Rev Immunol. 2020;20(2):75-76. - PubMed
    1. Galluzzi L, Vacchelli E, Bravo-San Pedro JM, et al. . Classification of current anticancer immunotherapies. Oncotarget. 2014;5(24):12472-12508. - PMC - PubMed

Publication types

Associated data