. 2021 Nov;54(9):7301-7317.
doi: 10.1111/ejn.15482. Epub 2021 Oct 22.

Visual speech differentially modulates beta, theta, and high gamma bands in auditory cortex

Affiliations

Visual speech differentially modulates beta, theta, and high gamma bands in auditory cortex

G Karthik et al. Eur J Neurosci. 2021 Nov.

Abstract

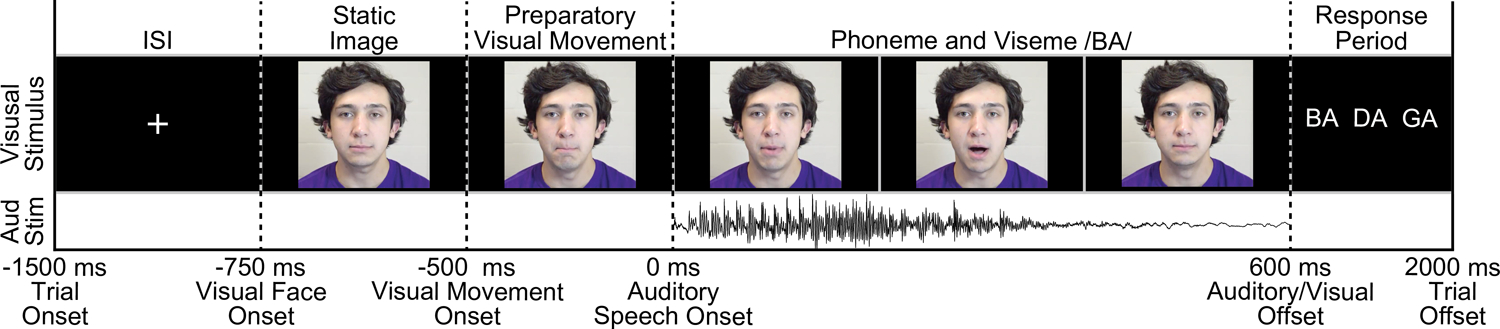
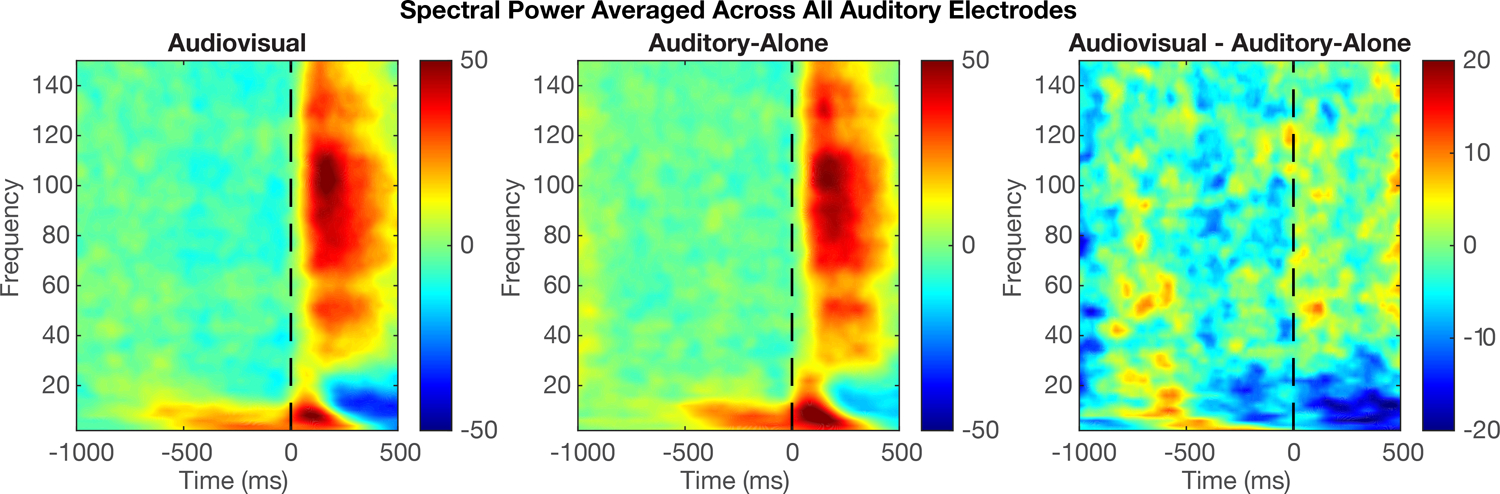
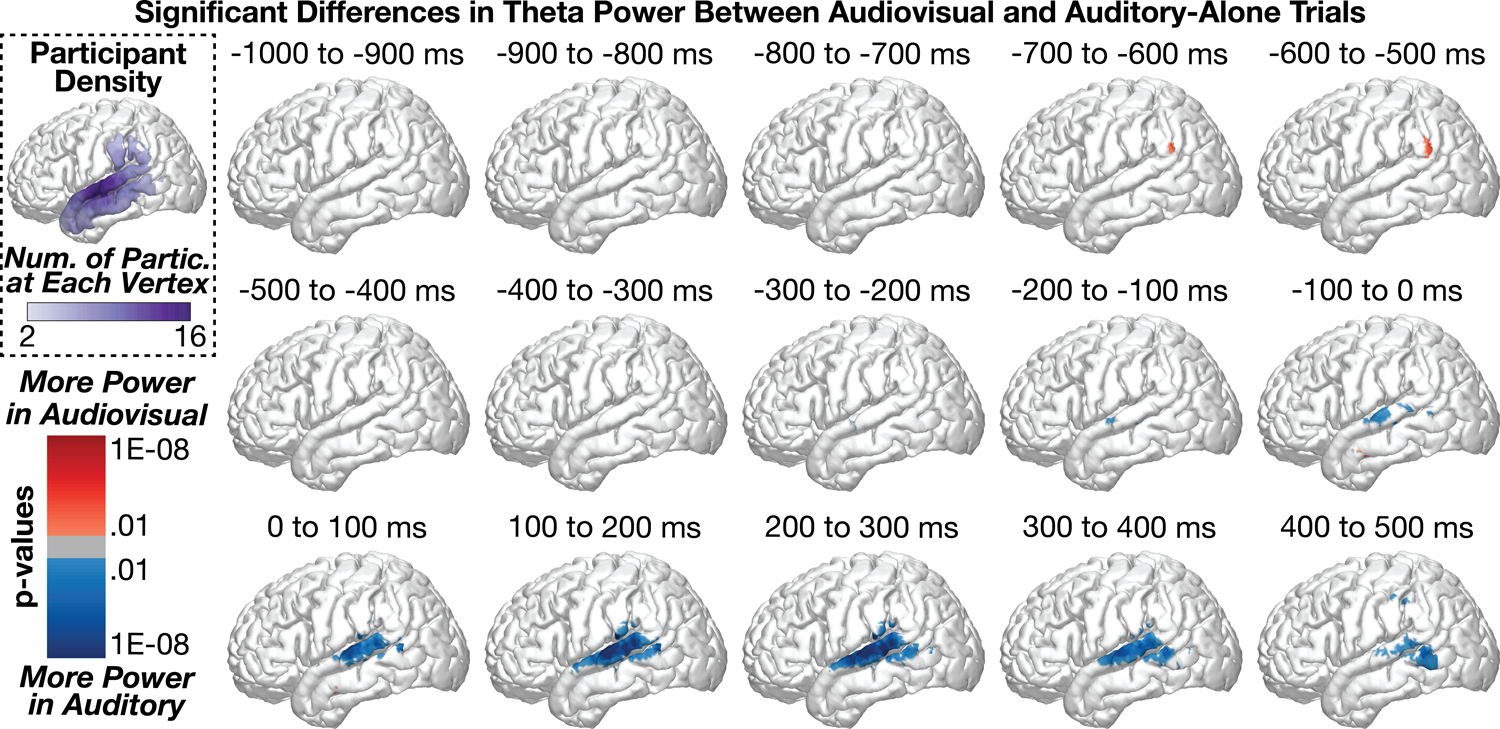
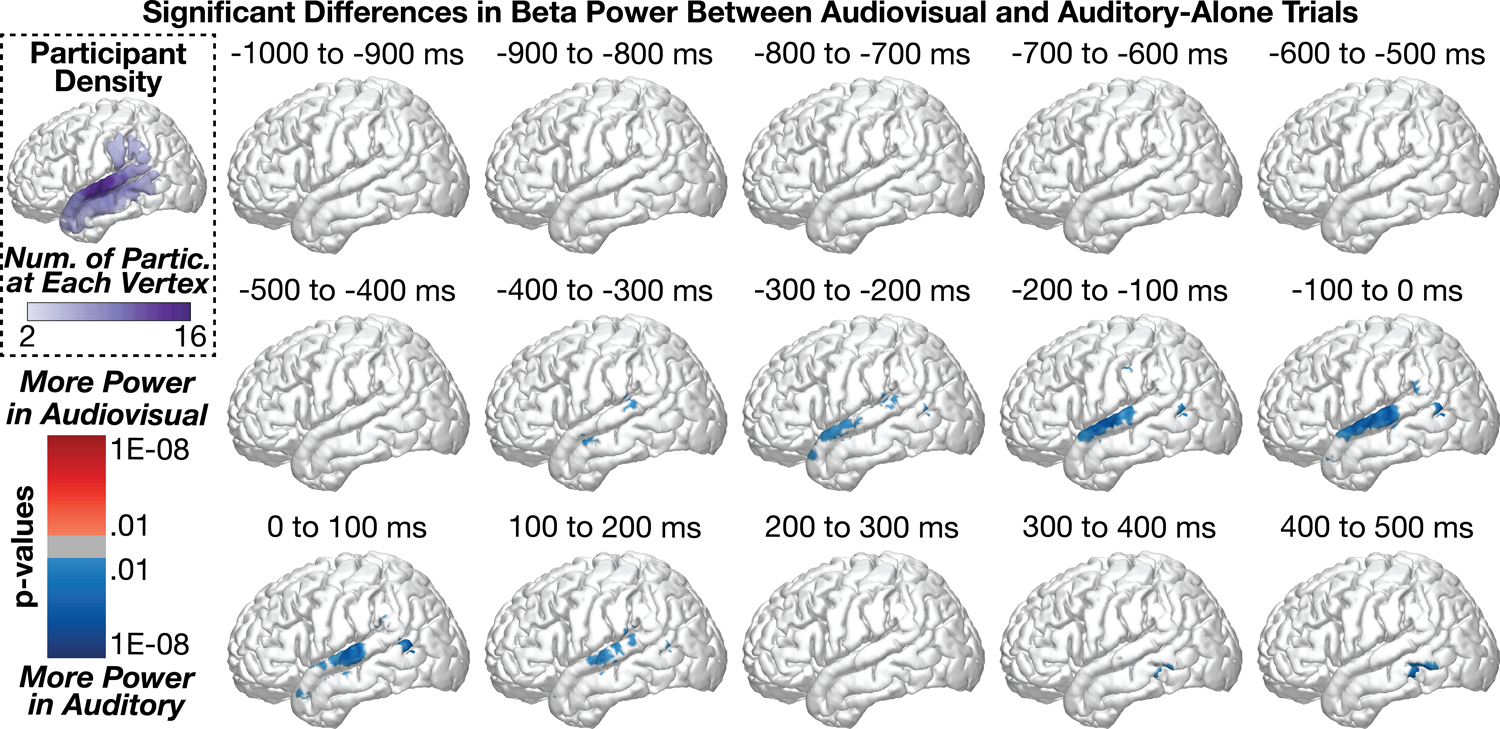
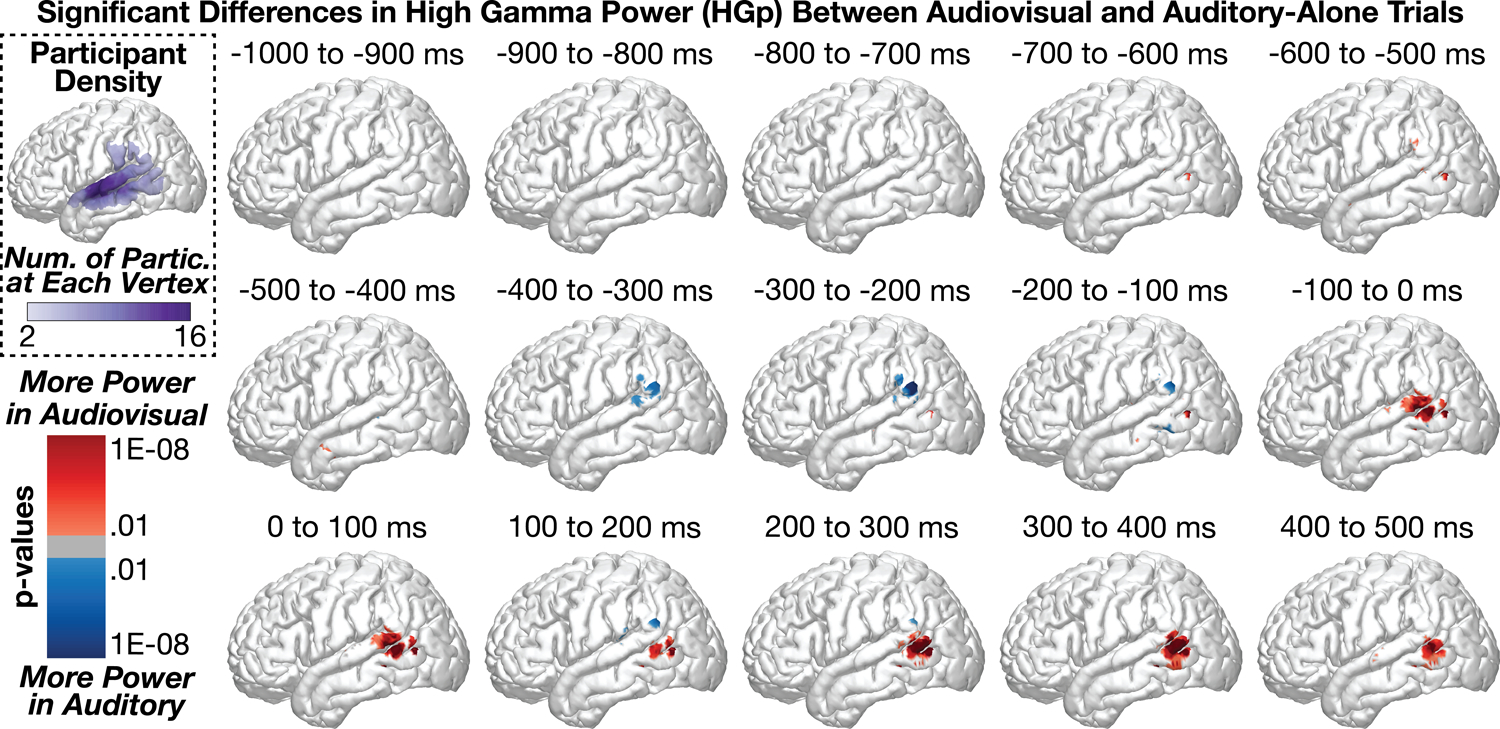
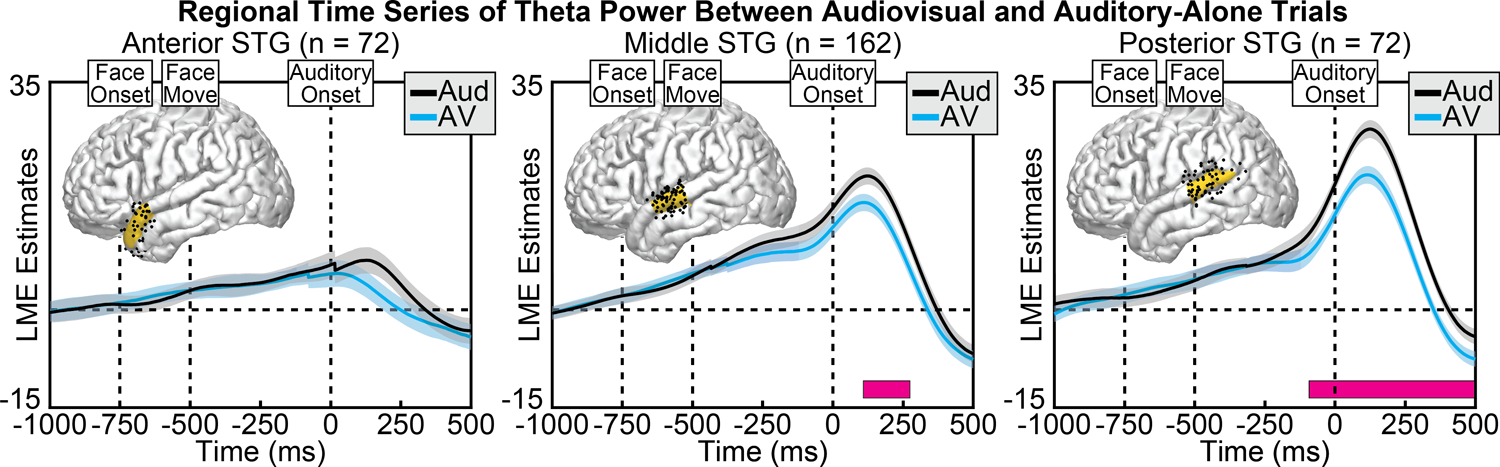
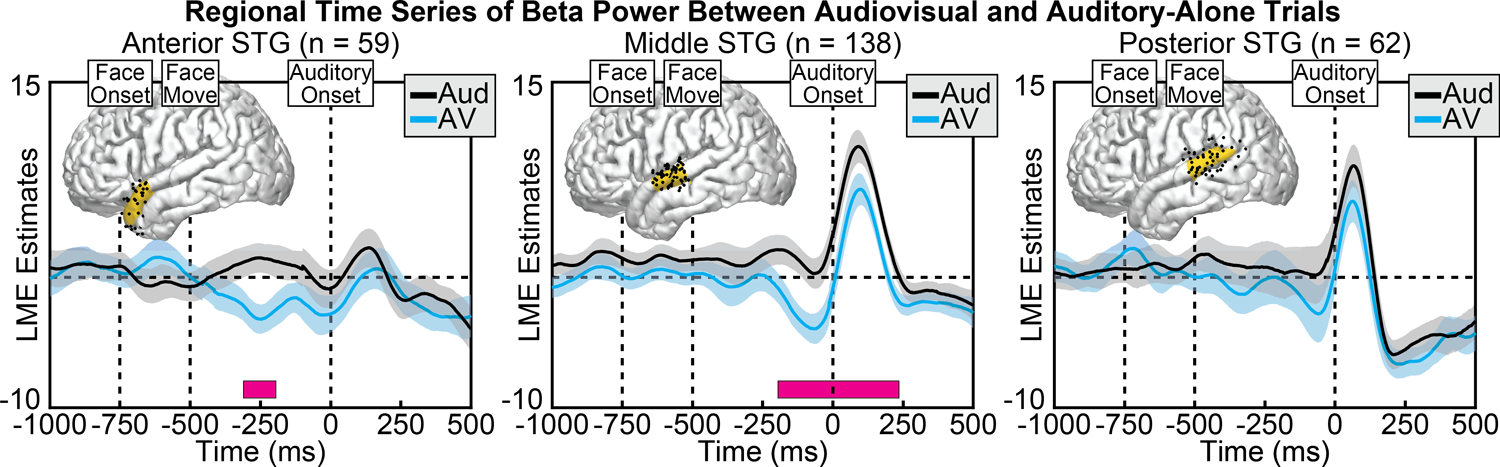
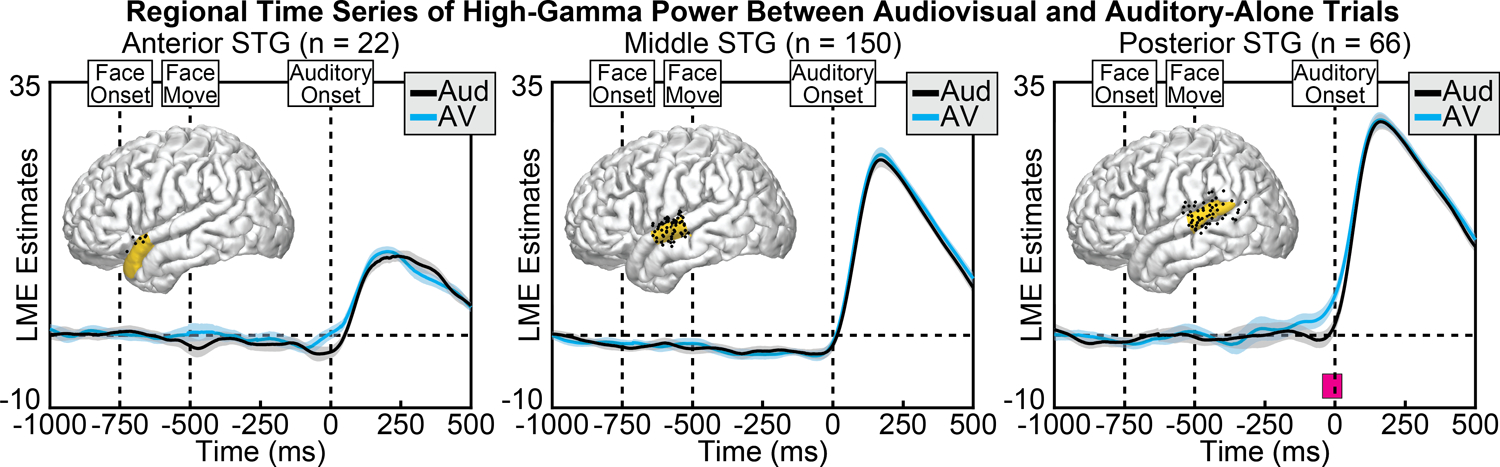
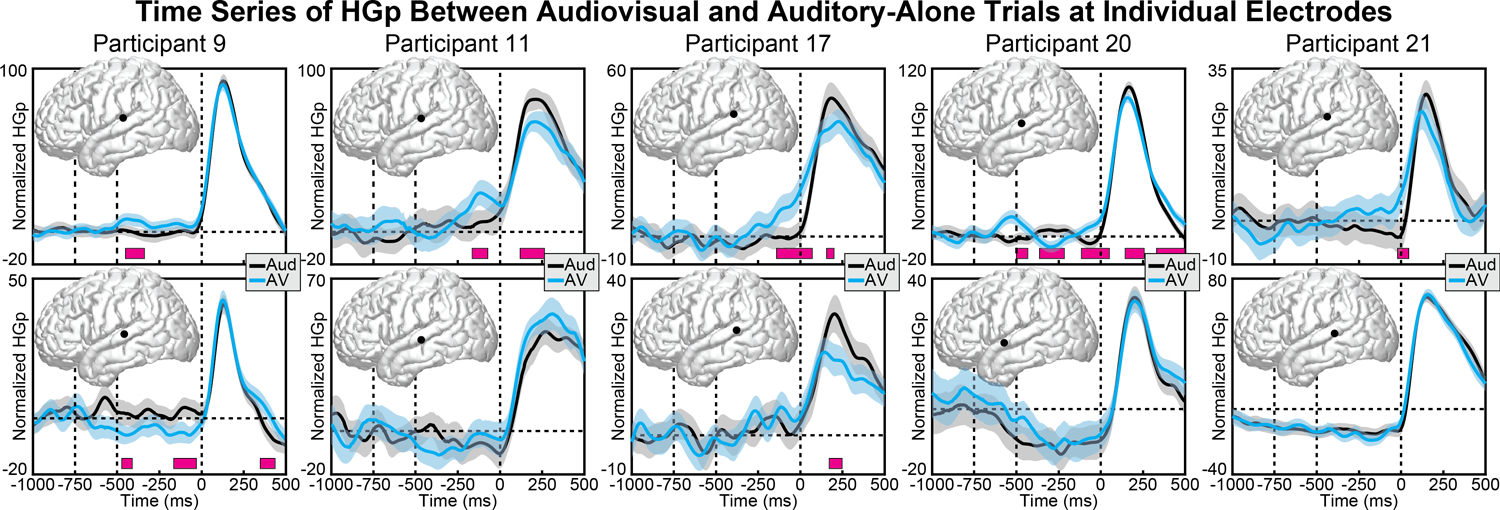
Speech perception is a central component of social communication. Although principally an auditory process, accurate speech perception in everyday settings is supported by meaningful information extracted from visual cues. Visual speech modulates activity in cortical areas subserving auditory speech perception including the superior temporal gyrus (STG). However, it is unknown whether visual modulation of auditory processing is a unitary phenomenon or, rather, consists of multiple functionally distinct processes. To explore this question, we examined neural responses to audiovisual speech measured from intracranially implanted electrodes in 21 patients with epilepsy. We found that visual speech modulated auditory processes in the STG in multiple ways, eliciting temporally and spatially distinct patterns of activity that differed across frequency bands. In the theta band, visual speech suppressed the auditory response from before auditory speech onset to after auditory speech onset (-93 to 500 ms) most strongly in the posterior STG. In the beta band, suppression was seen in the anterior STG from -311 to -195 ms before auditory speech onset and in the middle STG from -195 to 235 ms after speech onset. In high gamma, visual speech enhanced the auditory response from -45 to 24 ms only in the posterior STG. We interpret the visual-induced changes prior to speech onset as reflecting crossmodal prediction of speech signals. In contrast, modulations after sound onset may reflect a decrease in sustained feedforward auditory activity. These results are consistent with models that posit multiple distinct mechanisms supporting audiovisual speech perception.

Keywords: ECoG; audiovisual; iEEG; intracranial; multisensory; sEEG; speech.


Conflict of interest statement

Conflict of Interest Statement

The authors declare no competing financial interests.

Figures

Figure 1:
Figure 1:
Task Variant B trial schematic. All trials began with a fixation cross 1500 ms before the onset of an auditory stimulus, lasting for an average of 750 ms (plus or minus 250 ms jitter). In the auditory-alone condition a blank screen followed the fixation cross for 750 ms. In the audiovisual condition the face appeared at the offset of the fixation (750 ms before sound onset), with preparatory visual movement beginning 250 ms later. Auditory phonemes (/ba/, /da/, or /ga/) onset at 0 ms in both conditions.
Figure 2:
Figure 2:
Group-level plots showing event-related spectral power from 2–150 Hz. Data reflect iEEG activity from all anatomically localized auditory electrodes (n = 745), first averaged across electrodes within each participant, then averaged across participants. Dotted lines denote auditory onset. Color scale reflects normalized power.
Figure 3:
Figure 3:
Group-level analyses comparing theta power between audiovisual and auditory-alone conditions at 100 ms time windows (sound onset at 0 ms). Statistics conducted vertex-wise at the individual participant level and aggregated across participants using Stouffer’s Z-Score method. Multiple comparisons applied across time and space using FDR. Top-left plot shows the number of participants who were included at each vertex. Audiovisual stimuli elicited reduced theta power at the middle to posterior STG, peaking after the onset of the speech sound.
Figure 4:
Figure 4:
Group-level analyses comparing beta power between audiovisual and auditory-alone conditions at 100 ms time windows (sound onset a 0 ms). Top-left plot shows the number of participants who contributed data to each vertex. audiovisual stimuli elicited greater beta suppression at the posterior STG, peaking before sound onset.
Figure 5:
Figure 5:
Group-level analyses comparing high gamma power (HGp) between audiovisual and auditory-alone conditions at 100 ms time windows (sound onset a 0 ms). Top-left plot shows the number of participants who contributed data to each vertex. Audiovisual stimuli elicited greater power at the posterior STG, peaking beginning before sound onset.
Figure 6.
Figure 6.
Group linear mixed-effect model (LME) estimates for each time point of theta power in auditory-alone (black) and audiovisual (blue) trials, calculated separately at anterior (left), middle (middle), and posterior (right) regions of the STG. Shaded areas reflect 95% confidence intervals. Pink boxes reflect significant differences after correcting for multiple comparisons. Corresponding regions are highlighted on the cortical surfaces in yellow with the electrodes that contributed to the analysis shown as black dots (some depth electrodes are located beneath the surface and are not visible). Significant differences in theta power emerged largely after speech sound onset, concentrated along the posterior STG. The number of electrodes included in the ROI are shown in the subplot title.
Figure 7.
Figure 7.
Group LME model estimates for each time point of beta power in auditory-alone (black) and audiovisual (blue) trials, calculated separately at anterior (left), middle (middle), and posterior (right) regions of the STG. Pink boxes reflect significant differences after correcting for multiple comparisons. Corresponding regions are highlighted on the cortical surfaces in yellow with the electrodes that contributed to the analysis shown as black dots. Significant differences in beta power peaked before sound onset, concentrated in the middle to posterior STG.
Figure 8.
Figure 8.
Group LME model estimates for each time point of HGp in auditory-alone (black) and audiovisual (blue) trials, calculated separately at anterior (left), middle (middle), and posterior (right) regions of the STG. Pink boxes reflect significant differences after correcting for multiple comparisons. Corresponding regions are highlighted on the cortical surfaces in yellow with the electrodes that contributed to the analysis shown as black dots. Significant differences in HGp peaked before sound onset in the posterior STG.
Figure 9.
Figure 9.
Individual participant HGp activity at audiovisual (blue) and auditory-alone (black) conditions. Each column displays data from a different participant (two electrodes per participant). Top row displays electrodes that showed the same pattern of HGp results observed at the group-level, with increased activity in the audiovisual condition starting before sound onset. Bottom row shows a proximal electrode that demonstrated a different (sometimes conflicting) pattern. Shaded areas reflect 95% confidence intervals (random factor = trials). Pink boxes reflect significant differences after correcting for multiple comparisons.

References

    1. Aarts E, Verhage M, Veenvliet JV, Dolan CV, and Van Der Sluis S (2014). A solution to dependency: using multilevel analysis to accommodate nested data. Nature neuroscience, 17(4), 491–496. - PubMed
    1. Arnal LH, Morillon B, Kell CA, and Giraud AL (2009). Dual neural routing of visual facilitation in speech processing. Journal of Neuroscience, 29(43), 13445–13453. - PMC - PubMed
    1. Arnal LH, Wyart V, and Giraud AL (2011). Transitions in neural oscillations reflect prediction errors generated in audiovisual speech. Nature neuroscience, 14(6), 797. - PubMed
    1. Bastos AM, Usrey WM, Adams RA, Mangun GR, Fries P, and Friston KJ (2012). Canonical microcircuits for predictive coding. Neuron, 76(4), 695–711. - PMC - PubMed
    1. Barr DJ, Levy R, Scheepers C, & Tily HJ (2013). Random effects structure for confirmatory hypothesis testing: Keep it maximal. Journal of memory and language, 68(3), 255–278. - PMC - PubMed

Publication types