. 2021 Sep 29;12(1):5722.
doi: 10.1038/s41467-021-25125-1.

A harmonized atlas of mouse spinal cord cell types and their spatial organization

Affiliations

A harmonized atlas of mouse spinal cord cell types and their spatial organization

Daniel E Russ et al. Nat Commun. .

Erratum in

Abstract

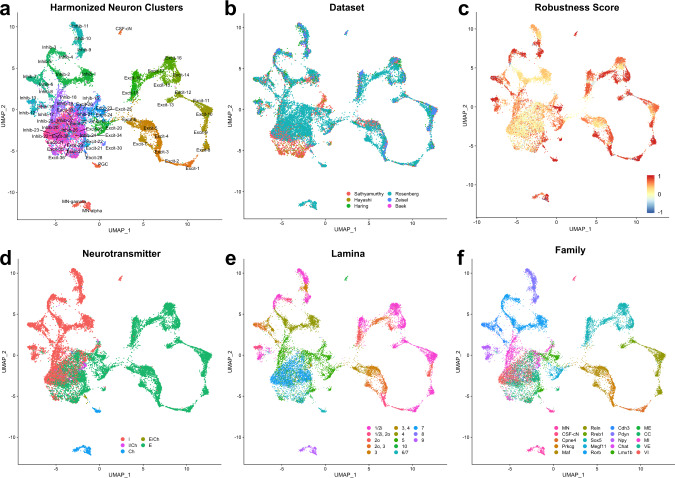
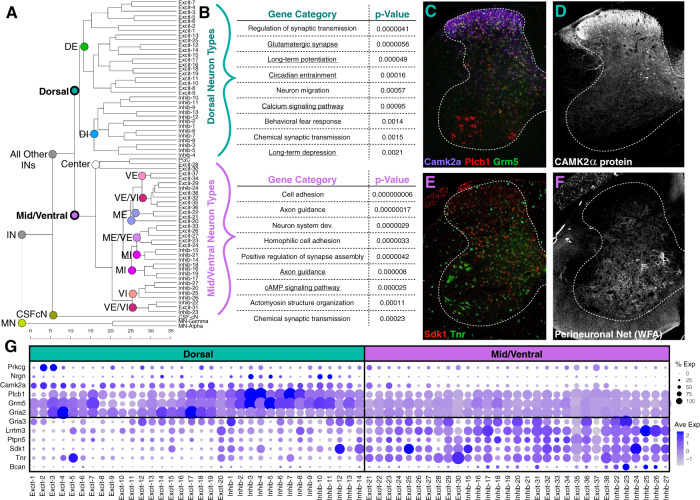
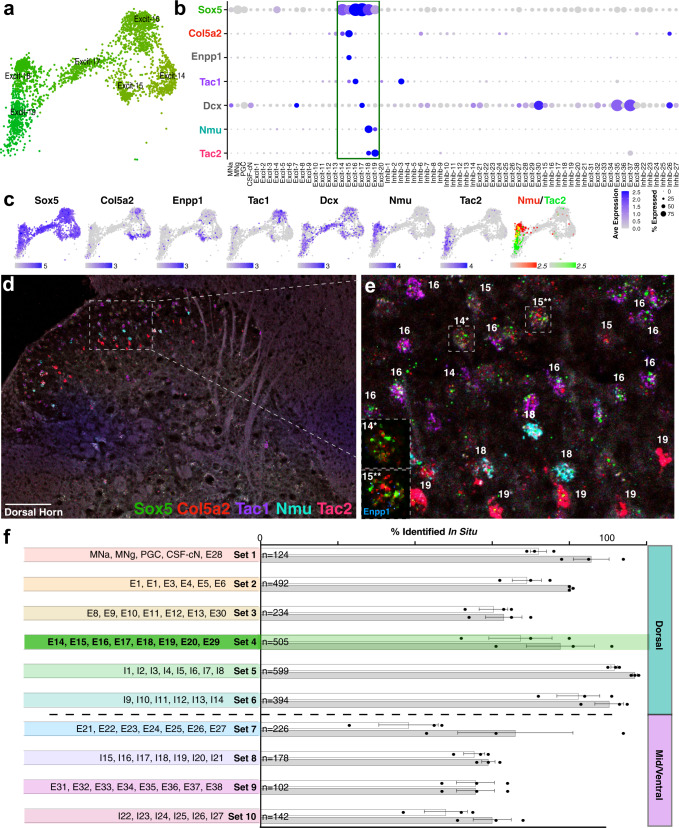
Single-cell RNA sequencing data can unveil the molecular diversity of cell types. Cell type atlases of the mouse spinal cord have been published in recent years but have not been integrated together. Here, we generate an atlas of spinal cell types based on single-cell transcriptomic data, unifying the available datasets into a common reference framework. We report a hierarchical structure of postnatal cell type relationships, with location providing the highest level of organization, then neurotransmitter status, family, and finally, dozens of refined populations. We validate a combinatorial marker code for each neuronal cell type and map their spatial distributions in the adult spinal cord. We also show complex lineage relationships among postnatal cell types. Additionally, we develop an open-source cell type classifier, SeqSeek, to facilitate the standardization of cell type identification. This work provides an integrated view of spinal cell types, their gene expression signatures, and their molecular organization.


Conflict of interest statement

The authors declare no competing interests.

Figures

Fig. 1
Fig. 1. Integration of six independent studies on single cell spinal cord data reveals the major cell types of the spinal cord.
a Summary of the datasets used in this study, including the studies that used single-cell/nucleus RNA sequencing to analyze postnatal mouse spinal cord cell types (colored names above the gray bar) and additional studies that were used for focused aspects of the analysis below the gray bar. The age and technique (cell or nuclei isolation) is represented for each study. b UMAP presentation of the 52,623 cells/nuclei in the final dataset, without integration and colored by the study of origin (colors in the legend). c UMAP presentation of the same 52,623 cells/nuclei in the final dataset, integrated by study and colored by the study of origin (same colors as in (b)). d UMAP presentation of the cells/nuclei in the merged dataset, integrated by study and colored by cell type. e Dot plot of the expression of marker genes for the major coarse cell types. Average expression for each cluster is shown by color intensity and the percent of cells/nuclei in each cluster that expressed each gene is shown by dot diameter.
Fig. 2
Fig. 2. Harmonized atlas of 69 populations of spinal cord neurons.
a UMAP presentation of 19,353 neuronal cells/nuclei of the postnatal mouse spinal cord, colored and annotated by cell type cluster. bf The same cells/nuclei, colored by the study of origin (b), by robustness (silhouette) score (c), a neurotransmitter (d), lamina (e), and family (f). I inhibitory, I/Ch inhibitory cholinergic, Ch cholinergic, E/Ch excitatory cholinergic, E excitatory, MN motoneurons, ME mid excitatory, CC Clarke’s Column (*see main text for note on this designation), MI mid inhibitory, VE ventral excitatory, VI ventral inhibitory. Laminae were assigned based on in situ hybridization validation experiments and are colored by the approximate depth from the dorsal surface of the cord (hot pink to violet). See main text for description of neuronal families.
Fig. 3
Fig. 3. Trends in dorsal-ventral organization of spinal cord neuron types.
a Dendrogram showing the relationships between the 69 neuronal cell types based on their distance from each other in the 50-dimensional principal component (PC) space. MN motoneuron, IN interneurons (and projection neurons), CSF-cN cerebrospinal fluid contacting neurons, DE dorsal excitatory, DI dorsal inhibitory ME mid excitatory, MI mid inhibitory, VE ventral excitatory, VI ventral inhibitory, center represents a group of 3 cell types located near lamina X–the center of the spinal cord. b Differential gene expression tests (ROC) were used to compare overall gene expression between the dorsal cell types and mid/ventral cell types and significant gene lists were analyzed by gene ontology (GO) term searches with GO DAVID using molecular function and biological process terms, as well as KEGG pathway lists (which are underlined) and the top terms for each cell class are shown. cf Validation of differentially expressed genes using RNA in situ hybridization (c, e), antibody staining (d), or WFA-lectin staining (f). 20x tiled images, with brightness and contrast adjusted. All images are representative of the pattern observed in at least 3 sections each from N = 3 animals. Scale bars are 200 μm. g Dot plots showing expression of plasticity-related genes in each harmonized cluster, in which dot color intensity corresponds to average expression level (Ave Exp) and dot size corresponds to the percent of each cluster that expressed the gene (% Exp).
Fig. 4
Fig. 4. Family structure and in situ validation for adult spinal cord tissue.
a UMAP for neuronal cell types Excit-14 through Excit-19. b Dot plot of the distribution of selected marker genes across the 69 neuronal clusters in which dot color intensity corresponds to average expression level (Ave Expression) and dot size corresponds to the percent of each cluster that expressed the gene (% Expressed). c Feature plots of each gene expression pattern in Excit-14 through Excit-19. Expression levels are indicated by color intensity, with the maximum level indicated below each plot. The co-expression of Nmu (red) and Tac2 (green) are shown in the right-most plot, with expression levels cut-off at a maximum of 2.5 to highlight co-expressing cells in yellow. d, e RNA in situ hybridization of selected marker genes Sox5, Col5a2, Tac1, Nmu, Tac2 on an adult mouse lumbar spinal cord section. Cells were assigned to individual excitatory clusters with cluster number identity shown based on marker gene expression. Inset show representative cells of Excit-14 (14*) and Excit-15 (15**) with in situ hybridization for Sox5 (green), Col5a2 (red), Enpp1 (blue). 20x tiled images, with brightness and contrast adjusted. All images are representative of the pattern observed in at least 3 sections each from N = 3 animals. Scale bar is 100 μm in (d) and 25 μm in (e). f Quantification of the cells in adult spinal cord tissue that could be defined using sets of marker genes in situ. The cell types analyzed by each set of genes are shown on the left, the number of cells counted for each set are shown at the base of the bars, and the percent of counted cells are shown for each animal (N = 3, replicates and mean ± standard error) that could be confidently assigned to a single cluster (white bars), or that could be assigned to a single cluster or to pair of closely related clusters (gray). For each set, the coarse criteria for counting total cells are specified in the Methods. Set 4, which includes the Sox5 family clusters, is highlighted in green as an example.
Fig. 5
Fig. 5. Co-integration of embryonic and postnatal through adult spinal cord neuronal types.
a To reveal the temporal relationship between embryonic and postnatal through adult cell types, the Delile, and harmonized datasets were co-integrated and are shown in a UMAP, colored by dataset (right). b A UMAP of the co-integrated datasets, colored by clusters from the Delile et al. study (bold labels) or the harmonized analysis (regular font labels). Cluster annotations are repeated in cases in which a group of cells from a given cluster are located at a distance from the cluster centroid (ex. for dI4.6). c Feature plots of selected marker genes for the cardinal classes of spinal cord lineages. d Sankey plot of the relationships between embryonic lineages (left) and harmonized cell types (right) showing multiple examples of divergence and convergence.
Fig. 6
Fig. 6. Computational classification of spinal cord cell types.
a Confusion matrices of the F1 scores for the classification of coarse cell types using label transfer, a support vector machine (SVM), and a fully connected neural network (neural net), (blue = 0; maroon = 1). The actual cell types are in rows and the predicted cell types are in columns in the same order. b Confusion matrices of the F1 scores for the classification of fine neuronal sub-types using label transfer and a fully connected neural network. The actual cell types are in rows and the predicted cell types are in columns, both in the order presented in Table 1. Alternating cell types are labeled. c Model of the two-tiered classification approach in which all cells/nuclei are classified into coarse cell types using label transfer (also including low-quality junk and doublets). Subsequently, all cells/nuclei that were classified as neurons, motoneurons, or doublets by label transfer are further classified into 69 neuronal cell types (also including doublets). d Experimental design for generating an independent set of single nucleus RNA sequencing data. e Distribution plot showing how nuclei from each cluster (rows) were distributed into each of the harmonized cell types (columns), normalized by rows with dark blue = 0.0 fraction; maroon = 1.0 fraction). f Bar plot of the total counts of nuclei that were from known clusters and were correctly classified (81% of total), that were from known clusters and were incorrectly classified (9% of total), that were from unknown clusters but could be identified by their classification (3% of total), or that were from unknown clusters and could not be identified (7% of total). OPC oligodendrocyte precursor cell, progen.1 oligodendrocyte progenitor 1, progen.2 oligodendrocyte progenitor 2, Olig.1 oligodendrocyte 1, Olig.2 oligodendrocyte 2, Periph. peripheral glia, Mening.1 meninges 1, Mening.2 meninges 2, Epend. Ependymal cells, Astro.1 astrocytes 1, Astro.2 astrocytes 2, Endoth endothelial cells, Pericy pericytes, MN = motoneurons; low qual. low quality, MNa motoneurons alpha, PGC preganglionic cell.

References

    1. Sathyamurthy A, et al. Massively parallel single nucleus transcriptional profiling defines spinal cord neurons and their activity during behavior. Cell Rep. 2018;22:2216–2225. doi: 10.1016/j.celrep.2018.02.003. - DOI - PMC - PubMed
    1. Hayashi, M. et al. Graded arrays of spinal and supraspinal V2a interneuron subtypes underlie forelimb and hindlimb motor control. Neuron97, 869–884.e5 (2018). - PMC - PubMed
    1. Häring M, et al. Neuronal atlas of the dorsal horn defines its architecture and links sensory input to transcriptional cell types. Nat. Neurosci. 2018;21:869–880. doi: 10.1038/s41593-018-0141-1. - DOI - PubMed
    1. Rosenberg AB, et al. Single-cell profiling of the developing mouse brain and spinal cord with split-pool barcoding. Science. 2018;360:176–182. doi: 10.1126/science.aam8999. - DOI - PMC - PubMed
    1. Zeisel A, et al. Molecular architecture of the mouse nervous system. Cell. 2018;174:999–1014.e22. doi: 10.1016/j.cell.2018.06.021. - DOI - PMC - PubMed

Publication types