Observational Study
. 2021 Sep 29;12(1):5713.
doi: 10.1038/s41467-021-25895-8.

Brief segments of neurophysiological activity enable individual differentiation

Affiliations
Observational Study

Brief segments of neurophysiological activity enable individual differentiation

Jason da Silva Castanheira et al. Nat Commun. .

Abstract

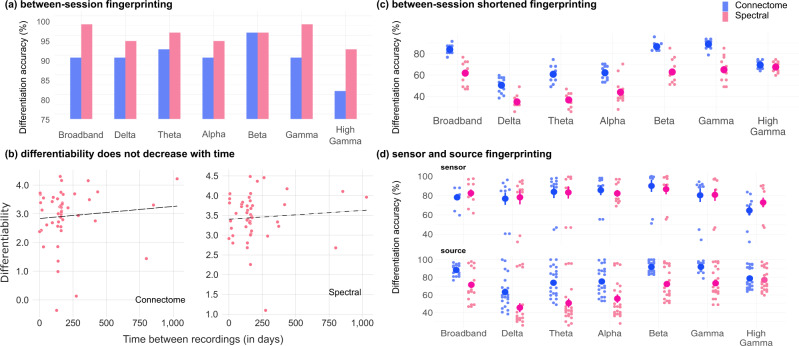
Large, openly available datasets and current analytic tools promise the emergence of population neuroscience. The considerable diversity in personality traits and behaviour between individuals is reflected in the statistical variability of neural data collected in such repositories. Recent studies with functional magnetic resonance imaging (fMRI) have concluded that patterns of resting-state functional connectivity can both successfully distinguish individual participants within a cohort and predict some individual traits, yielding the notion of an individual's neural fingerprint. Here, we aim to clarify the neurophysiological foundations of individual differentiation from features of the rich and complex dynamics of resting-state brain activity using magnetoencephalography (MEG) in 158 participants. We show that akin to fMRI approaches, neurophysiological functional connectomes enable the differentiation of individuals, with rates similar to those seen with fMRI. We also show that individual differentiation is equally successful from simpler measures of the spatial distribution of neurophysiological spectral signal power. Our data further indicate that differentiation can be achieved from brain recordings as short as 30 seconds, and that it is robust over time: the neural fingerprint is present in recordings performed weeks after their baseline reference data was collected. This work, thus, extends the notion of a neural or brain fingerprint to fast and large-scale resting-state electrophysiological dynamics.


Conflict of interest statement

The authors declare no competing interests.

Figures

Fig. 1
Fig. 1. Neural fingerprinting analysis pipeline and definition of differentiability.
a Schematic of exemplar MEG data divided into datasets used in each of the specified differentiation challenges. (i) Within-session challenge: the session data was split in half to generate segments of equal duration; (ii) Between-sessions challenge: differentiation was performed using data recorded on two separate days; (iii) Between-session shortened challenge: data recorded on two different days were split into three 30 s segments. b Schematic of the data analysis pipeline: source modeling was first performed before extracting features from each region of the Desikan-Killiany atlas. These features were vectorized and subsequently used to fingerprint individuals, yielding a participant correlation matrix. c Features for the between-session challenge from an exemplar subject. Left panel depicts amplitude envelope correlation (AEC) functional connectivity matrices across two datasets; both matrices feature the Pearson correlation coefficients between all 68 regions of the Desikan-Killiany atlas. Right panel plots the power spectrum density estimates from two regions of the atlas, across two datasets. d Differentiability was derived for each participant as the z-score of their correlation to themselves, relative to the correlation between themselves and the rest of the cohort. A participant with a high correlation to themselves and low correlations to others was qualified as highly differentiable. An individual highly correlated to both themselves and many others in the cohort was qualified as less differentiable.
Fig. 2
Fig. 2. Within-session differentiation is not related to recording artifacts.
a Differentiation accuracy of connectome and spectral fingerprinting based on broadband and narrowband brain signals. Horizontal gray bars indicate reference differentiation levels obtained from empty-room data recorded on the same days as participants (see “Methods”). b Differentiability scores were not related to typical confounds such as head motion, eye movements, and heartbeats. Top row: using connectome fingerprinting; bottom row: spectral fingerprinting. Source data are provided as a Source Data file.
Fig. 3
Fig. 3. Between-session fingerprinting accuracy.
a Differentiation accuracy for connectome and spectral between-session fingerprinting. Fingerprinting performances are similar to those from the within-session challenge. b Pearson correlation analyses did not reveal an association between differentiability and the delay between session recordings (connectome fingerprinting: r = 0.09, p = 0.5; spectral fingerprinting: r = 0.08, p = 0.60). c Between-session-shortened differentiation accuracy using shorter 30 s data segments collected days apart (average: 201.7 days). Each data point represents one combination of datasets used for fingerprinting (see “Methods” for details). d Scatter plots of all fingerprinting challenges across frequency bands for source (brain) and sensor (scalp) level fingerprinting (Supplemental Information details the results obtained for all sensor data fingerprinting challenges). Source data are provided as a Source Data file.
Fig. 4
Fig. 4. Characteristic features of connectome and spectral fingerprinting.
Intraclass correlation (ICC) for connectome and spectral within-session fingerprinting. a ICC for connectome fingerprinting plotted for each tested frequency band, using network labels from Yeo et al.. The most prominent networks for connectome fingerprinting were the Visual, Dorsal Attention, and Limbic networks. b ICC for spectral fingerprinting plotted for each tested frequency band and mapped using the Desikan-Killiany cortical parcellation. The most salient features were the theta, alpha, and gamma band signals expressed in midline structures and the beta band across the cortex.
Fig. 5
Fig. 5. Partial Least-Squares analysis relates demographics to connectome and spectral features.
(a) and (b) from left to right, depicts the design saliency patterns for the first latent variables and their associated neural-data bootstrap ratios. Confidence Intervals (95% CI) were calculated through a bootstrapping procedure (n = 10,000), and as such may not necessarily be symmetric. Bootstrap ratios computed for (a) connectome and (b) spectral features are plotted according to the resting-state networks labeled according to Yeo et al. and the Desikan-Killiany parcellation, respectively: Default Mode Network (DMN), dorsal attention (DA), frontal-parietal (FP), limbic (L), somato-motor (SM), ventral attention (VA), and visual (VIS). Source data are provided as a Source Data file.

References

    1. Dubois J, Adolphs R. Building a science of individual differences from fMRI. Trends Cogn. Sci. 2016;20:425–443. doi: 10.1016/j.tics.2016.03.014. - DOI - PMC - PubMed
    1. Miller MB, Van JD. Horn, Individual variability in brain activations associated with episodic retrieval: a role for large-scale databases. Int. J. Psychophysiol. 2007;63:205–213. doi: 10.1016/j.ijpsycho.2006.03.019. - DOI - PubMed
    1. Van Horn JD, Grafton ST, Miller MB. Individual variability in brain activity: a nuisance or an opportunity? Brain Imaging Behav. 2008;2:327. doi: 10.1007/s11682-008-9049-9. - DOI - PMC - PubMed
    1. Yarkoni, T. in APA handbook of personality and social psychology, Volume 4: Personality Processes and Individual Differences (eds. Mikulincer, M, Shaver, P. R., Cooper, M. L. & Larsen, R. J.) pp. 61–83 (American Psychological Association, Washington, 2015).
    1. Marcus DS, et al. Essen, Informatics and data mining tools and strategies for the human connectome project. Front. Neuroinformatics. 2011;5:4. doi: 10.3389/fninf.2011.00004. - DOI - PMC - PubMed

Publication types