. 2021 Sep 29;12(1):5705.
doi: 10.1038/s41467-021-25985-7.

Genomic sequencing of SARS-CoV-2 in Rwanda reveals the importance of incoming travelers on lineage diversity

Affiliations

Genomic sequencing of SARS-CoV-2 in Rwanda reveals the importance of incoming travelers on lineage diversity

Yvan Butera et al. Nat Commun. .

Abstract

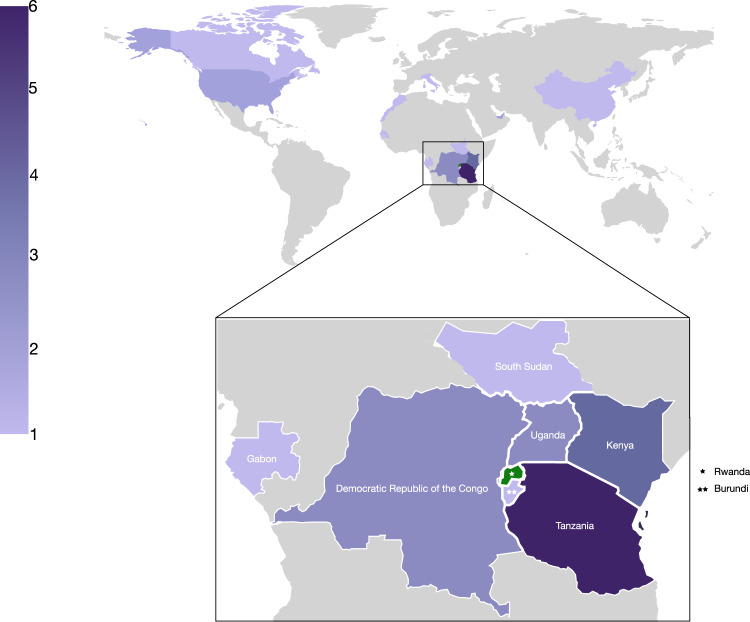
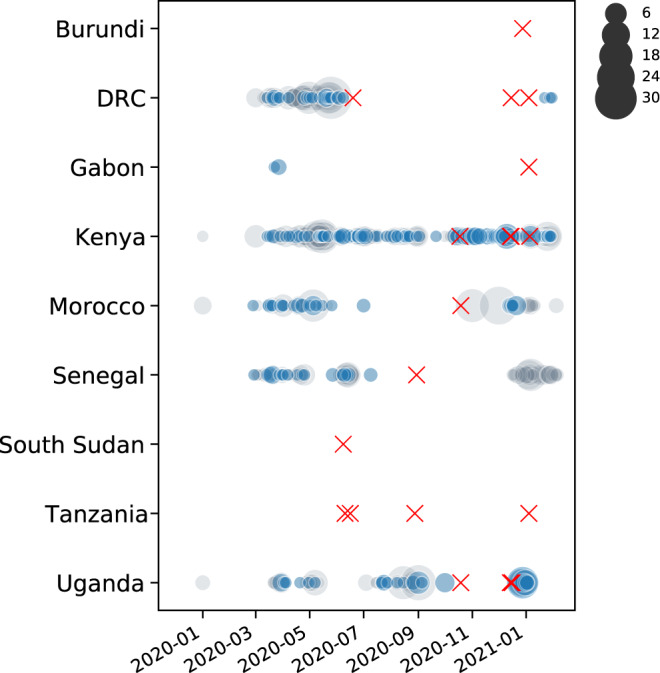
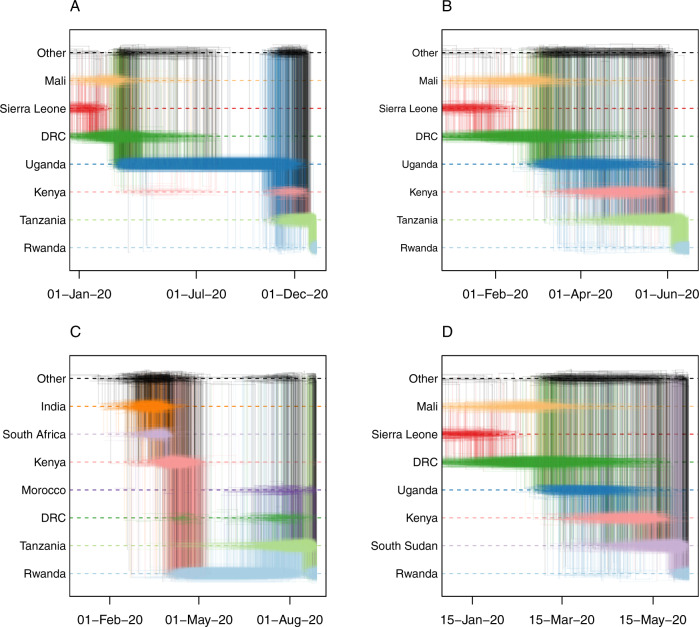
COVID-19 transmission rates are often linked to locally circulating strains of SARS-CoV-2. Here we describe 203 SARS-CoV-2 whole genome sequences analyzed from strains circulating in Rwanda from May 2020 to February 2021. In particular, we report a shift in variant distribution towards the emerging sub-lineage A.23.1 that is currently dominating. Furthermore, we report the detection of the first Rwandan cases of the B.1.1.7 and B.1.351 variants of concern among incoming travelers tested at Kigali International Airport. To assess the importance of viral introductions from neighboring countries and local transmission, we exploit available individual travel history metadata to inform spatio-temporal phylogeographic inference, enabling us to take into account infections from unsampled locations. We uncover an important role of neighboring countries in seeding introductions into Rwanda, including those from which no genomic sequences were available. Our results highlight the importance of systematic genomic surveillance and regional collaborations for a durable response towards combating COVID-19.


Conflict of interest statement

The authors declare no competing interests.

Figures

Fig. 1
Fig. 1. Comparison of the number of sequences taken and case counts over time and space.
A time series of month of sequence collection date (thicker bars), with thinner bars the daily new cases reported nationally until the 10th of February, 2021. Control measures are shown above the time series as colored dots, with darker colors representing more restrictions; B shows the number of sequences in this study by the district of residence; C log-transformed number of cumulative cases by the district until the 10th of February, 2021.
Fig. 2
Fig. 2. Map showing the number of sequences with recorded travel history per country (n = 28).
While there is travel into Rwanda recorded from across the world, most cases are from neighboring countries, notably Tanzania (6), Kenya (3), Demographic Republic of Congo (3), Uganda (3), South Sudan (1), Gabon (1), and Burundi (1).
Fig. 3
Fig. 3. Availability of whole genome sequences for African countries from which travelers entered Rwanda.
Gray circles denote the number of sequences available in GISAID for each country on a given date. Blue circles correspond to the number of sequences included in our analyses. Red crosses mark the collection dates of Rwandan sequences with travel history from the respective countries. Although few to no sequences are available from Burundi, Gabon, South Sudan, and Tanzania, these travel history data point to SARS-CoV-2 lineages circulating in these countries, to the extent that returning travelers from these countries import those lineages into Rwanda.
Fig. 4
Fig. 4. Lineage diversity sampled in Rwanda across four time points: May–Jul 2020 (n = 28), Aug–Oct 2020 (n = 86), Nov–Dec 2020 (n = 74), Jan–Feb 2021 (n = 28).
Lineage B.1.380, a Rwanda-specific lineage, dominated the sampled diversity during the first wave. Lineage A.23.1 first appeared in Rwanda in October 2020, and quickly attained a significant proportion of the sampled SARS-CoV-2 genome sequences. More recently, we detected and sequenced single cases of the B.1.1.7 and B.1.351 VOCs, associated with incoming travelers from Burundi and the Democratic Republic of the Congo, respectively. n: number of positive SARS-CoV-2 samples sequenced.
Fig. 5
Fig. 5. Maximum clade credibility phylogeny for subtree A, representing diversity of lineages A.23 and A.23.1.
The phylogeny with associated ancestral locations was inferred using travel history-aware asymmetric discrete state phylogeographic inference. A total of 33 locations were considered in the analysis but are grouped for visualization purposes. The branches in the phylogeny are colored according to the geographical location of the reconstructed ancestral regions. Rwandan sequences are indicated as large tips, colored by associated travel histories (available for 11 of the Rwandan sequences). The travel history-aware phylogeographic reconstruction on subtree A infers frequent mixing between Rwanda, Uganda, and Kenya, with the latter seeing introduction events from both Uganda and Rwanda. Both Kenya and Uganda are estimated to have seeded introductions into Tanzania, with the former also seeding an introduction into South Sudan. Importantly, the travel history-aware approach includes (returning infections from) Tanzania in lineage A.23.1, which could not be inferred via other phylogeographic approaches.
Fig. 6
Fig. 6. Maximum clade credibility tree for subtree B.1, which includes Rwandan lineage B.1.380.
The phylogeny with associated ancestral locations was inferred using travel history aware asymmetric discrete state phylogeographic inference. A total of 37 locations were considered in the analysis. The branches in the phylogeny are colored according to the geographical location of the reconstructed ancestral regions. Rwandan sequences are indicated as large tips, colo red by their associated travel histories. A total of six Rwandan sequences with associated travel history are highlighted in this subtree. The travel history-aware phylogeographic reconstruction on subtree B.1 infers a large local transmission cluster in Rwanda (subtree B.1.380). However, by incorporating individual travel histories into the phylogeographic reconstruction, we are able to infer that this subtree does not solely represent local transmission, but also introduction events into Rwanda from Tanzania, Morocco, South Sudan, and the Democratic Republic of the Congo.
Fig. 7
Fig. 7. Supported transitions into Rwanda.
Mean number of Markov jumps for supported transition rates into Rwanda (Bayes Factor > 3) for subtrees A and B.1. Support for these rates was determined using BSSVS with a travel history-aware asymmetric discrete phylogeographic model on both subtrees A and B.1. In both analyses, the majority of introductions into Rwanda were inferred to originate from nearby countries in East Africa, suggesting a substantial exchange of viral lineages between neighboring countries in the region. We refer to Supplementary Table S3 for the Bayes factor support values for these reported transitions.
Fig. 8
Fig. 8. Ancestral spatial trajectories for individual patients.
Markov jump trajectory plots for four selected Rwandan infected individuals with travel history (returning) from Tanzania (A, B, C) and South Sudan (D). Each individual trajectory corresponds to the Markov jumps in a single tree from the posterior distribution, with each plot showing the uncertainty across a subsample of 1,000 posterior trees. The horizontal dimension represents the time maintained at an ancestral location. Vertical lines represent a Markov jump between two locations. The seven most prominent locations across all ancestral paths in the posterior are displayed along the Y-axis, with “Other” representing the remaining locations. Trajectory plots A, B, and D correspond to the isolates in subtree A, i.e. EPI_ISL_1064164, EPI_ISL_707772, and EPI_ISL_707712, respectively. Trajectory plot C corresponds to isolate EPI_ISL_960250 in subtree B.1. In all cases, considerable uncertainty in the ancestral reconstructions can be seen from the pattern of overlapping horizontal lines and the diffuse density of vertical lines, which indicate considerable support for different ancestral locations (i.e. uncertainty in the spatial reconstruction), and variance in the reconstructed timing of the introductions. For trajectory plots A, B, and D, we observe similar patterns in the spatial paths reconstructed, where the isolates find ancestries in Mali/Sierra Leone/Democratic Republic of Congo, Uganda, and Kenya prior to each corresponding travel location. In contrast, trajectory plot C shows support for an ancestry in Rwanda prior to the virus circulating in Tanzania and being reintroduced into Rwanda. This indicates a bidirectional exchange of viral lineages between the two countries, although the possibility of an intermediary country being involved cannot be discarded due to unevenness in sampling efforts between countries.

References

    1. Rambaut, A. et al. A dynamic nomenclature proposal for SARS-CoV-2 lineages to assist genomic epidemiology. Nat. Microbiol. 10.1038/s41564-020-0770-5 (2020) - PMC - PubMed
    1. Volz, E. et al. Transmission of SARS-CoV-2 Lineage B.1.1.7 in England: insights from linking epidemiological and genetic data. medRxiv10.1101/2020.12.30.20249034 (2021).
    1. Horby, P. et al. NERVTAG note on B.1.1.7 severity. SAGEhttps://www.gov.uk/government/publications/nervtag-paper-on-covid-19-var... (2021).
    1. Davies, N. G. et al. Increased mortality in community-tested cases of SARS-CoV-2 lineage B.1.1.7. Nature10.1038/s41586-021-03426-1 (2021). - PMC - PubMed
    1. Cele, S. et al. Escape of SARS–CoV-2 501Y.V2 variants from neutralization by convalescent plasma. medRxiv 10.1038/s41586-021-03471-w (2021). - PMC - PubMed

Publication types

MeSH terms