Observational Study
. 2021 Sep 29;11(1):19272.
doi: 10.1038/s41598-021-98479-7.

Prevalence of elevated serum fatty acid synthase in chronic limb-threatening ischemia

Affiliations
Observational Study

Prevalence of elevated serum fatty acid synthase in chronic limb-threatening ischemia

Shirli Tay et al. Sci Rep. .

Abstract

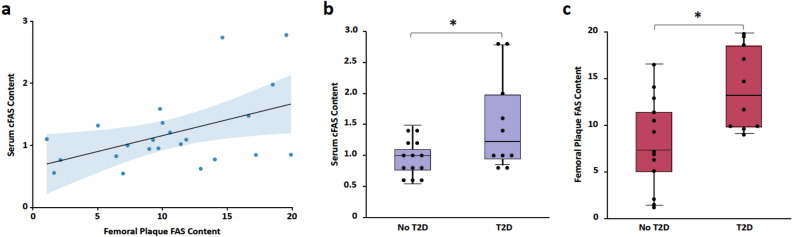
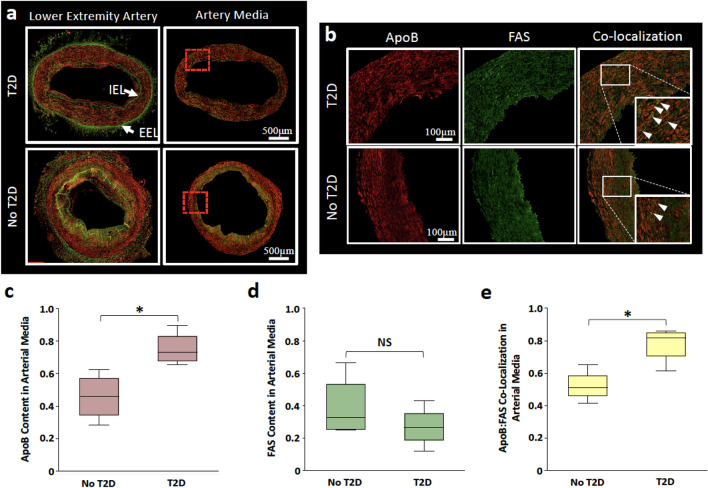
There are currently no serum-based evaluations that can corroborate the severity of peripheral artery disease (PAD). In this cross-sectional study, we assessed the prevalence of elevated serum fatty acid synthase (cFAS) in patients with chronic limb-threatening ischemia (CLTI) and evaluated the accuracy of its use in detecting this condition. Preoperative fasting serum samples from 87 patients undergoing vascular intervention were collected between October 2014 and September 2016. Median age was 62 years, with 56 (64%) men, and 32 (37%) with CLTI. We found that elevated cFAS content (OR 1.17; 95% CI 1.04-1.31), type 2 diabetes (T2D; OR 5.22; 95% CI 1.77-15.4), and smoking (OR 3.53; 95% CI 1.19-10.5) were independently associated with CLTI and could detect the presence of CLTI with 83% accuracy (95% CI 0.74-0.92). Furthermore, serum FAS content was positively correlated with FAS content in femoral artery plaque in patients with severe PAD ([Formula: see text] = 0.22; P = 0.023). Finally, significantly higher co-localization of FAS and ApoB were observed within lower extremity arterial media (P < .001). Our findings indicate that serum FAS content is a marker for disease severity in patients with PAD, independent of concomitant T2D and smoking, and may play a key role in FAS and ApoB peripheral plaque progression.


Conflict of interest statement

The authors declare no competing interests.

Figures

Figure 1
Figure 1
Flow diagram. Between October 2014 and September 2016, 431 patients were enrolled in the Washington University Vascular Surgery Biobank Repository. Patients who did not provide fasting serum (n = 62), had missing ABI (n = 207), or insufficient serum samples (n = 56) were excluded from this study. A total of 87 patients were included in this study and underwent analysis for cFAS content, while 63 patients underwent analysis for cFAS enzyme activity.
Figure 2
Figure 2
Distinguishing CLTI using serum FAS content and other variables. (a) Area under the curve containing serum cFAS content, T2D, and smoking status demonstrates 83% accuracy in distinguishing CLTI patients. (b) When adjusted for age and sex, accuracy improved marginally to 84%. Diagonal line represents random probability (no distinguishing ability).
Figure 3
Figure 3
Correlation between FAS content in serum and femoral atherosclerotic plaques of patients with severe PAD. (a) Regression analysis of FAS content in the serum and plaque of patients with severe PAD demonstrates a significant positive correlation (R2 = 0.22; P = 0.023). FAS content is expressed as ratios relative to total serum or plaque protein content. (b) Comparison of patients with and without T2D demonstrates that cFAS content was significantly higher in patients with T2D compared to no T2D (1.51 ± 0.75 vs. 0.95 ± 0.29; P = 0.047). (c) Similarly, femoral plaque FAS content was significantly higher in patients with T2D (14.0 ± 4.46 vs. 8.11 ± 4.93; P = 0.013). Boxplot indicates interquartile range (IQR), median (horizontal line within box), and 1.5 IQR of upper quartile (top whisker) and lower quartile (bottom whisker). cFAS and plaque FAS content were expressed as ratios relative to total serum or plaque protein content, respectively. *P < 0.05.
Figure 4
Figure 4
Immunofluorescent staining of FAS and ApoB in lower extremity arterial segments of CLTI patients. Representative lower extremity arterial segments from CLTI patients reflecting the group mean trend were selected. FAS (green), ApoB (red), co-localization of FAS with ApoB (yellow). (a) Arterial cross-sections demonstrate arterial intima (lumen boundary to end of IEL) and media (between IEL and EEL). (b) ×20 magnification shows co-localization signals (white arrows). (c) Mann–Whitney U-test demonstrates that patients with T2D have significantly higher ApoB staining in the arterial media (P = 0.021). (d) No difference was observed in FAS staining in arterial media of patients with or without T2D. (e) ApoB and FAS staining co-localization was higher in patients with T2D (P = 0.043). Signals are reported as proportion of total signal type. Boxplot indicates interquartile range (IQR), median (horizontal line within box), and 1.5 IQR of upper quartile (top whisker) and lower quartile (bottom whisker). NS: Not significant. *P < 0.05. IEL: Internal elastic lamina. EEL: External elastic lamina.
Figure 5
Figure 5
Comparison of FAS and ApoB content and co-localization in lower extremity arterial segments of patients with CLTI. (a) One- and two-way ANOVA showed no difference in FAS and ApoB staining intensity was observed in the arterial intima of patients with (P = 0.16) and without T2D (P = 0.99). (b) Two-way ANOVA showed significant interactions between patients with and without T2D (P < 0.001). Patients with T2D had significantly higher ApoB (P = 0.006) and ApoB:FAS co-localization (P = .016) than patients without T2D. No difference was observed in patients with no T2D (P = 0.51). (c) Two-way ANOVA showed significant interactions between patients with and without T2D (P = 0.005) that was driven by higher ApoB in patients with no T2D (P = 0.026). There was no difference in FAS (P = 0.40) or ApoB:FAS co-localization (P = 0.13) between patients with and without T2D. Signals are reported as proportion of total signal type. Boxplot indicates interquartile range (IQR), median (horizontal line within box), and 1.5 IQR of upper quartile (top whisker) and lower quartile (bottom whisker). NS: Not significant. *P < 0.05 **P < 0.01, ***P < 0.001.

References

    1. American Diabetes Association Peripheral arterial disease in people with diabetes. Diabetes Care. 2003;26:3333–3341. doi: 10.2337/diacare.26.12.3333. - DOI - PubMed
    1. Nehler MR, et al. Epidemiology of peripheral arterial disease and critical limb ischemia in an insured national population. J. Vasc. Surg. 2014;60:686–695.e2. doi: 10.1016/j.jvs.2014.03.290. - DOI - PubMed
    1. Conte MS, et al. Global vascular guidelines on the management of chronic limb-threatening ischemia. Eur. J. Vasc. Endovasc. Surg. 2019;58:S1–S109.e33. doi: 10.1016/j.ejvs.2019.05.006. - DOI - PMC - PubMed
    1. Rutherford RB, et al. Recommended standards for reports dealing with lower extremity ischemia: Revised version. J. Vasc. Surg. 1997;26:517–538. doi: 10.1016/S0741-5214(97)70045-4. - DOI - PubMed
    1. Dua A, et al. Preventable complications driving rising costs in management of patients with critical limb ischemia. Ann. Vasc. Surg. 2016;33:144–148. doi: 10.1016/j.avsg.2015.11.026. - DOI - PubMed

Publication types