. 2021 Sep 29;11(1):19350.
doi: 10.1038/s41598-021-98638-w.

Effects of hypoxia and nanocarrier size on pH-responsive nano-delivery system to solid tumors

Affiliations

Effects of hypoxia and nanocarrier size on pH-responsive nano-delivery system to solid tumors

M Soltani et al. Sci Rep. .

Abstract

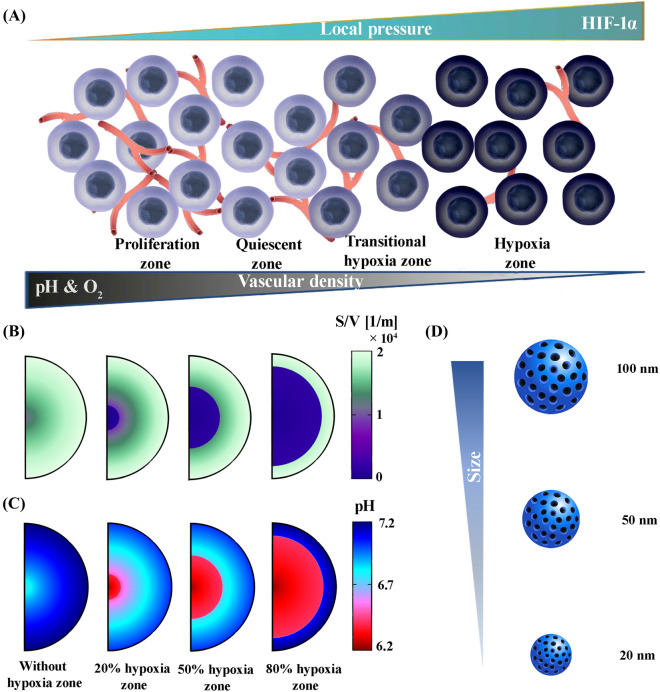
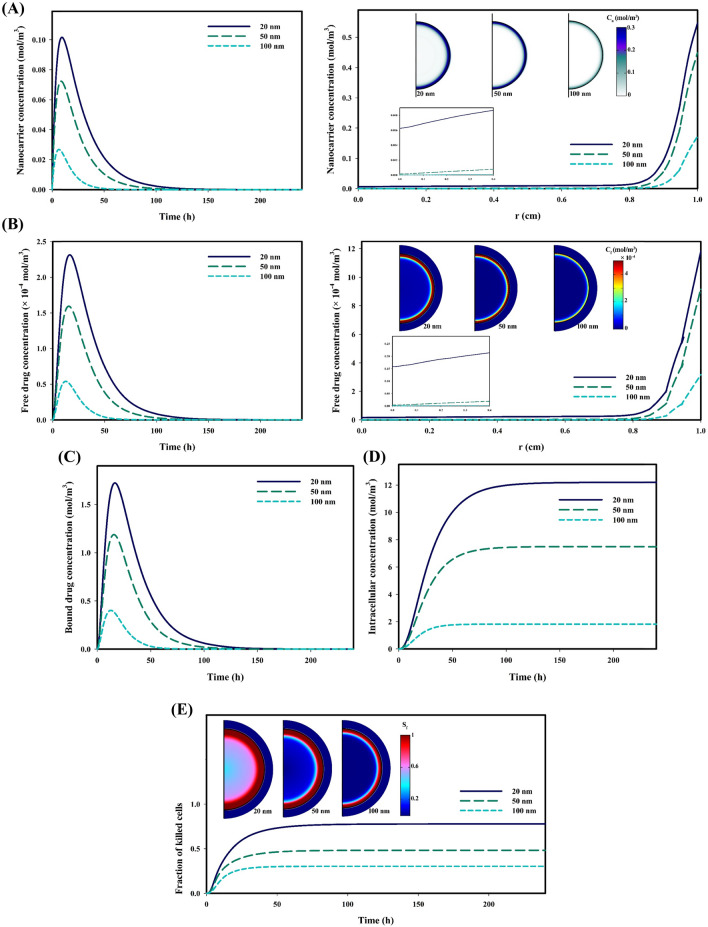
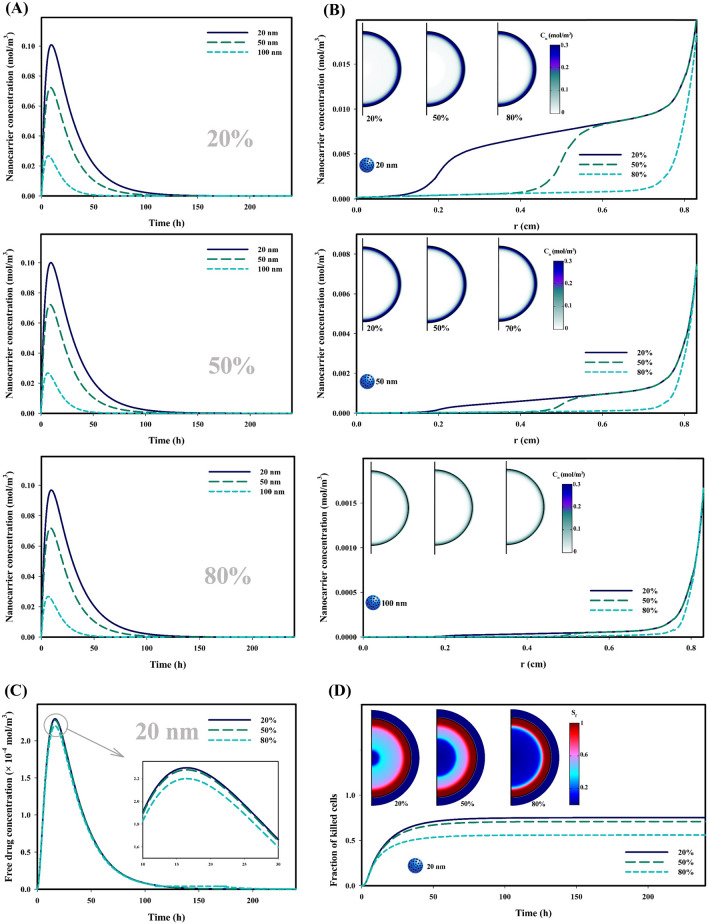
One of the special features of solid tumors is the acidity of the tumor microenvironment, which is mainly due to the presence of hypoxic regions. Therefore, pH-responsive drug delivery systems have recently been highly welcomed. In the present study, a comprehensive mathematical model is presented based on extravascular drug release paradigm. Accordingly, drug delivery system using pH-responsive nanocarriers is taken into account to examine the impacts of hypoxic regions as well as the size of nanocarriers for cancerous cell-death. The extent of hypoxic regions is controlled by vascular density. This means that regions with very low vascular density represent regions of hypoxia. Using this mathematical model, it is possible to simulate the extracellular and intracellular concentrations of drug by considering the association/disassociation of the free drug to the cell-surface receptors and cellular uptake. Results show that nanocarriers with smaller sizes are more effective due to higher accumulation in the tumor tissue interstitium. The small size of the nanocarriers also allows them to penetrate deeper, so they can expose a larger portion of the tumor to the drug. Additionally, the presence of hypoxic regions in tumor reduces the fraction of killed cancer cells due to reduced penetration depth. The proposed model can be considered for optimizing and developing pH-sensitive delivery systems to reduce both cost and time of the process.


Conflict of interest statement

The authors declare no competing interests.

Figures

Figure 1
Figure 1
An overview of the issues examined in this study; (A)The proliferative region, which contains the highest vascular density, has a higher oxygen level and consequently, a lower acidity level, unlike the hypoxic region, which has the lowest vascular density. Quiescent and proliferation regions do not suffer from lack of oxygen. Also, the only difference between these two regions is related to their vascular density so that the proliferation regions has a higher vascular density, (B) Based on the hypoxic region, which has the lowest vascular density, 4 different cases are considered for solid tumors (Without hypoxia region, 20% hypoxia zone, 50% hypoxia zone, and 80% hypoxia zone), (C) Hypoxic region has the lowest pH (6.2) and the tumor periphery has the highest pH (7.2). Acidity levels in other regions of the tumor depending on vascular density, (D) pH-responsive nanocarriers in various sizes of 20, 50, and 100 nm are taken into account to analyze the effect of nanocarrier size.
Figure 2
Figure 2
Interstitial fluid fields; (A) IFP is quickly dropped at the tumor boundary, while has uniform distribution in other areas. IFP prediction in the present model has been compared with Soltani and Chen and Al-Zu’bi and Mohan models, showing high compatibility of the results; (B) IFV is rapidly increasing at the tumor boundary, while it is minimal in other areas. IFV prediction in the present model has been compared with the models of Kashkooli et al. and Al-Zu’bi and Mohan. The discrepancy between the current model and other models can be related to the vascular density and vascular distribution.
Figure 3
Figure 3
Distribution of therapeutic agents and therapeutic response in a vascularized tumor for three different sizes of pH-responsive nanocarriers; (A) Spatiotemporal distribution distribution of responsive nanocarriers in tumor interstitium; Smaller nanocarriers have more accumulation in tumor tissue and also have a higher penetration depth, (B) Spatiotemporal distribution distribution of free drug in tumor interstitium; The concentration of released free drugs from smaller nanocarriers is greater due to the high accumulation of smaller nanocarriers compared to their larger counterparts, (C) Temporal distribution of bound drug in tumor interstitium; High accumulation of drugs released from 20 nm nanocarriers increases the chance of free drug molecules binding to cell surface receptors, (D) Temporal distribution of internalized drug in cellular; Binding of high concentrations of free drug molecules to cell surface receptors results in higher concentrations of internalized drug, (E) Fraction of killed tumor cells over time; High concentration of internalized drugs increase the fraction of killed cells. Also, due to the accumulation of free drug in the periphery of the tumor, the cells in this region have suffered the most damage. (Cn: Nanocarrier concentrations ,Cf: Free drug concentrations , Sf: Fraction of killed cells).
Figure 4
Figure 4
Influence of hypoxic region on the distribution of therapeutic agents and therapeutic response; (A) Temporal distribution of responsive nanocarriers in tumor interstitium; Concentration of smaller nanocarriers is higher in tumor tissue, and the increase in the extent of the hypoxic region reduces the concentration, especially for small nanocarriers, (B) Spatial distribution of responsive nanocarriers in tumor interstitium; The highest concentration of nanocarriers is in the periphery of the tumor, while the hypoxic regions have the lowest concentration due to poor perfusion, (C) Temporal distribution of drug released from nanocarriers (20 nm) in tumor interstitium; Weaker accumulation of nanocarriers in tumors involving larger hypoxic regions, results in lower concentrations of free drug, (D) Fraction of killed tumor cells over time; Due to the fact that the concentration of the free drug in hypoxia areas is very low, so the cells in these areas do not suffer from death due to anti-cancer drug. (Cn: Nanocarrier concentration, Sf: fraction of killed cells).
Figure 5
Figure 5
A schematic of drug transport in the vascular, interstitium, and intracellular spaces along with its compartmental representation. (C0: Initial concentration , Cp: Vascular concentration , Cn: Nanocarrier concentration, Cf: Free drug concentration, Cb: Bound drug concentration, Ci: Intracellular concentration, krel: Constant of the drug release , kON: Rate of association of drug with receptors of the cell-surface, kOFF: Rate of disassociation of drug with receptors of the cell-surface, kINT: Constant of cellular uptake,φV: Rate of drug transport per unit volume through the microvessels into the interstitium).
Figure 6
Figure 6
Drug release at (A) pH = 6.2; and (B) pH = 7.2. Experimental data extracted from the literature.

References

    1. Grimes DR, Jansen M, Macauley RJ, Scott JG, Basanta D. Evidence for hypoxia increasing the tempo of evolution in glioblastoma. Br. J. Cancer. 2020;123:1562–1569. doi: 10.1038/s41416-020-1021-5. - DOI - PMC - PubMed
    1. DaiPhung C, Tran TH, Nguyen HT, Jeong J-H, Yong CS, Kim JO. Current developments in nanotechnology for improved cancer treatment, focusing on tumor hypoxia. J. Controlled Release. 2020;324:413–429. doi: 10.1016/j.jconrel.2020.05.029. - DOI - PubMed
    1. Sørensen BS, Horsman MR. Tumor hypoxia: impact on radiation therapy and molecular pathways. Front. Oncol. 2020;10:562. doi: 10.3389/fonc.2020.00562. - DOI - PMC - PubMed
    1. Folkman J. How is blood vessel growth regulated in normal and neoplastic tissue? GHA Clowes Mem. Award Lecture Cancer Res. 1986;46:467–473. - PubMed
    1. Bergers G, Benjamin LE. Tumorigenesis and the angiogenic switch. Nat. Rev. Cancer. 2003;3:401–410. doi: 10.1038/nrc1093. - DOI - PubMed

MeSH terms