. 2021 Sep 29;4(1):1138.
doi: 10.1038/s42003-021-02656-3.

SALM4 negatively regulates NMDA receptor function and fear memory consolidation

Affiliations

SALM4 negatively regulates NMDA receptor function and fear memory consolidation

Eunkyung Lie et al. Commun Biol. .

Abstract

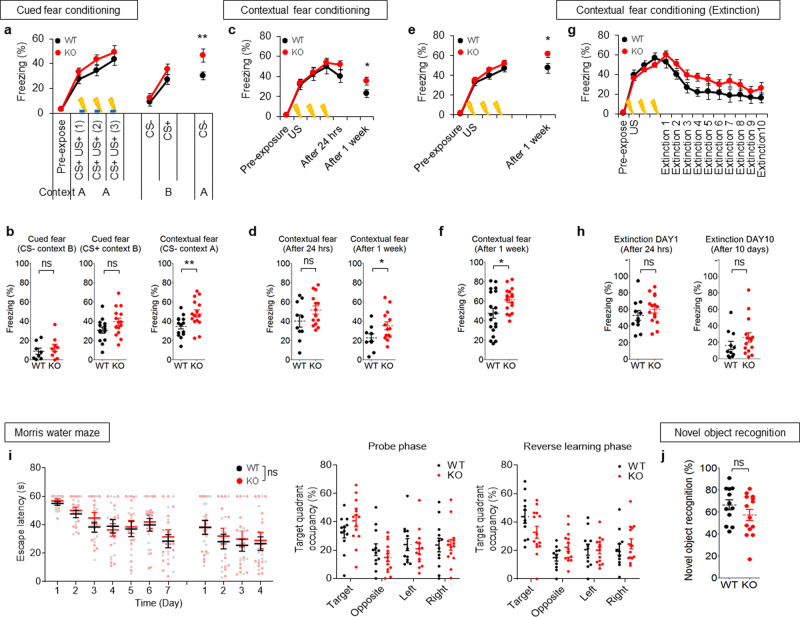
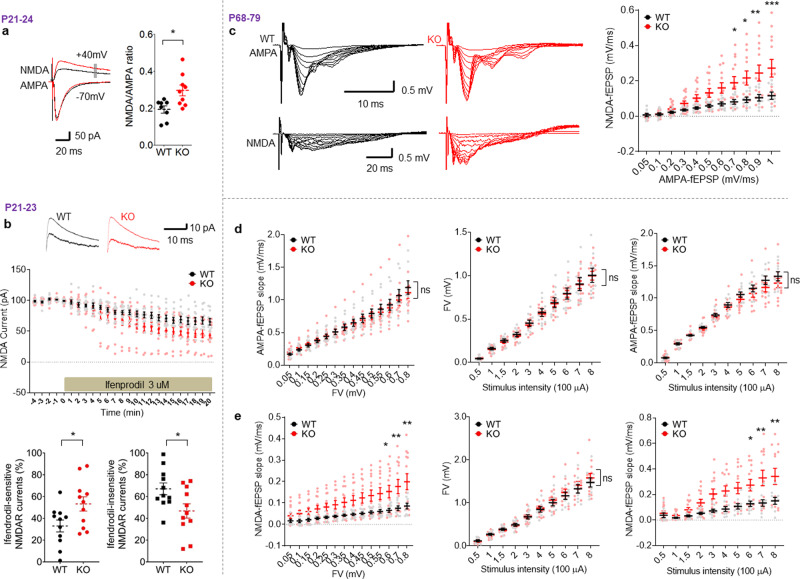
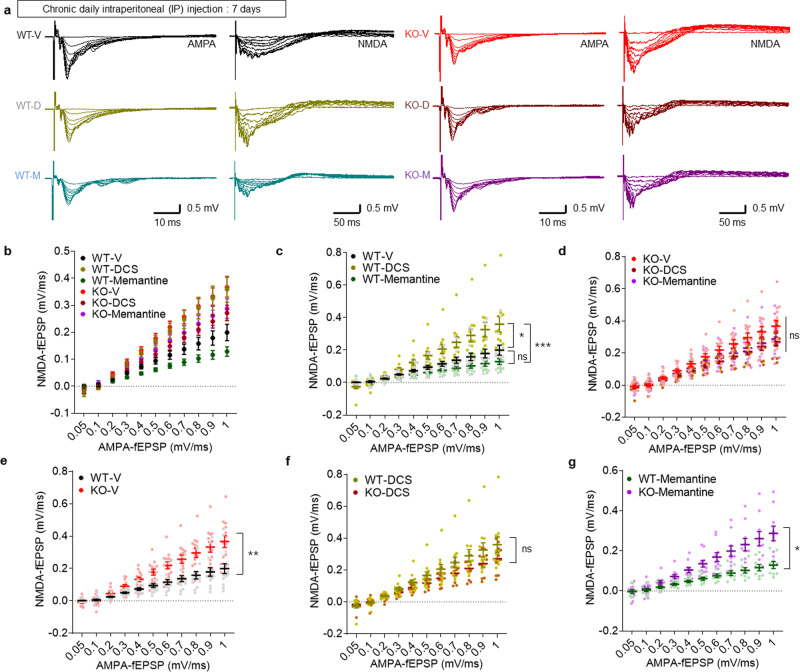
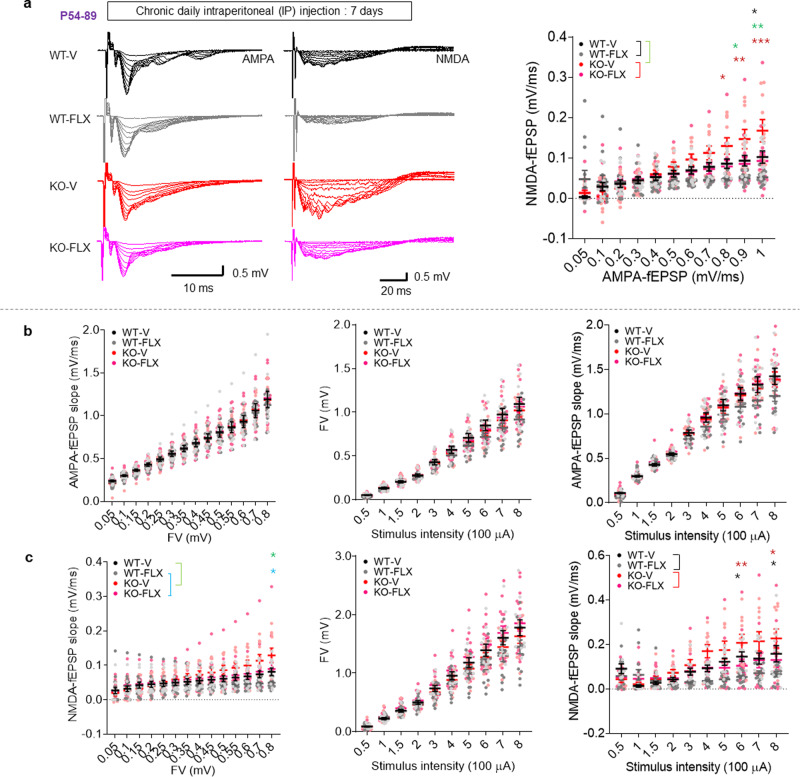
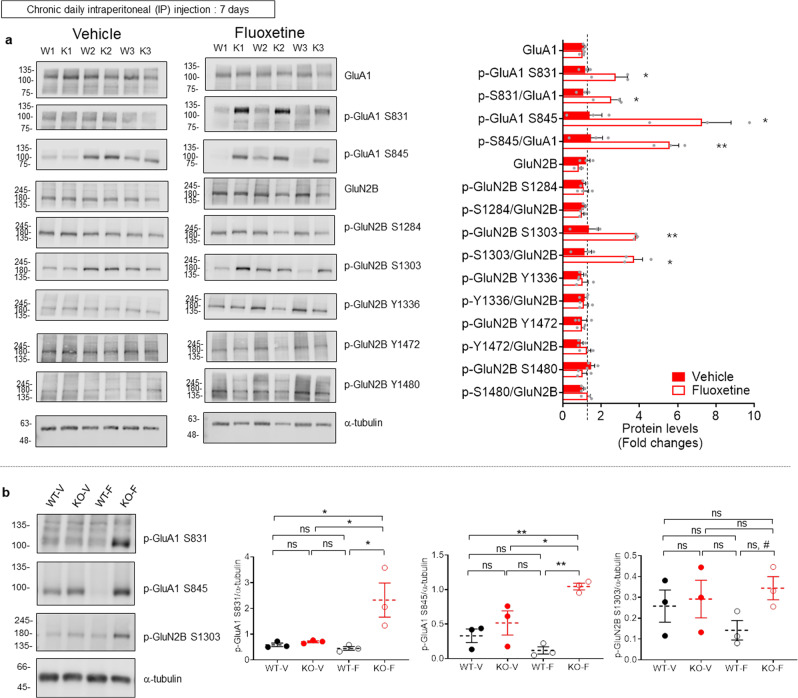
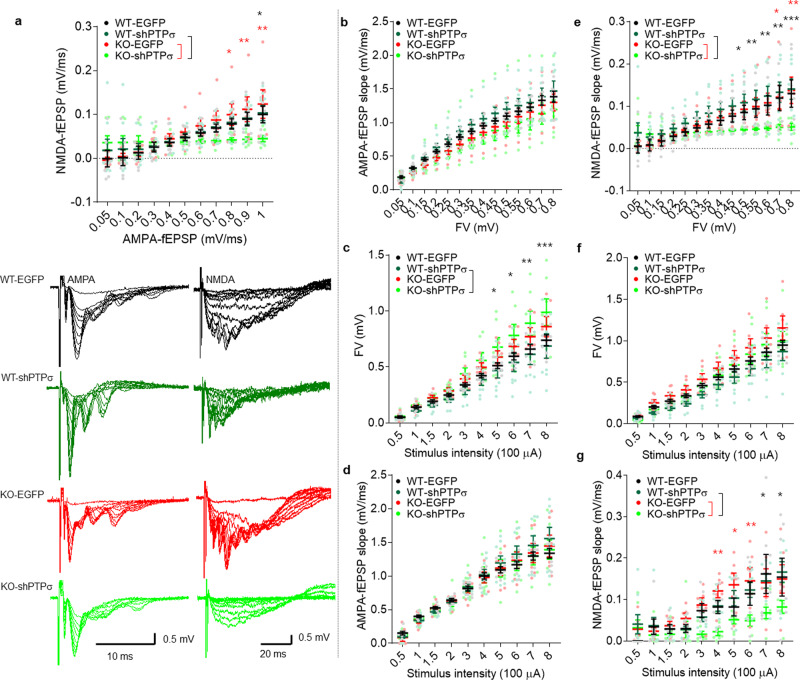
Many synaptic adhesion molecules positively regulate synapse development and function, but relatively little is known about negative regulation. SALM4/Lrfn3 (synaptic adhesion-like molecule 4/leucine rich repeat and fibronectin type III domain containing 3) inhibits synapse development by suppressing other SALM family proteins, but whether SALM4 also inhibits synaptic function and specific behaviors remains unclear. Here we show that SALM4-knockout (Lrfn3-/-) male mice display enhanced contextual fear memory consolidation (7-day post-training) but not acquisition or 1-day retention, and exhibit normal cued fear, spatial, and object-recognition memory. The Lrfn3-/- hippocampus show increased currents of GluN2B-containing N-methyl-D-aspartate (NMDA) receptors (GluN2B-NMDARs), but not α-amino-3-hydroxy-5-methyl-4-isoxazole propionate (AMPA) receptors (AMPARs), which requires the presynaptic receptor tyrosine phosphatase PTPσ. Chronic treatment of Lrfn3-/- mice with fluoxetine, a selective serotonin reuptake inhibitor used to treat excessive fear memory that directly inhibits GluN2B-NMDARs, normalizes NMDAR function and contextual fear memory consolidation in Lrfn3-/- mice, although the GluN2B-specific NMDAR antagonist ifenprodil was not sufficient to reverse the enhanced fear memory consolidation. These results suggest that SALM4 suppresses excessive GluN2B-NMDAR (not AMPAR) function and fear memory consolidation (not acquisition).


Conflict of interest statement

The authors declare no competing interests.

Figures

Fig. 1
Fig. 1. Lrfn3−/− mice show enhanced contextual fear memory consolidation but normal fear memory acquisition and 1-day retention, cued fear memory, spatial learning and memory, and object-recognition memory.
a Normal contextual fear memory acquisition and normal cued fear memory retention (1-day post training), but enhanced contextual fear memory retention (2-day post training), in Lrfn3−/− mice (8–12 weeks). Mice were introduced into a fear-conditioning chamber and exposed to a cue sound on day 1 for fear conditioning (by both context [context A] and sound cue), then exposed to a different chamber (context B) with the same sound on day 2 for cued fear memory (1-day retention), followed by re-exposure to the original chamber [context A] without sound on day 3 for contextual fear memory (or 2-day retention or memory consolidation). (n = 14 mice [wild-type (WT)] and 15 [knockout (KO)], two-way repeated-measure (RM-ANOVA) [no genotype difference], **p < 0.01 indicate the results of Student’s test in b). b Quantification of the results in a. (n = 14 mice [wild-type (WT)] and 15 [knockout (KO)], **p < 0.01, ns, not significant, Student’s test). c Enhanced contextual fear memory consolidation on day 8, but not on day 1, in Lrfn3−/− mice (20–24 weeks). Mice fear conditioned on day 1 were re-exposed successively to the same chamber on day 2 and day 9 for 24 h fear memory retention and 7-day fear memory consolidation, respectively. (n = 10 [WT] and 14 [KO], two-way RM-ANOVA [no genotype difference], *p < 0.05 indicate the results of Student’s test in d). d Quantification of the results in c. (n = 10 [WT] and 14 [KO], *p < 0.05, ns, not significant, Student’s test). e Enhanced contextual fear memory consolidation on day 8 in Lrfn3−/− mice (8–12 weeks). Mice fear conditioned on day 1 were re-exposed to the same chamber on day 8. (n = 19 [WT] and 17 [KO], two-way RM-ANOVA [no genotype difference], *p < 0.05 in the graph indicates the results of Student’s test in f). f Quantification of the results in e. (n = 19 [WT] and 17 [KO], *p < 0.05, Student’s test). g Normal contextual fear extinction in Lrfn3−/− mice (8–12 weeks). Fear extinction was tested by re-exposing mice fear conditioned on day 1 to the same chamber for 10 days starting from day 2. (n = 11 [WT] and 15 [KO], two-way RM-ANOVA [no genotype difference]). h Quantification of the results in g. (n = 11 [WT] and 15 [KO]; ns, not significant, Student’s t-test). i Normal performance of Lrfn3−/− mice (14–22 weeks) in the learning, probe, and reversal phases of the Morris water maze test. (n = 12 [WT] and 14 [KO]; two-way RM-ANOVA (no genotype difference for both learning and reversal phases); ns, not significant, Student’s t-test (quadrant occupancy in the initial and reversal probe phases)). j Normal performance of Lrfn3−/− mice (10–14 weeks) in the novel object-recognition test. One of the two identical objects presented to the subject mouse was replaced with a new object on the next day. (n = 12 [WT] and 14 [KO]; ns, not significant, Student’s t-test). Error bars represent the SEM.
Fig. 2
Fig. 2. Increased NMDAR, but not AMPAR, currents at hippocampal synapses of juvenile and adult Lrfn3−/− mice.
a Increased NMDAR currents at SC-CA1 synapses in the hippocampus of juvenile Lrfn3−/− mice (P21–24), as indicated by the ratio of NMDAR- to AMPAR-EPSCs. (n = 8 slices from 6 mice [WT] and 9, 5 [KO]; *p < 0.05, Student’s t-test). b Increased currents of GuN2B-containing NMDARs at SC-CA1 synapses of Lrfn3−/− mice (P21–23), as shown by the sensitivity of the currents to ifenprodil (GluN2B-specific antagonist). (n = 11 neurons from 6 mice [WT] and 11, 5 [KO]; *p < 0.05 (last five points), Student’s t-test). c Increased ratio of NMDAR- to AMPAR-mediated synaptic transmission at SC-CA1 synapses in adult Lrfn3−/− mice (P68–79), as indicated by the initial slopes of NMDAR-fEPSPs plotted against those for AMPAR-fEPSPs. (n = 9 slices from 5 mice [WT] and 13, 5 (KO); *p < 0.05, **p < 0.01, ***p < 0.001, two-way RM-ANOVA with Bonferroni test). d Dissection of AMPAR-fEPSPs by plotting initial fEPSP slopes against fiber volley amplitudes (left) or stimulation intensities (right), or plotting fiber volley amplitudes against stimulation intensities (middle). (n = 9, 5 [WT] and 13, 5 [KO]; ns, not significant, two-way RM-ANOVA). e Dissection of NMDAR-fEPSPs by plotting initial fEPSP slopes against fiber volley amplitudes (left) or stimulation intensities (right), or plotting fiber volley amplitudes against stimulation intensities (middle). (n = 9, 5 [WT] and 13, 5 [KO], two-way RM-ANOVA [genotype p for left/middle/right panels are 0.03/0.71/0.02]; *p < 0.05 and **p < 0.01 indicate results of Bonferroni tests). Error bars represent the SEM.
Fig. 3
Fig. 3. Differential effects of NMDAR modulators on NMDAR and AMPAR functions at Lrfn3−/− hippocampal synapses.
a Sample traces for the changes in NMDAR and AMPAR components of excitatory synaptic transmission at SC-CA1 synapses induced by chronic treatment of adult Lrfn3−/− mice (P56–91) with DCS (20 mg/kg/d; 7 days; i.p.), memantine (10 mg/kg/d; 7 days; i.p.), or vehicle (V), as shown by NMDAR-fEPSP slopes plotted against AMPAR-fEPSP slopes. b Quantification of the results in a. (n = 14 slices from 4 mice [WT-V], 13, 4 [KO-V], 11, 3 [WT-DCS], 10, 3 [KO-DCS], 9, 3 [WT-Memantine], and 10, 3 [KO-Memantine]). c A subset of the results displayed in b showing the effects of DCS and memantine on WT mice. (n = 14, 4 [WT-V], 11, 3 [WT-DCS], and 9, 3 [WT-Memantine], *p < 0.05, ***p < 0.001, ns, not significant, two-way RM-ANOVA with Bonferroni test [the statistical results are also a subset of the total two-way ANOVA results]). d A subset of the results displayed in b showing the effects of DCS and memantine on KO mice. (n = 13, 4 [KO-V], 10, 3 [KO-DCS], and 10, 3 [KO-Memantine]; ns, not significant, two-way RM-ANOVA with Bonferroni test). e A subset of the results displayed in b comparing vehicle-treated WT and KO mice. (n = 14, 4 [WT-V] and 13, 4 [KO-V], **p < 0.01, two-way RM-ANOVA with Bonferroni test). f A subset of the results displayed in b comparing DCS-treated WT and KO mice. (n = 11, 3 [WT-DCS] and 10, 3 [KO-DCS]; ns, not significant, two-way RM-ANOVA with Bonferroni test)). g A subset of the results displayed in b comparing memantine-treated WT and KO mice. (n = 9, 3 [WT-Memantine] and 10, 3 [KO-Memantine], *p < 0.05, two-way RM-ANOVA with Bonferroni test). Error bars represent the SEM.
Fig. 4
Fig. 4. Differential effects of NMDAR modulators on fear memory consolidation in Lrfn3−/− mice.
a Normal acquisition of fear memory in adult Lrfn3−/− mice (P56–91). (n = 30 mice [WT] and 24 [KO], two-way RM-ANOVA [genotype p = 0.6441]). b Experimental scheme for chronic treatments of DCS (D; 20 mg/kg/d; 7 days; i.p.), memantine (D; 20 mg/kg/d; 7 days; i.p.), or vehicle (V) after fear acquisition and before the test of contextual fear memory consolidation, as measured by freezing levels during days 8–10. After initial contextual fear memory acquisition (a), WT and KO mice were divided into six groups (WT-V/D/M and KO-V/D/M) for chronic drug treatments. c Summary of the quantification of the results from a and b. (n = 10 mice [WT-V], 10 [WT-D], 10 [WT-M], 8 [KO-V], 7 [KO-D], and 9 [KO-M]). d A subset of the results displayed in c comparing WT-V and KO-V. (n = 10 [WT-V], 8 [KO-V], *p < 0.05, two-way RM-ANOVA [the statistical results are also a subset of the total two-way ANOVA results]). e A subset of the results displayed in c comparing WT-M and KO-M. (n = 10 [WT-V], 9 [KO-V], **p < 0.01, two-way RM-ANOVA). f A subset of the results displayed in c comparing WT-D and KO-D. (n = 10 [WT-V], 7 [KO-V]; ns, not significant, two-way RM-ANOVA). g Subsets of the results displayed in c comparing WT-V/D/M or KO-V/D/M. (n = 10 mice [WT-V], 10 [WT-D], 10 [WT-M], 8 [KO-V], 7 [KO-D], and 9 [KO-M]; ns, not significant, two-way RM-ANOVA). Error bars represent the SEM.
Fig. 5
Fig. 5. Fluoxetine normalizes NMDAR function in Lrfn3−/− mice.
a Chronic fluoxetine treatment (5 mg/kg/d; 7 days; i.p.) reduces the ratio of NMDAR- to and AMPAR-mediated synaptic transmission at SC-CA1 synapses in the hippocampus of Lrfn3−/− mice (P54–89), as indicated by NMDAR-fEPSP slopes plotted against AMPAR-fEPSP slopes. (n = 11 slices from 5 mice (WT-V/vehicle), n = 13, 6 (WT-FLX/fluoxetine), n = 10, 5 (KO-V), and n = 15, 5 (KO-FLX); *p < 0.05, **p < 0.01, ***p < 0.001, two-way RM-ANOVA with Bonferroni test). b Chronic fluoxetine treatment does not affect AMPAR-fEPSPs at Lrfn3−/− SC-CA1 synapses, as shown by plotting initial AMPAR-fEPSP slopes against fiber volley amplitudes (left) or stimulation intensities (right), or plotting fiber volley amplitudes against stimulation intensities (middle). (n = 11, 5 [WT-V], n = 13, 6 [WT-FLX], n = 10, 5 [KO-V], and n = 15, 5 [KO-FLX], two-way RM-ANOVA [no genotype difference]). c Chronic fluoxetine treatment reduces NMDAR-fEPSPs at Lrfn3−/− SC-CA1 synapses, as shown by plotting initial NMDAR-fEPSP slopes against fiber volley amplitudes (left) or stimulation intensities (right), or plotting fiber volley amplitudes against stimulation intensities (middle). (n = 11, 5 [WT-V], n = 13, 6 [WT-FLX], n = 10, 5 [KO-V], and n = 15, 5 [KO-FLX], *p < 0.05, **p < 0.01, two-way RM-ANOVA with Bonferroni test). Error bars represent the SEM.
Fig. 6
Fig. 6. Fluoxetine normalizes enhanced fear memory consolidation in Lrfn3−/− mice.
a Normal contextual fear acquisition in Lrfn3−/− mice (8–12 weeks) in context A with foot-shock stimulation (0.8 mA) on day 1. (n = 21 mice [WT] and 21 [KO]; ns, not significant [genotype], two-way RM-ANOVA). b Experimental scheme for chronic fluoxetine/FLX treatment (5 mg/kg/d; 7 days; i.p.) of Lrfn3−/− mice (8–12 weeks) for the rescue of enhanced fear memory consolidation. After initial contextual fear memory acquisition (a), WT and KO mice were divided into four groups (WT-V/FLX and KO-V/FLX) for chronic drug treatments. c Summary of the quantification of the results from b during days 8–10. (n = 10 [WT-V], 11 [WT-FLX], 10 [KO-V], and 11 [KO-FLX]). d Subsets of the results displayed in c for days 8, 9, and 10. (n = 10 [WT-V], 11 [WT-FLX], 10 [KO-V], and 11 [KO-FLX], *p < 0.05, **p < 0.01, ***p < 0.001; ns, not significant, two-way RM-ANOVA with Bonferroni test).
Fig. 7
Fig. 7. Distinct fluoxetine-induced changes of LTP in the WT and Lrfn3−/− hippocampus.
a Sample traces for HFS-LTP at hippocampal SC-CA1 synapses in WT and Lrfn3−/− mice (2–3 months) chronically treated with vehicle and fluoxetine (5 mg/kg/d; 7 days; i.p.). b Summary of the results from a. (n = 9 slices from 3 mice [WT-V/vehicle], 10, 3 [WT-FLX/fluoxetine], 11, 3 [KO-V], and 11, 3 [KO-FLX]). c Quantification of the results from b. (n = 9, 3 [WT-V/vehicle], 10, 3 [WT-FLX/fluoxetine], 11, 3 [KO-V], and 11, 3 [KO-FLX], *p < 0.05; ns, not significant, two-way RM-ANOVA with Tukey’s test [last 5 min]). d A subset of results displayed in b comparing WT-V and KO-V. (n = 9, 3 [WT-V] and 11, 3 [KO-V], Student’s t-test [last 5 min]). e A subset of results displayed in b comparing WT-V and WT-FLX. (n = 9, 3 [WT-V] and 10, 3 [WT-FLX], Student’s t-test [last 5 min]). f A subset of results displayed in b comparing KO-V and KO-FLX. (n = 11, 3 [KO-V] and 11, 3 [KO-FLX], Student’s t-test [last 5 min]). g A subset of results displayed in b comparing WT-FLX and KO-FLX. (n = 10, 3 [WT-FLX] and 11, 3 [KO-FLX], Student’s t-test [last 5 min]). Error bars represent the SEM.
Fig. 8
Fig. 8. Distinct fluoxetine-induced changes in GluA1 and GluN2B phosphorylation in the WT and Lrfn3−/− hippocampus.
a Levels of GluA1 and GluN2B phosphorylation at different amino acid residues in the hippocampus (crude synaptosomes) of WT and Lrfn3−/− mice (2–3 months) chronically treated with vehicle or fluoxetine (5 mg/kg/d; 7 days; i.p.). It is noteworthy that fluoxetine treatment increased GluA1 Ser-831/845 and GluN2B S1303 phosphorylation without affecting total protein levels. Immunoblot signals from WT and KO mice normalized to α-tubulin signals were used to obtain KO/WT ratio values. (n = 3 mice [WT-V/vehicle], 3 [WT-F/fluoxetine], 3 [KO-V], and 3 [KO-F], *p < 0.05, **p < 0.01, Student’s t-test). b Levels of GluA1 S831/S845 and GluN2B S1303 phosphorylation in chronic vehicle/fluoxetine-treated WT and Lrfn3−/− mice. All four samples were run on the same gel for two-way ANOVA comparisons. (n = 3 mice [WT-V/vehicle], 3 [WT-F/fluoxetine], 3 [KO-V], and 3 [KO-F], *p < 0.05, **p < 0.01; ns, not significant, two-way RM-ANOVA with Tukey’s test (except for WT-F and KO-F in p-GluN2B S1303 where Student’s t-test was used to obtain #P < 0.05)). Error bars represent the SEM.
Fig. 9
Fig. 9. Presynaptic PTPσ is required for SALM4 deletion-induced NMDAR hyperactivity.
a Acute knockdown of PTPσ for 2 weeks in the CA3 region of the hippocampus in Lrfn3−/−, but not WT, mice (2–6 months) rescues NMDAR-fEPSPs but not AMPAR-fEPSPs at SC-CA1 synapses, as indicated by NMDAR-fEPSP slopes plotted against AMPAR-fEPSP slopes. (n = 7 slices from 3 mice [WT-EGFP/control], 8, 3 [WT-shPTPσ], 6, 3 [KO-EGFP], and 7, 3 [KO-shPTPσ], *p < 0.05, **p < 0.01, two-way RM-ANOVA with Bonferroni test). b PTPσ knockdown in WT or Lrfn3−/− CA3 neurons (2–6 months) does not affect AMPAR-fEPSPs at SC-CA1 synapses, as indicated by AMPAR-fEPSP slopes plotted against fiber volley amplitudes. (n = 7, 3 [WT-EGFP], 8, 3 [WT-shPTPσ], 6, 3 [KO-EGFP], and 7, 3 [KO-shPTPσ], two-way RM-ANOVA). c PTPσ knockdown in WT or Lrfn3−/− CA3 neurons (2–6 months) does not affect fiber volley amplitudes plotted against stimulation intensities under the context of AMPAR-fEPSPs measurements. (n = 7, 3 [WT-EGFP], 8, 3 [WT-shPTPσ], 6, 3 [KO-EGFP], and 7, 3 [KO-shPTPσ], *p < 0.05, **p < 0.01, ***p < 0.001, two-way RM-ANOVA with Bonferroni test). d PTPσ knockdown in WT or Lrfn3−/− CA3 neurons (2–6 months) does not affect AMPAR-fEPSPs at SC-CA1 synapses, as indicated by AMPAR-fEPSP slopes plotted against stimulation intensities. (n = 7, 3 [WT-EGFP], 8, 3 [WT-shPTPσ], 6, 3 [KO-EGFP], and 7, 3 [KO-shPTPσ], two-way RM-ANOVA). e PTPσ knockdown in WT or Lrfn3−/− CA3 neurons (2–6 months) rescues NMDAR-fEPSPs at SC-CA1 synapses, as indicated by NMDAR-fEPSP slopes plotted against fiber volley amplitudes. (n = 7, 3 [WT-EGFP], 8, 3 [WT-shPTPσ], 6, 3 [KO-EGFP], and 7, 3 [KO-shPTPσ], *p < 0.05, **p < 0.01, ***p < 0.001, two-way RM-ANOVA with Bonferroni test). f PTPσ knockdown in WT or Lrfn3−/− CA3 neurons (2–6 months) does not affect fiber volley amplitudes plotted against stimulation intensities under the context of NMDAR-fEPSPs measurements. (n = 7, 3 [WT-EGFP], 8, 3 [WT-shPTPσ], 6, 3 [KO-EGFP], and 7, 3 [KO-shPTPσ], two-way RM-ANOVA). g PTPσ knockdown in WT or Lrfn3−/− CA3 neurons (2–6 months) rescues NMDAR-fEPSPs at SC-CA1 synapses, as indicated by NMDAR-fEPSP slopes plotted against stimulation intensities. (n = 7, 3 [WT-EGFP], 8, 3 [WT-shPTPσ], 6, 3 [KO-EGFP], and 7, 3 [KO-shPTPσ], *p < 0.05, **p < 0.01, two-way RM-ANOVA with Bonferroni test). Error bars represent the SEM.

References

    1. Sudhof TC. Towards an understanding of synapse formation. Neuron. 2018;100:276–293. doi: 10.1016/j.neuron.2018.09.040. - DOI - PMC - PubMed
    1. Sudhof TC. Synaptic neurexin complexes: a molecular code for the logic of neural circuits. Cell. 2017;171:745–769. doi: 10.1016/j.cell.2017.10.024. - DOI - PMC - PubMed
    1. Siddiqui TJ, Craig AM. Synaptic organizing complexes. Curr. Opin. Neurobiol. 2011;21:132–143. doi: 10.1016/j.conb.2010.08.016. - DOI - PMC - PubMed
    1. Sakers K, Eroglu C. Control of neural development and function by glial neuroligins. Curr. Opin. Neurobiol. 2019;57:163–170. doi: 10.1016/j.conb.2019.03.007. - DOI - PMC - PubMed
    1. de Wit J, Ghosh A. Specification of synaptic connectivity by cell surface interactions. Nat. Rev. Neurosci. 2016;17:22–35. doi: 10.1038/nrn.2015.1. - DOI - PubMed

Publication types

MeSH terms

Substances

LinkOut - more resources