. 2021 Nov;27(11):2032-2040.
doi: 10.1038/s41591-021-01540-1. Epub 2021 Sep 29.

Correlates of protection against symptomatic and asymptomatic SARS-CoV-2 infection

Collaborators, Affiliations

Correlates of protection against symptomatic and asymptomatic SARS-CoV-2 infection

Shuo Feng et al. Nat Med. 2021 Nov.

Abstract

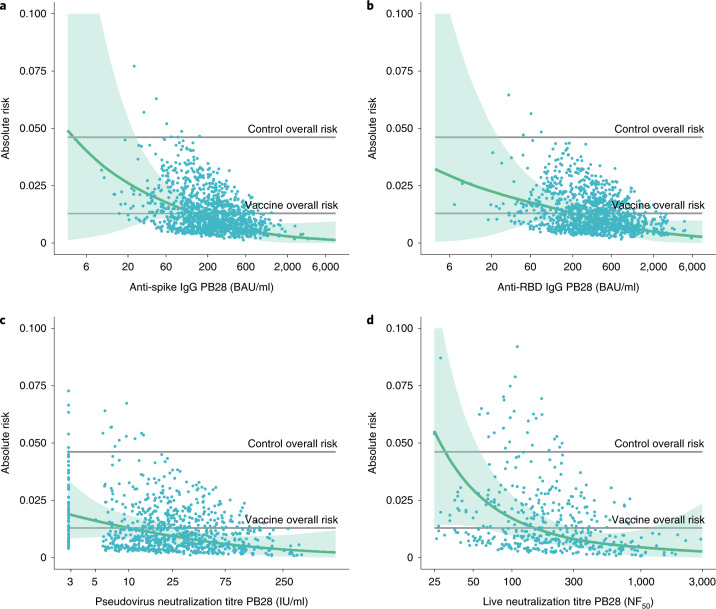
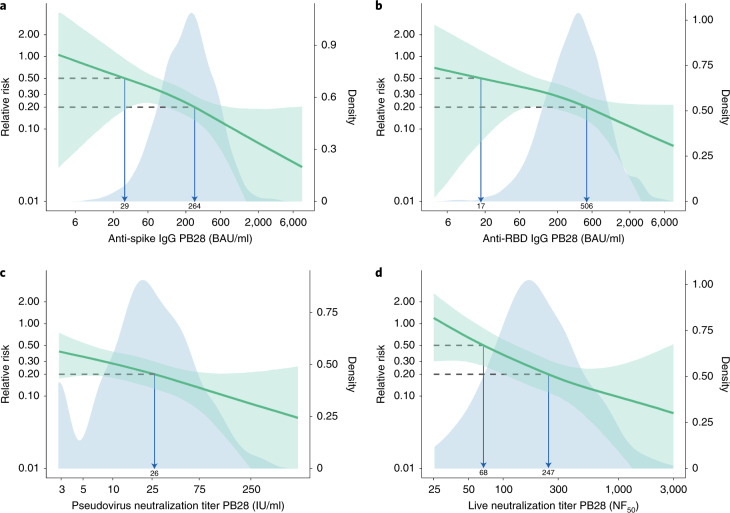
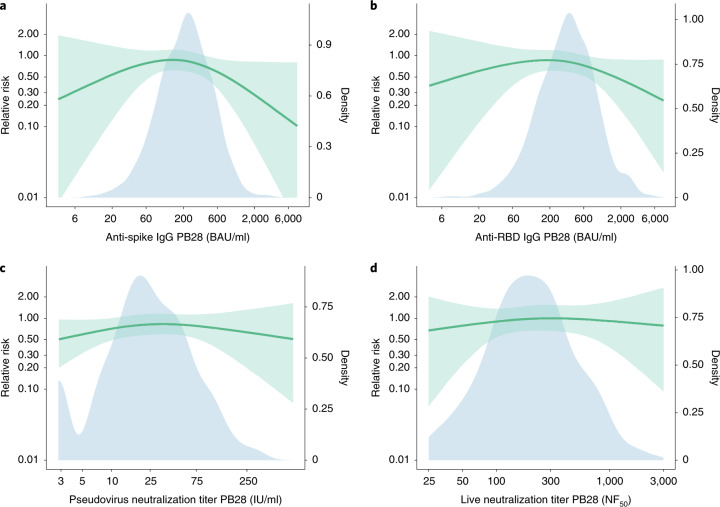
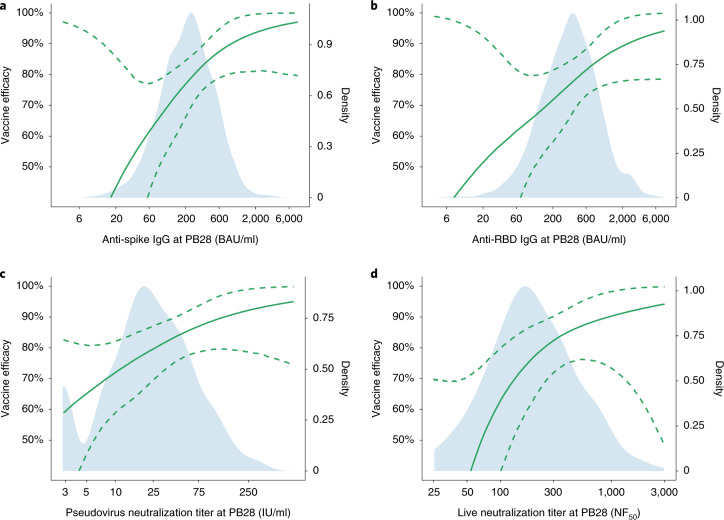
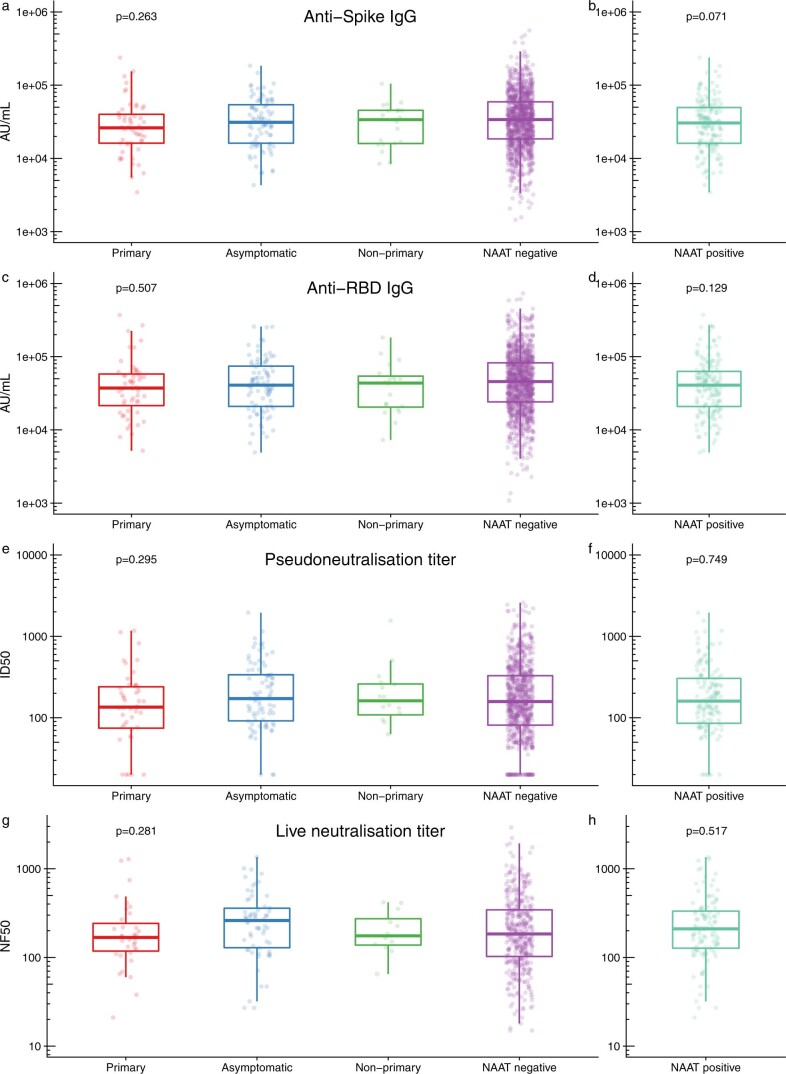
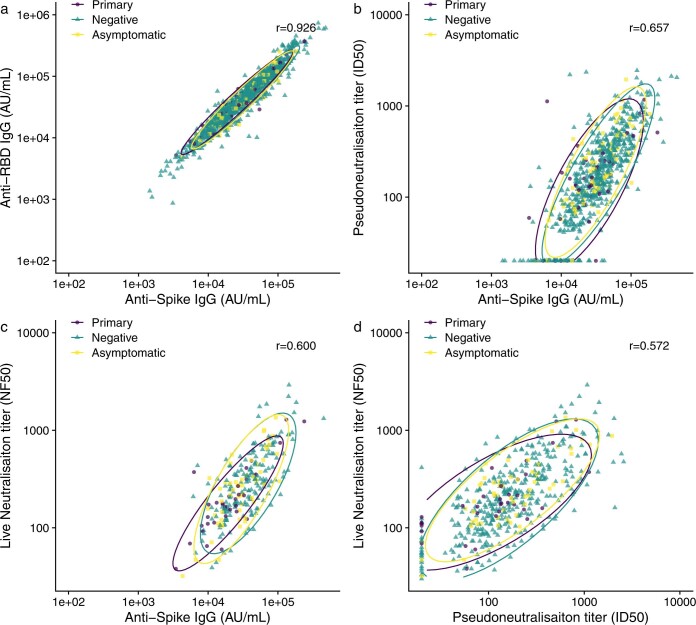
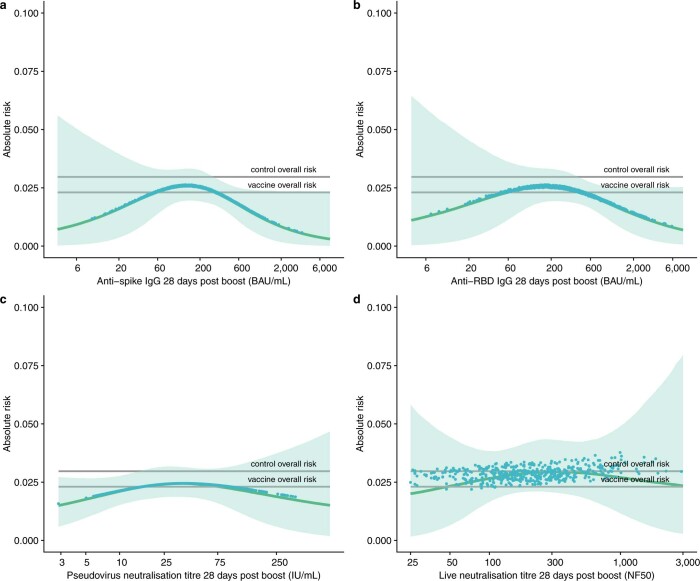
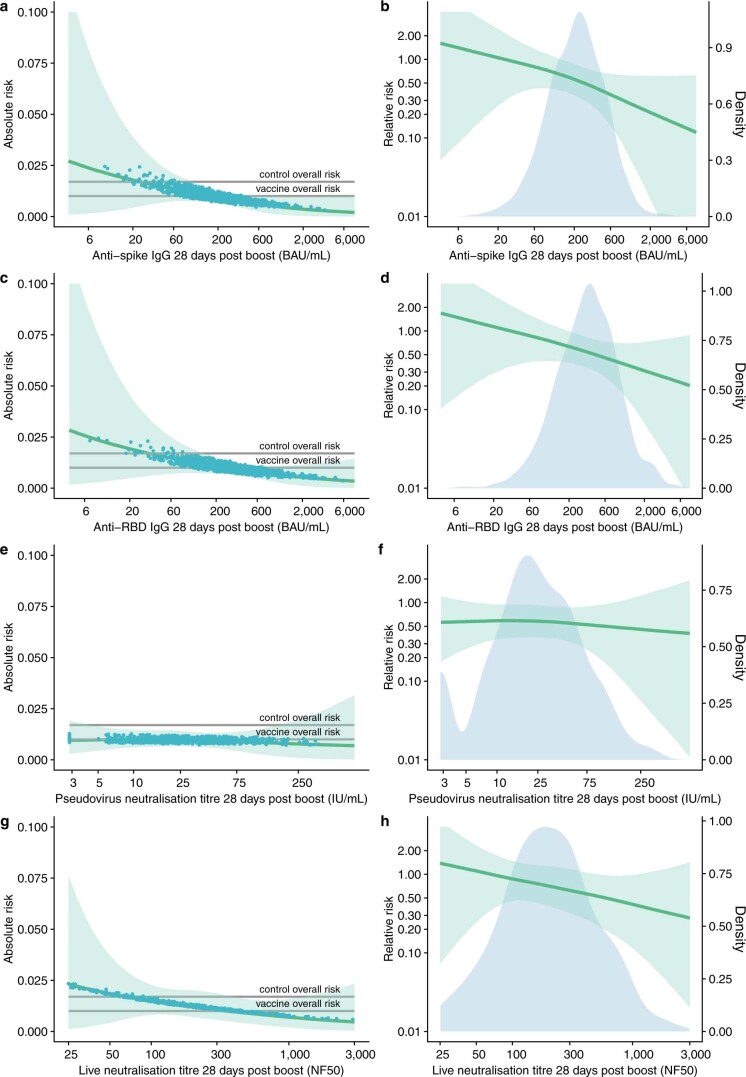
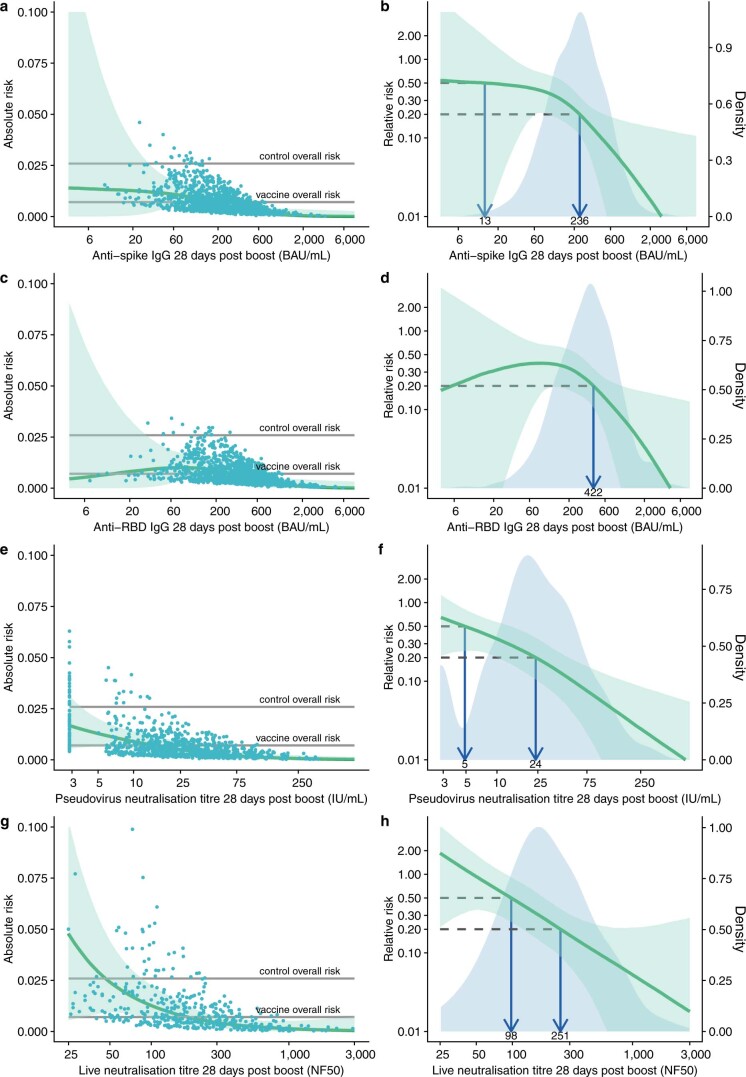
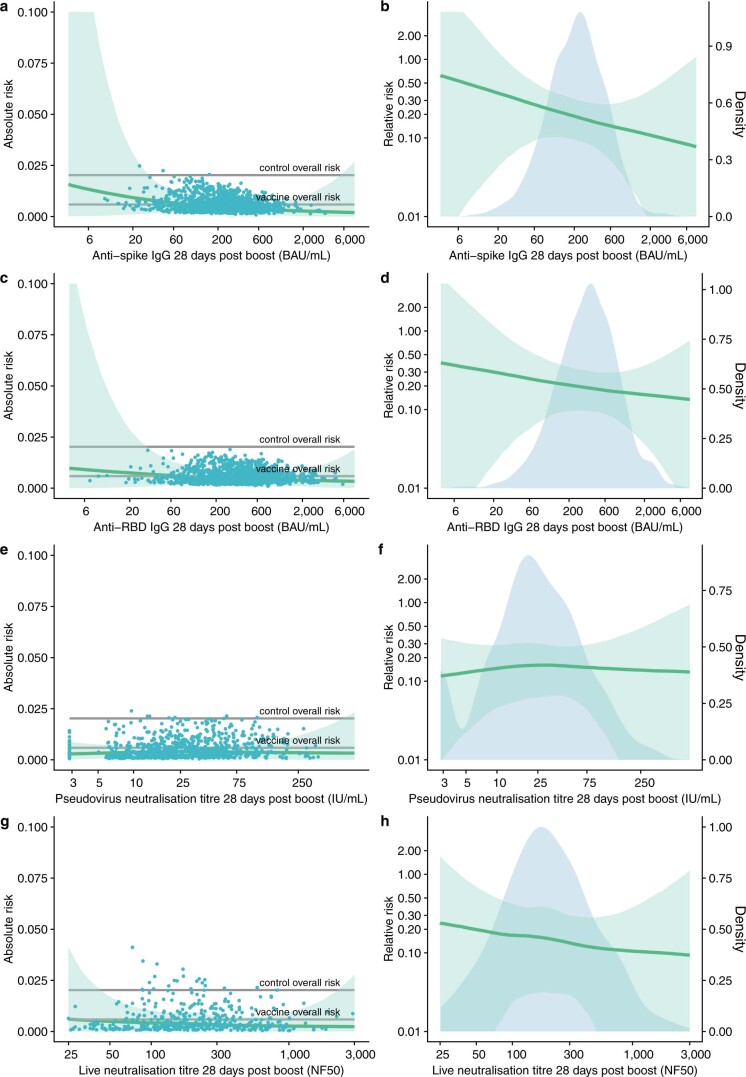
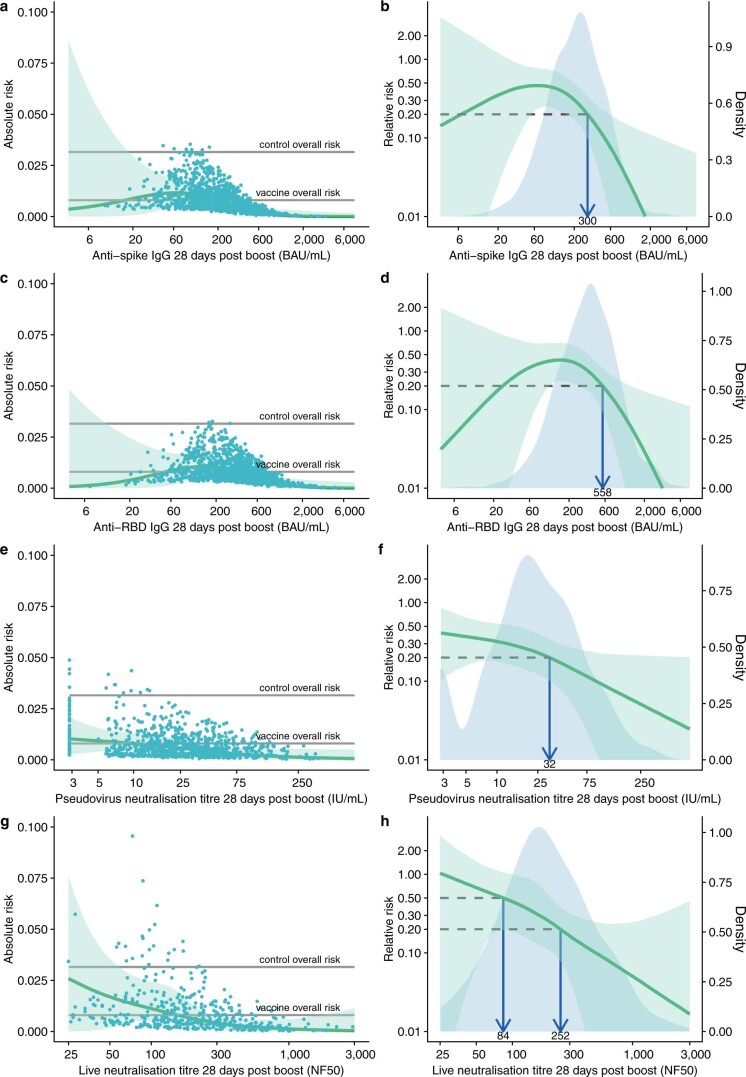
The global supply of COVID-19 vaccines remains limited. An understanding of the immune response that is predictive of protection could facilitate rapid licensure of new vaccines. Data from a randomized efficacy trial of the ChAdOx1 nCoV-19 (AZD1222) vaccine in the United Kingdom was analyzed to determine the antibody levels associated with protection against SARS-CoV-2. Binding and neutralizing antibodies at 28 days after the second dose were measured in infected and noninfected vaccine recipients. Higher levels of all immune markers were correlated with a reduced risk of symptomatic infection. A vaccine efficacy of 80% against symptomatic infection with majority Alpha (B.1.1.7) variant of SARS-CoV-2 was achieved with 264 (95% CI: 108, 806) binding antibody units (BAU)/ml: and 506 (95% CI: 135, not computed (beyond data range) (NC)) BAU/ml for anti-spike and anti-RBD antibodies, and 26 (95% CI: NC, NC) international unit (IU)/ml and 247 (95% CI: 101, NC) normalized neutralization titers (NF50) for pseudovirus and live-virus neutralization, respectively. Immune markers were not correlated with asymptomatic infections at the 5% significance level. These data can be used to bridge to new populations using validated assays, and allow extrapolation of efficacy estimates to new COVID-19 vaccines.


Conflict of interest statement

Oxford University has entered into a partnership with AstraZeneca for further development of ChAdOx1 nCoV-19. S.C.G. is a cofounder of Vaccitech (collaborators in the early development of this vaccine candidate) and named as an inventor on a patent covering use of ChAdOx1 vectored vaccines and a patent application covering this SARS-CoV-2 vaccine (PCT/GB2012/000467). T.L. is named as an inventor on a patent application covering this SARS-CoV-2 vaccine and was a consultant to Vaccitech for an unrelated project during the conduct of the study. A.J.P. is chair of the UK Department of Health and Social Care (DHSC) Joint Committee on Vaccination & Immunisation (JCVI) but does not participate in discussions on COVID-19 vaccines, and is a member of WHO SAGE. The views expressed in this article do not necessarily represent the views of the DHSC, JCVI, NIHR, or WHO. T.W., H.S., I.H., J.B., E.J.K., K.S., J.V., and T.L.V. are employees of AstraZeneca. The other authors declare no competing interests.

Figures

Fig. 1
Fig. 1. Predicted absolute risk of primary symptomatic COVID-19 as a function of immune markers measured at PB28 by generalized additive regression.
ad, Predicted absolute risk of primary symptomatic COVID-19 as a function of anti-spike IgG measured at PB28 (52 cases, 1,155 noncases included in the analysis) (a), anti-RBD IgG measured at PB28 (52 cases, 1,155 noncases included in the analysis) (b), pseudovirus neutralization antibody titers at PB28 (47 cases, 828 noncases included in the analysis (c), and live-virus neutralization antibody titers PB28 (36 cases, 412 noncases included in the analysis) (d). Gray horizontal lines show the overall risk of primary symptomatic COVID-19 in the control group (MenACWY) and vaccine groups (ChAdOx1 nCoV-19). Blue dots show the absolute risk predicted from the model across the range of antibody values included in the analysis, adjusting for baseline exposure risk to SARS-CoV-2 infection. Green shaded areas show the CI around the predicted mean probability (green line).
Fig. 2
Fig. 2. Relative risk of primary symptomatic COVID-19 among vaccine recipients compared with MenACWY control arm participants as a function of immune markers measured at PB28.
a, Anti-spike IgG measured at PB28 (52 cases, 1,155 noncases included in the analysis). b, Anti-RBD IgG measured at PB28 (52 cases, 1,155 noncases included in the analysis). c, Pseudovirus neutralization antibody titers at PB28 (47 cases, 828 noncases included in the analysis). d, Live-virus neutralization antibody titers at PB28 (36 cases, 412 noncases included in the analysis). Blue shaded areas represent the immune marker density distribution. Green lines show the relative risk of infection among vaccine recipients compared with that of the MenACWY control arm participants, derived by dividing the output curve from Fig. 1 by the overall risk of infection in the MenACWY control group. The green lines are the median relative risk obtained from 10,000 bootstrap samples. Green shaded areas are 95% bootstrapped CIs for the relative risk. The arrows point to the immune marker values at 0.20 and 0.50 relative risk, that is 80% and 50% VE for illustrative purpose. The full range of VE estimates from 50 to 90% are shown in Table 2.
Fig. 3
Fig. 3. Relative risk of asymptomatic SARS-CoV-2 infection among vaccine recipients compared with the MenACWY control arm participants as a function of immune markers measured at PB28.
a, Anti-spike IgG measured at PB28 (91 cases, 1,155 noncases included in the analysis). b, Anti-RBD IgG measured at PB28 (91 cases, 1,155 noncases included in the analysis). c, Pseudovirus neutralization antibody titers at PB28 (86 cases, 828 noncases included in the analysis). d, Live-virus neutralization antibody titers at PB28 (62 cases, 412 noncases included in the analysis). Blue shaded areas represent the immune marker density distribution. Green lines show the relative risk of infection among vaccine recipients compared with the MenACWY control arm participants. The green lines are the median relative risk obtained from 10,000 bootstrap samples. Green shaded areas are bootstrapped 95% CIs.
Fig. 4
Fig. 4. VE against primary symptomatic COVID-19 as a function of immune markers measured at PB28.
a, Anti-spike IgG measured at PB28 (52 cases, 1,155 noncases included in the analysis). b, Anti-RBD IgG measured at PB28 (52 cases, 1,155 noncases included in the analysis). c, Pseudovirus neutralization antibody titers at PB28 (47 cases, 828 noncases included in the analysis). d, Live-virus neutralization antibody titers at PB28 (36 cases, 412 noncases included in the analysis). Blue shaded areas represent the immune marker density distribution. Green lines show the VE, and green dotted lines are 95% bootstrapped confidence intervals for VE. VE is computed as 1 minus the relative risks shown in Fig. 2. These results are also shown in Table 2 at 10% increments on the y axis.
Extended Data Fig. 1
Extended Data Fig. 1. Participant flow chart showing inclusion in correlates models.
Eligible participants comprised the Correlates Population and those with samples processed comprised the Correlates Cohort.
Extended Data Fig. 2
Extended Data Fig. 2. Immune markers measured at day 28 post-second dose, in primary symptomatic, asymptomatic, non-primary cases, NAAT positive cases and NAAT negative non-cases.
a: N = 1155 NAAT negative, 52 primary, 91 asymptomatic and 20 non-primary, b: N = 163 NAAT positive participants’ anti-spike IgG measured at 28 days post boost; c: N = 1155 negative, 52 primary, 91 asymptomatic and 20 non-primary, d: N = 163 NAAT positive participants’ anti-RBD IgG measured at 28 days post boost; e: N = 828 NAAT negative, 47 primary, 86 asymptomatic and 16 non-primary, f: N = 149 NAAT positive participants’ pseudovirus neutralisation titre measured at 28 days post boost; g: N = 412 negative, 36 primary, 62 asymptomatic and 12 non-primary, h: N = 110 NAAT positive participants’ live neutralisation titre measured at 28 days post boost. ah: minima: smallest value; maxima: largest value; centre: median value; bounds of box: 25% and 75% quartile value; upper/lower whisker extends from the hinge to the largest/smallest value no further than 1.5 * inter-quartile range from the hinge. IgG: Immunoglobulin G; RBD: receptor binding domain. Primary symptomatic cases: NAAT+ with at least one COVID symptom (cough, fever, shortness of breath, anosmia, aguesia). Asymptomatic cases: NAAT+ on weekly self-swab with no symptoms recorded. Non-primary cases: NAAT+ with only non-primary COVID symptoms (for example nausea, diarrhoea). P-value estimated by one-way ANOVA test comparing between primary, asymptomatic, non-primary cases and NAAT negative non-cases and by two sample t-test comparing between NAAT positive cases and NAAT negative non-cases (two-sided).
Extended Data Fig. 3
Extended Data Fig. 3. Correlations between a, Anti-SARS-CoV-2 spike and RBD IgG. b, Anti-SARS-CoV-2 Spike IgG and pseudovirus neutralisation titre. c, Anti-SARS-CoV-2 Spike IgG and live virus neutralisation titre. d, pseudovirus neutralisation titres and live virus neutralisation titres.
95% confidence ellipses assuming a t-distribution are shown for each outcome (primary symptomatic cases, asymptomatic cases and negative controls). Pearson correlation coefficients shown as r values using all available data. Primary symptomatic cases: NAAT+ with at least one COVID symptom (cough, fever, shortness of breath, anosmia, aguesia). Asymptomatic cases: NAAT+ on weekly self-swab with no symptoms recorded.
Extended Data Fig. 4
Extended Data Fig. 4. Predicted absolute risk of asymptomatic SARS-CoV-2 infection as a function of immune markers measured 28 days post second dose.
Predicted absolute risk of asymptomatic infection as a function of: a: Anti-spike IgG measured at 28 days post boost (91 cases, 1155 non-cases included in the analysis). b: Anti-RBD IgG measured at 28 days post boost (91 cases, 1155 non-cases included in the analysis). c: Pseudovirus neutralisation antibody titres 28 days post boost (86 cases, 828 non-cases included in the analysis). d: Live-virus neutralisation antibody titres 28 days post boost (62 cases, 412 non-cases included in the analysis). Grey horizontal lines show the overall risk of primary symptomatic COVID-19 in the control group (MenACWY) and vaccine groups (ChAdOx1 nCoV-19). Blue dots show the absolute risk predicted from the model across the range of antibody values included in the analysis, adjusting for baseline exposure risk to SARS-CoV-2 infection. Green shaded areas show the confidence interval around the predicted mean probability (green line).
Extended Data Fig. 5
Extended Data Fig. 5. Sensitivity analysis showing absolute and relative risk of asymptomatic SARS-CoV-2 infection as a function of immune markers measured at 28 days post second dose excluding cases with low viral load (Ct ≥ 30).
a, c, e, g: Grey horizontal lines show the overall risk of primary symptomatic COVID-19 in the control group (MenACWY) and vaccine groups (ChAdOx1 nCoV-19). Blue dots show the absolute risk predicted from the model across the range of antibody values included in the analysis, adjusting for baseline exposure risk to SARS-CoV-2 infection. Green shaded areas show the confidence interval around the predicted mean probability (green line). b, d, f, h: Blue shaded areas represent the immune marker density distribution. Green lines show the relative risk of infection among vaccine recipients compared to the MenACWY control arm participants. The green lines are the median relative risk obtained from 10,000 bootstrap samples. Green shaded areas are 95% bootstrapped confidence intervals for the relative risk.
Extended Data Fig. 6
Extended Data Fig. 6. Sensitivity analysis showing absolute and relative risk of primary symptomatic SARS-CoV-2 infection in participants with symptoms of shortness of breath as a function of immune markers measured at day 28 post-second dose.
Results are shown for: a, b: Anti-spike IgG measured at 28 days post boost (28 cases, 1155 non-cases included in the analysis). c, d: Anti-RBD IgG measured at 28 days post boost (28 cases, 1155 non-cases included in the analysis). e, f: Pseudovirus neutralisation antibody titres 28 days post boost (27 cases, 828 non-cases included in the analysis). g, h: Live virus neutralisation antibody titres 28 days post boost (22 cases, 412 non-cases included in the analysis). a, c, e, g: Grey horizontal lines show the overall risk of primary symptomatic COVID-19 in the control group (MenACWY) and vaccine groups (ChAdOx1 nCoV-19). Blue dots show the absolute risk predicted from the model across the range of antibody values included in the analysis, adjusting for baseline exposure risk to SARS-CoV-2 infection. Green shaded areas show the confidence interval around the predicted mean probability (green line) b, d, f, h: Blue shaded areas represent the immune marker density distribution. Green lines show the relative risk of infection among vaccine recipients compared to the MenACWY control arm participants. The green lines are the median relative risk obtained from 10,000 bootstrap samples. Green shaded areas are 95% bootstrapped confidence intervals for the relative risk.
Extended Data Fig. 7
Extended Data Fig. 7. Sensitivity analysis showing absolute and relative risk of primary symptomatic SARS-CoV-2 infection in participants with no symptoms of shortness of breath as a function of immune markers measured at day 28 post-second dose.
Results are shown for: a, b: Anti-spike IgG measured at 28 days post boost (24 cases, 1155 non-cases included in the analysis). c, d: Anti-RBD IgG measured at 28 days post boost (24 cases, 1155 non-cases included in the analysis). e, f: Pseudovirus neutralisation antibody titres 28 days post boost (20 cases, 828 non-cases included in the analysis). g, h: Live virus neutralisation antibody titres 28 days post boost (14 cases, 412 non-cases included in the analysis). a, c, e, g: Grey horizontal lines show the overall risk of primary symptomatic COVID-19 in the control group (MenACWY) and vaccine groups (ChAdOx1 nCoV-19). Blue dots show the absolute risk predicted from the model across the range of antibody values included in the analysis, adjusting for baseline exposure risk to SARS-CoV-2 infection. Green shaded areas show the confidence interval around the predicted mean probability (green line). b, d, f, h: Blue shaded areas represent the immune marker density distribution. Green lines show the relative risk of infection among vaccine recipients compared to the MenACWY control arm participants. The green lines are the median relative risk obtained from 10,000 bootstrap samples. Green shaded areas are 95% bootstrapped confidence intervals for the relative risk.
Extended Data Fig. 8
Extended Data Fig. 8. Sensitivity analysis showing absolute and relative risk primary symptomatic SARS-CoV-2 infection with 3 or more COVID-19 symptoms as a function of immune markers measured at day 28 post-second dose.
Results are shown for: a, b: Anti-spike IgG measured at 28 days post boost (32 cases, 1155 non-cases included in the analysis). c, d: Anti-RBD IgG measured at 28 days post boost (32 cases, 1155 non-cases included in the analysis). e, f: Pseudovirus neutralisation antibody titres 28 days post boost (28 cases, 828 non-cases included in the analysis). g, h: Live virus neutralisation antibody titres 28 days post boost (21 cases, 412 non-cases included in the analysis). a, c, e, g: Grey horizontal lines show the overall risk of primary symptomatic COVID-19 in the control group (MenACWY) and vaccine groups (ChAdOx1 nCoV-19). Blue dots show the absolute risk predicted from the model across the range of antibody values included in the analysis, adjusting for baseline exposure risk to SARS-CoV-2 infection. Green shaded areas show the confidence interval around the predicted mean probability (green line). b, d, f, h: Blue shaded areas represent the immune marker density distribution. Green lines show the relative risk of infection among vaccine recipients compared to the MenACWY control arm participants. The green lines are the median relative risk obtained from 10,000 bootstrap samples. Green shaded areas are 95% bootstrapped confidence intervals for the relative risk.

References

    1. World Health Organisation. The COVID-19 candidate vaccine landscape. https://www.who.int/publications/m/item/draft-landscape-of-covid-19-cand... (2021).
    1. Voysey M, et al. Safety and efficacy of the ChAdOx1 nCoV-19 vaccine (AZD1222) against SARS-CoV-2: an interim analysis of four randomised controlled trials in Brazil, South Africa, and the UK. Lancet. 2021;397:99–111. doi: 10.1016/S0140-6736(20)32661-1. - DOI - PMC - PubMed
    1. Voysey M, et al. Single-dose administration and the influence of the timing of the booster dose on immunogenicity and efficacy of ChAdOx1 nCoV-19 (AZD1222) vaccine: a pooled analysis of four randomised trials. Lancet. 2021;397:881–891. doi: 10.1016/S0140-6736(21)00432-3. - DOI - PMC - PubMed
    1. Moderna. Moderna’s COVID-19 vaccine candidate meets its primary efficacy endpoint in the first interim analysis of the phase 3 COVE study. https://investors.modernatx.com/news-releases/news-release-details/moder... (2020).
    1. Polack FP, et al. Safety and efficacy of the BNT162b2 mRNA Covid-19 vaccine. N. Engl. J. Med. 2020;383:2603–2615. doi: 10.1056/NEJMoa2034577. - DOI - PMC - PubMed

Publication types

MeSH terms

Supplementary concepts