. 2021 Oct;598(7880):327-331.
doi: 10.1038/s41586-021-03929-x. Epub 2021 Sep 29.

Blood and immune development in human fetal bone marrow and Down syndrome

Laura Jardine #  1   2 Simone Webb #  1 Issac Goh  1 Mariana Quiroga Londoño  3 Gary Reynolds  1 Michael Mather  1 Bayanne Olabi  1 Emily Stephenson  1 Rachel A Botting  1 Dave Horsfall  1 Justin Engelbert  1 Daniel Maunder  1 Nicole Mende  3 Caitlin Murnane  4 Emma Dann  5 Jim McGrath  1 Hamish King  6 Iwo Kucinski  3 Rachel Queen  1 Christopher D Carey  7 Caroline Shrubsole  2 Elizabeth Poyner  1 Meghan Acres  1 Claire Jones  8 Thomas Ness  8 Rowen Coulthard  8 Natalina Elliott  4 Sorcha O'Byrne  4 Myriam L R Haltalli  3 John E Lawrence  5 Steven Lisgo  1 Petra Balogh  5 Kerstin B Meyer  5 Elena Prigmore  5 Kirsty Ambridge  5 Mika Sarkin Jain  5 Mirjana Efremova  9 Keir Pickard  2 Thomas Creasey  2   10 Jaume Bacardit  11 Deborah Henderson  1 Jonathan Coxhead  1 Andrew Filby  1 Rafiqul Hussain  1 David Dixon  1 David McDonald  1 Dorin-Mirel Popescu  1 Monika S Kowalczyk  12 Bo Li  12 Orr Ashenberg  12   13 Marcin Tabaka  12 Danielle Dionne  12 Timothy L Tickle  12   14 Michal Slyper  12 Orit Rozenblatt-Rosen  12 Aviv Regev  12 Sam Behjati  5   15 Elisa Laurenti  3 Nicola K Wilson  3 Anindita Roy  4   16   17   18 Berthold Göttgens  3 Irene Roberts  4   16   17   18 Sarah A Teichmann  5   19 Muzlifah Haniffa  20   21   22
Affiliations

Blood and immune development in human fetal bone marrow and Down syndrome

Laura Jardine et al. Nature. 2021 Oct.

Abstract

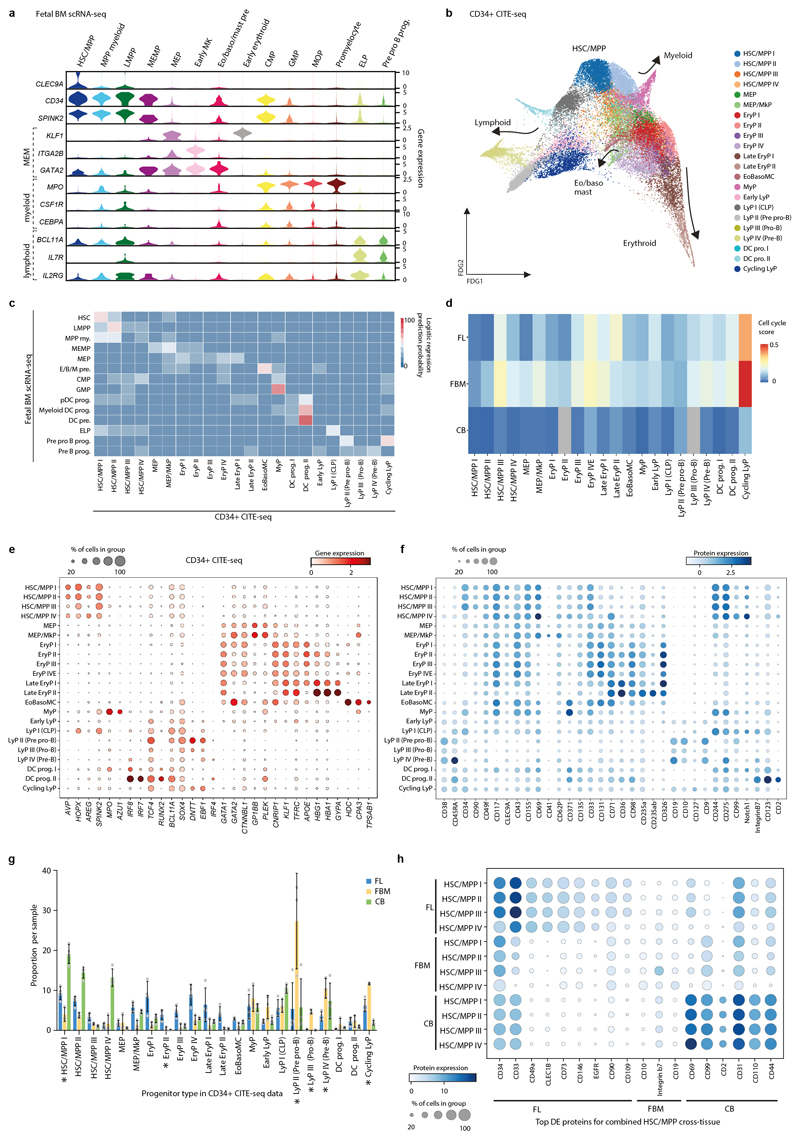
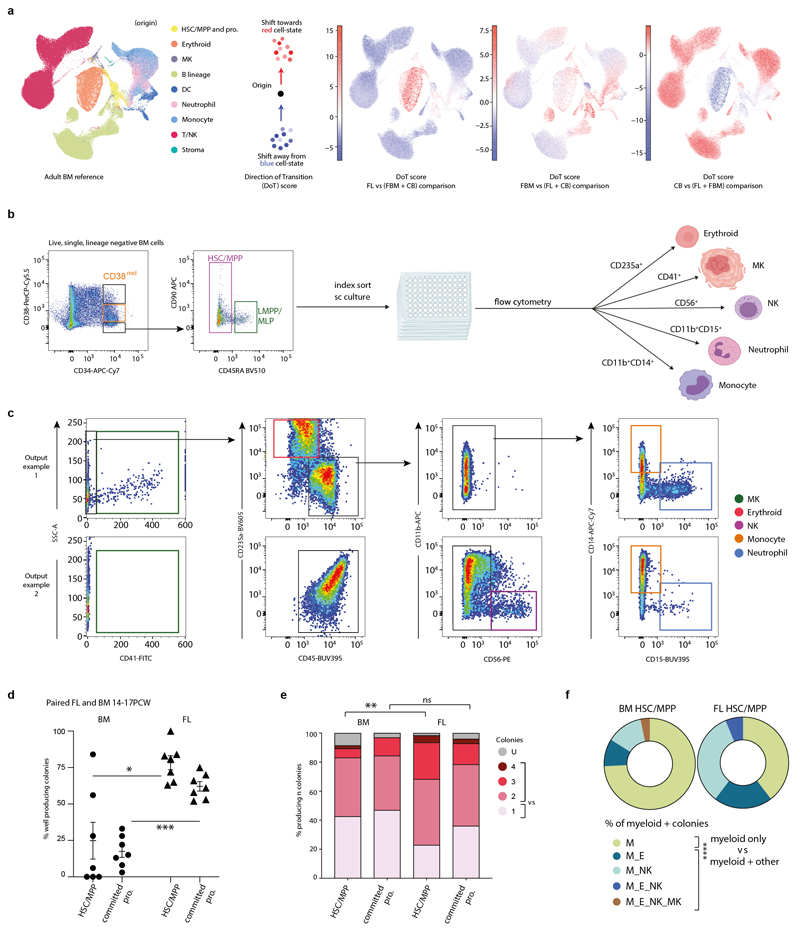
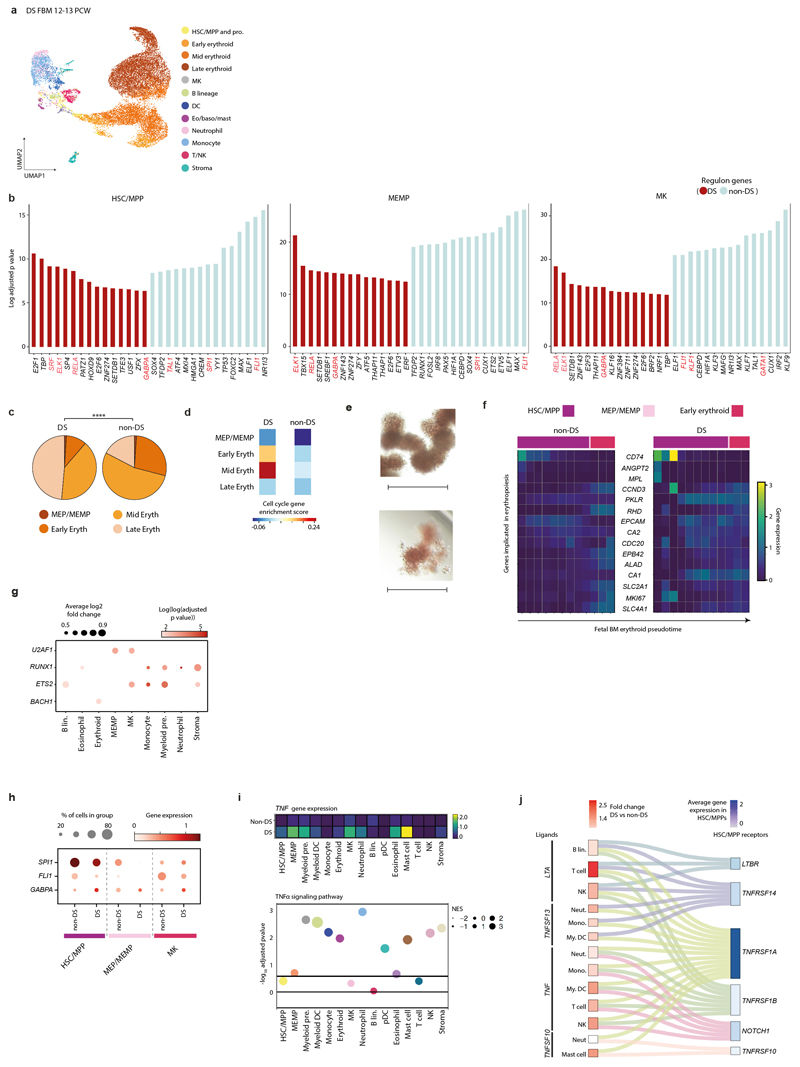
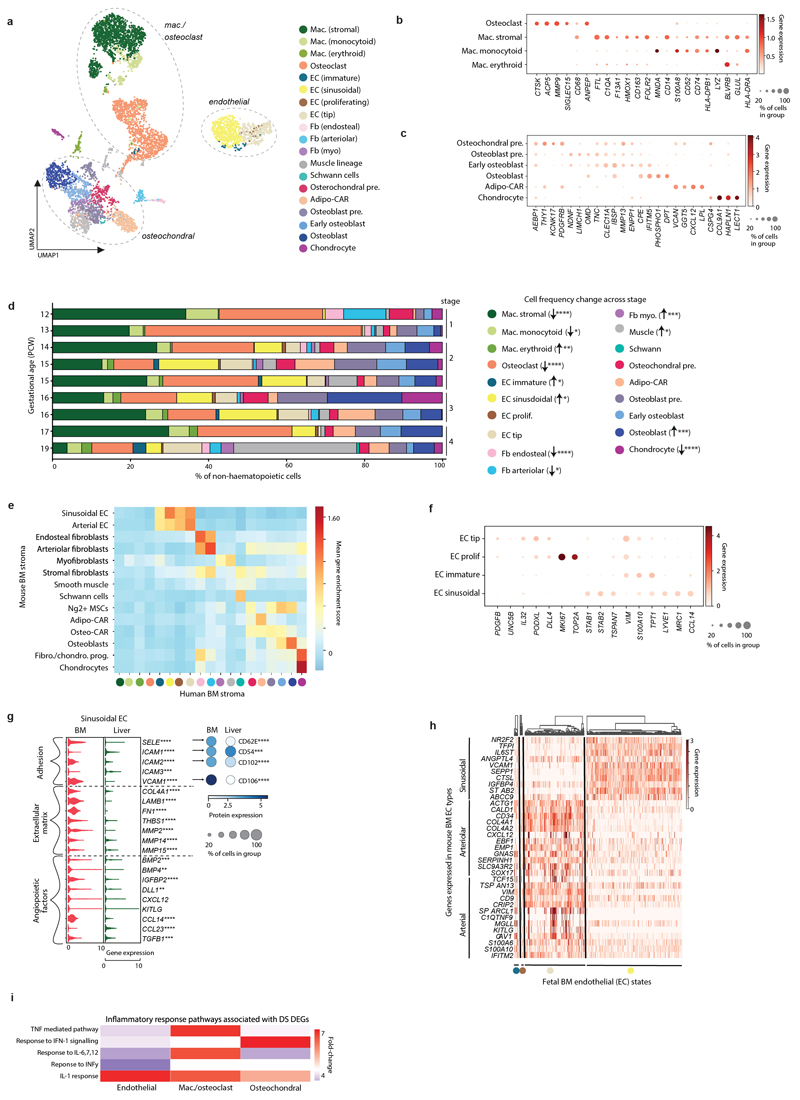
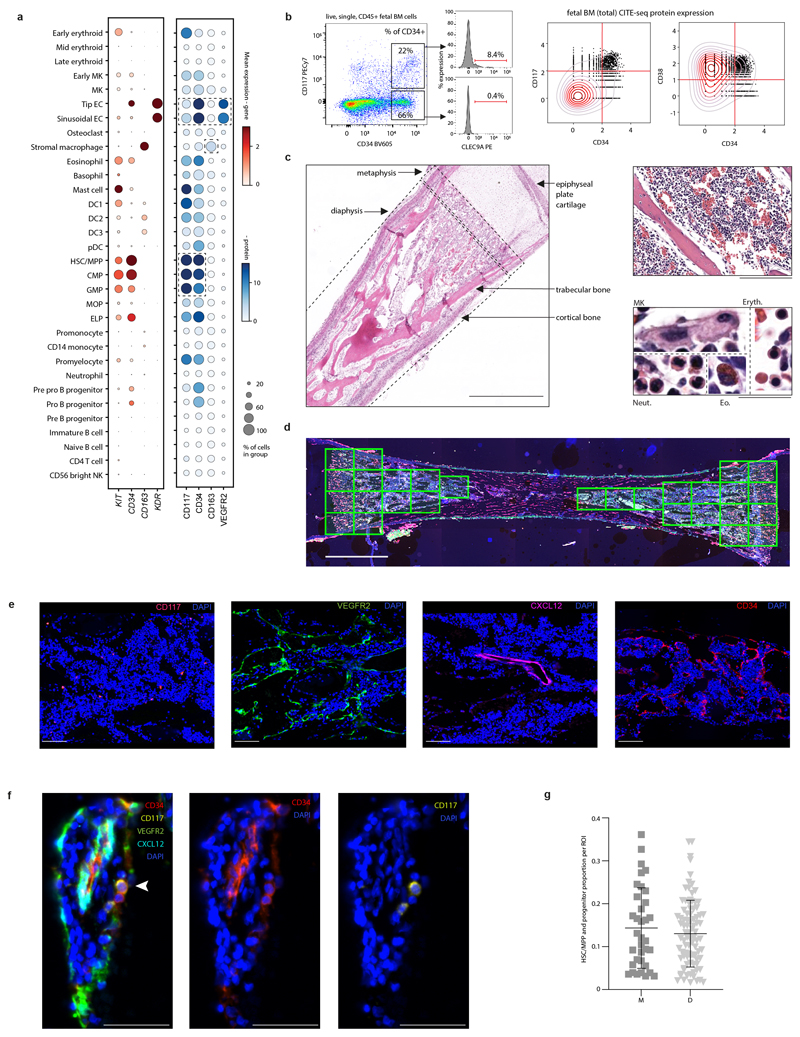
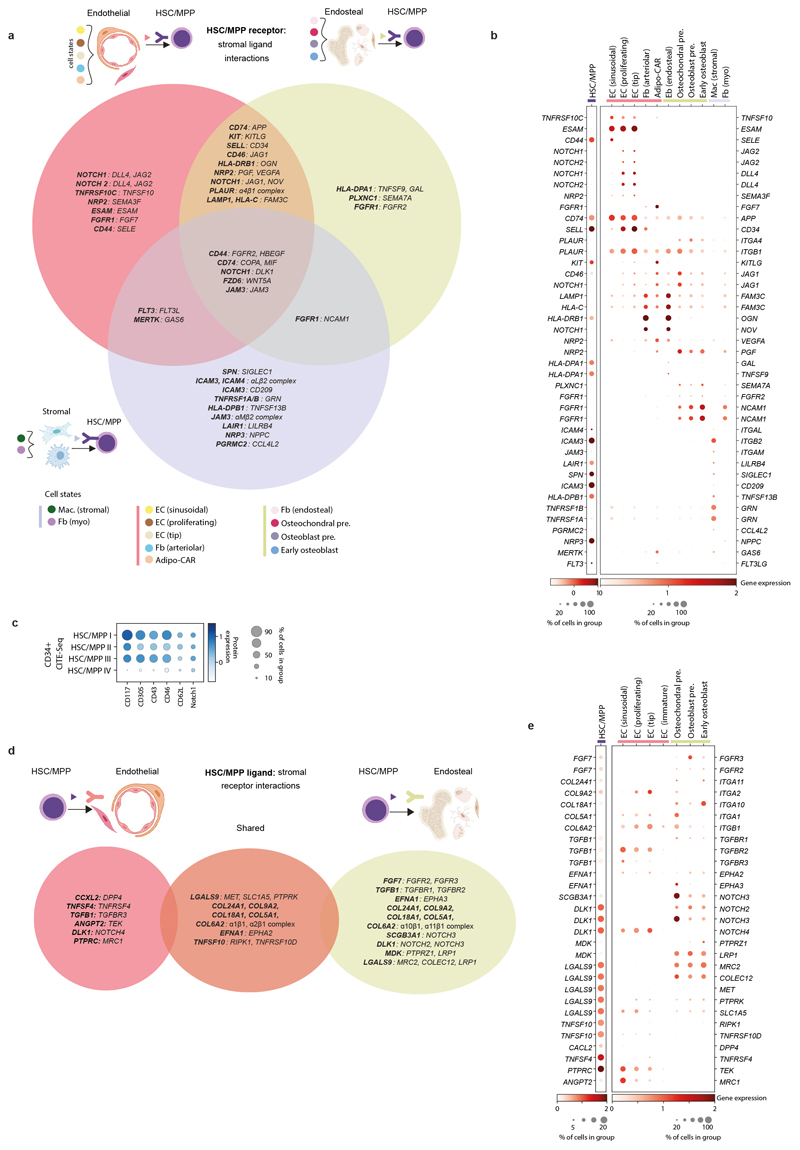
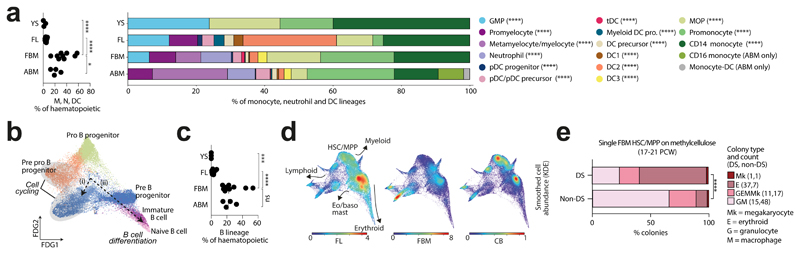
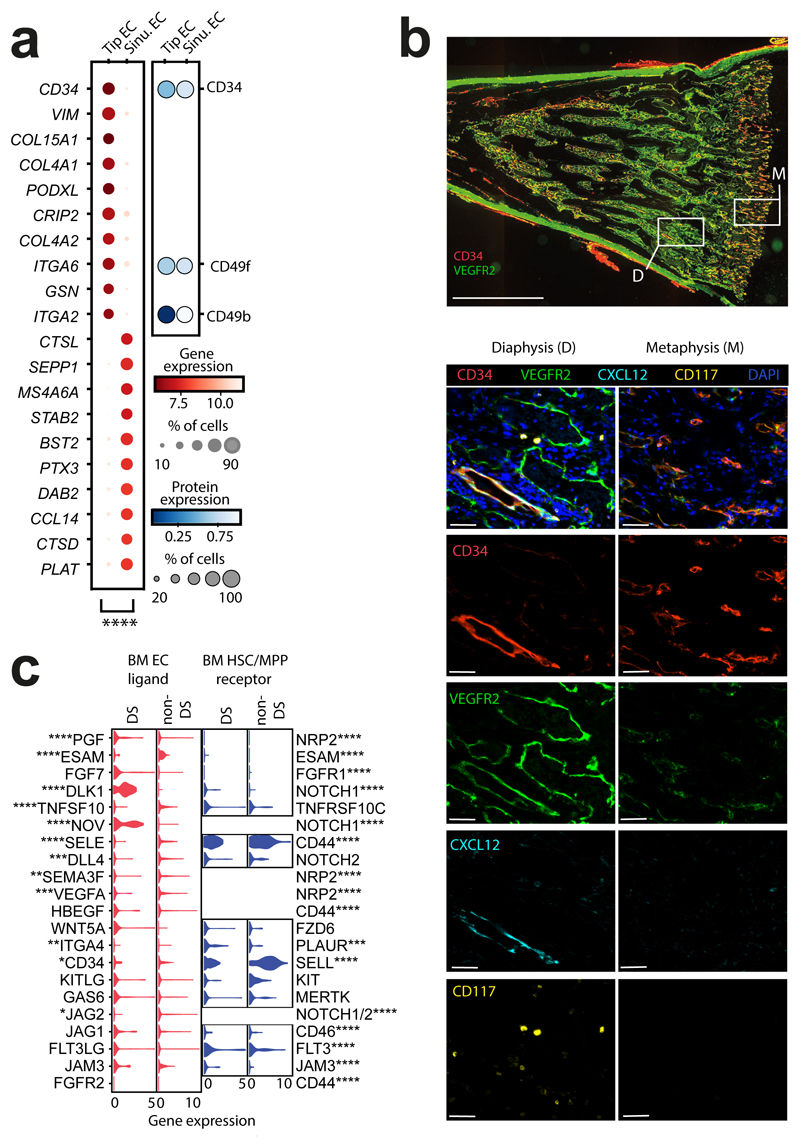
Haematopoiesis in the bone marrow (BM) maintains blood and immune cell production throughout postnatal life. Haematopoiesis first emerges in human BM at 11-12 weeks after conception1,2, yet almost nothing is known about how fetal BM (FBM) evolves to meet the highly specialized needs of the fetus and newborn. Here we detail the development of FBM, including stroma, using multi-omic assessment of mRNA and multiplexed protein epitope expression. We find that the full blood and immune cell repertoire is established in FBM in a short time window of 6-7 weeks early in the second trimester. FBM promotes rapid and extensive diversification of myeloid cells, with granulocytes, eosinophils and dendritic cell subsets emerging for the first time. The substantial expansion of B lymphocytes in FBM contrasts with fetal liver at the same gestational age. Haematopoietic progenitors from fetal liver, FBM and cord blood exhibit transcriptional and functional differences that contribute to tissue-specific identity and cellular diversification. Endothelial cell types form distinct vascular structures that we show are regionally compartmentalized within FBM. Finally, we reveal selective disruption of B lymphocyte, erythroid and myeloid development owing to a cell-intrinsic differentiation bias as well as extrinsic regulation through an altered microenvironment in Down syndrome (trisomy 21).


Conflict of interest statement

Competing Interest statement

S.O.B is now an employee of Becton, Dickinson and Company (BD); S.O.B's contributions to the work were made prior to the commencement of employment at BD. O.R.R. is an employee of Genentech. O.R.R. is a co-inventor on patent applications filed at the Broad related to single cell genomics. All other authors declare no competing interests.

Figures

Extended Data Figure 1
Extended Data Figure 1. A single cell atlas of human FBM
1a) Summary of FBM scRNA-seq dataset and reference scRNA-seq datasets used in this study, including published YS/FL data4 and publicly available CB/ABM data from the Human Cell Atlas Data Coordination Portal. 1b) UMAP of FBM scRNA-seq data (as per Fig. 1a) pre- and post- Harmony batch correction. Sequencing type and sample is represented by colour. 1c) Logistic regression for intersecting cell states annotated in FBM, ABM, CB, and DS FBM scRNA-seq datasets. Prediction probability indicated by colour scale. 1d) Dotplots for expression of selected cell-state defining genes (left) in FBM CITE-seq data where corresponding protein was available in the ADT panel (right). Genes were selected from DE analysis (two-sided Wilcoxon rank-sum statistical test with Benjamini-Hochberg procedure for multiple testing correction; Supplementary Table 12). Markers used for FACS isolation are shown in bold type. Log-transformed, normalised and scaled gene expression values (upper limit 3) and DSB-normalised protein expression values (upper limit 15) are represented by the colour of the dots. Percentage of cells in each cell type expressing the marker is shown by the size of the dot. To contextualise dotplots shown in this panel, DE proteins were independently calculated for the FBM CITE-seq data (Supplementary Table 13), with method as described above for genes. 1e) FACS strategy used to isolate cell types for validation based on cell-state defining markers from scRNA-seq data. Representative plots from n=2 samples (17 PCW) are shown. Gating strategy is described in Methods. 1f) UMAP of FBM SS2 scRNA-seq data (n=2, k=486, 17 PCW; Supplementary Table 15) with a 50-cell per subset sample of predicted 10x scRNA-seq counterparts (n=9, k=600). 10x scRNA-seq data represented by coloured areas and SS2 data represented by dots of equivalent colour.
Extended Data Figure 2
Extended Data Figure 2. A single cell atlas of human FBM
2a) Continuous decision tree constructed using the Rpart package to distinguish between the lineage-committed immune cell types in FBM (total) CITE-seq data using the 198 epitopes detected (see Supplementary Methods). Node splits were labelled ‘lo’ or ‘hi’ for visualisation purposes. The branch rules of the tree operate on continuous protein expression values. 2b) Confusion matrix showing the actual cell type labels and the predicted cell type labels for the decision tree (in panel a) when run on the test data (see Methods). Sensitivity and specificity are illustrated in this heatmap, with complete statistics provided in Supplementary Table 14. Overall accuracy computed with 95% CI using a binomial test and checked with a one-sided test (see caret package documentation for confusionMatrix function).
Extended Data Figure 3
Extended Data Figure 3. Diversification of innate myeloid and lymphoid cells
3a) UMAP of monocyte, DC, neutrophil and macrophage subsets (k=34,318) in the FBM scRNA-seq dataset. 3b) FDG of DC, myeloid progenitor and HSC/MPP subsets (k=5,702) in the FBM scRNA-seq dataset. 3c) Left: Illustration displaying role of SPI1 and CEBPA dosage in influencing monocyte and neutrophil differentiation from GMPs. Right: log-transformed, normalised and scaled expression of CEBPA and SPI1 in GMPs from FL and FBM scRNA-seq datasets. 3d) Heatmap showing gene expression (GEX) for early monocyte and neutrophil commitment markers (two-sided Wilcoxon rank-sum statistical test with Benjamini-Hochberg procedure for multiple testing correction; Supplementary Table 30) in FBM scRNA-seq progenitors. Hierarchical clustering of each cell type shown (see Methods). GEX values are log-transformed, normalised and scaled (upper limit of 3). Sig = signature. 3e) Heatmap showing expression of genes implicated in severe congenital neutropenia (Supplementary Table 31) across FBM scRNA-seq Monocle3-inferred neutrophil pseudotime (DEGs across pseudotime marked with asterisk; one-sided Moran’s I statistical test; Supplementary Tables 32, 33). GEX values are log-transformed, normalised and scaled (upper limit of 1.5). 3f) Heatmap showing gene enrichment (see Methods) of blood DC/monocyte signatures in developing and mature haematopoietic tissues (YS, FL, FBM, ABM). 3g) FDG of NK/ILCs (k=915) in the FBM scRNA-seq dataset. Grey ellipse highlights proliferating cells. 3h) Heatmap showing NK cytotoxicity gene enrichment in NK cell states in YS, FL and FBM (See Methods). Relative enrichment is indicated by colour scale. 3i) Heatmap of predicted TF activity across inferred FBM DC pseudotime (FBM scRNA-seq DC-lineage cell states as input). TF activity inferred using iRegulon and pseudotime calculated using the Scanpy sc.tl.dpt function. GEX normalised to between 0-1 prior to plotting. 3j) Dotplot showing cell state-defining genes for NK and ILCs in the FBM scRNA-seq dataset. Methods/interpretation as in Fig. 1b. 3k) Dotplot showing expression of cell state-defining genes for DC and monocytes in the FBM scRNA-seq dataset. Methods/interpretation as in Fig. 1b. 3l) Dotplot showing expression of cell state-defining genes for myeloid precursors and neutrophils in the FBM scRNA-seq dataset. Methods/interpretation as in Fig. 1b.
Extended Data Figure 4
Extended Data Figure 4. Expanded B-lymphopoiesis in FBM
4a) Dotplot of cell state-defining genes for FBM scRNA-seq B-lineage. Methods/interpretation as in Fig. 1b. Abbreviations as in Fig. 2b. 4b) Barplot for mean proportions of B-lineage cell states in FL (n=14), FBM (n=9) and ABM (n=4) scRNA-seq datasets (n=biologically independent samples; B lineage absent in n=3 YS). P-values resulting from quasibinomial regression model (subject to one-sided ANOVA; with correction for sort gates; computed at 95% CI and adjusted for multiple testing using Bonferroni correction) are shown in parentheses; **p<0.01, ****p<0.0001; Supplementary Table 19, 23). 4c) Violin-plot of DEGs (computed using two-sided Wilcoxon rank-sum statistical test with Benjamini-Hochberg procedure for multiple testing correction; ****=p<0.0001; Supplementary Table 34) across FBM scRNA-seq Pre-B progenitor paths as in Fig. 2b; see Methods). GEX are log-transformed, normalised and scaled. 4d) Barplot showing mean proportion of productive heavy/light chains in FBM B-lineage cells present in both mRNA/BCR-enriched scRNA-seq (n=2, k=5,052). Pie-charts show the proportion of cycling cells (see Methods) per cell-type. 4e) Heatmap of shared clonotypes between FBM B-lineage cell types, as defined by CellRanger. 4f) FDG of B-cell development (k=30,066) in the FBM scRNA-seq dataset. Colour indicates state (left) and Monocle3 pseudotime value (right). Paths as in Fig. 2b. 4g) FDG of B-lineage (k=28,583) in the FBM scRNA-seq dataset. Colour indicates apoptotic gene enrichment score (see Methods/legend). 4h) Heatmap of B-ALL-implicated genes across Monocle3-inferred FBM/ABM B cell development pseudotime (see panel F; Supplementary Tables 32, 35-37; DEGs across pseudotime marked with asterisk; one-sided Moran’s I statistical test). Log-transformed, normalised and scaled GEX (upper limit of 2). 4i) Dotplot comparing expression of characteristic T-cell genes in cell states from thymus and FBM scRNA-seq datasets (see Methods). Interpretation as in Fig. 1b. Abbreviations: ETP = early thymocyte precursor; DN = double negative; DP = double positive. 4j) Barplot of productively rearranged TRA/B/G/D chains by T-cell state in n=4 biologically independent FBM samples at 14-17 PCW, k=194 cells. Chain rearrangements were as defined by CellRanger. Bars show mean and error bars SD. Mean±SD TCR productivity was 97±7%, 90±14% and 96±8% for CD4-T, CD8-T and Treg.
Extended Data Figure 5
Extended Data Figure 5. Tissue-specific properties of HSC/MPP
5a) Violin-plots showing GEX for MEM-, myeloid- and lymphoid- lineage genes in FBM scRNA-seq progenitors. GEX are log-transformed, normalised and scaled. Abbreviations: HSC/MPP = haematopoietic stem cell/ multipotent progenitor; CMP = common myeloid progenitor; eo/baso/mast pre. = eosinophil/basophil/mast cell precursor. 5b) FDG visualisation of CD34+ FBM/FL/CB CITE-seq cells on gene expression landscape (total k=35,273; FBM n=3, k=8,829, 14-17 PCW; FL n=4, k=18,904, 14-17 PCW; CB n=4, k=7,540, 40-42 PCW). Cell type is represented by colour, as shown in legend. HSC/MPP groups refer to unsupervised sub-clusters of the most immature compartment rather than functional MPP subpopulations. Abbreviations: MEP = megakaryocyte erythroid progenitor; MkP = megakaryocyte progenitor; EryP = erythroid progenitor; EoBasoMC = eosinophil/basophil/mast cell progenitor; MyP = myeloid progenitor; LyP = lymphoid progenitor. 5c) Logistic Regression for intersecting cell states in CD34+ CITE-seq data and FBM scRNA-seq data (see Methods). Prediction probability is indicated by colour scale. Cell type abbreviations as shown in panel a and b legend. 5d) Heatmap showing cell-cycle gene enrichment in CD34+ FBM/FL/CB CITE-seq progenitors. Colour indicates relative enrichment. 5e) Dotplot showing expression of genes used for progenitor characterisation in the CD34+ CITE-seq data. Methods/interpretation as in Fig. 1b. 5f) Dotplot showing expression of proteins used for progenitor characterization in CD34+ CITE-seq data. Methods/interpretation as in Extended Data Fig. 1d (protein expression upper limit of 4). 5g) Bar-graph showing proportion of progenitor subsets out of total progenitors in FL (n=4), FBM (n=3) and CB (n=4) CD34+ CITE-seq data (n= biologically independent samples). Proportions are normalised across donors. Bars indicate mean and error bars SD. Cell-type proportions across tissue were tested using a quasibinomial regression model (subject to one-sided ANOVA; with correction for sort gates; computed at 95% CI and adjusted for multiple testing using Bonferroni correction); *=p< 0.05 (Supplementary Table 38). 5h) Dotplot showing expression of protein markers significantly differentially expressed between HSC/MPP across tissues (FL, FBM, CB) in the CD34+ CITE-seq dataset. Top differentially expressed proteins by log(fold change) are shown for each tissue (Supplementary Table 39; two-sided Wilcoxon rank-sum statistical test with Benjamini-Hochberg procedure for multiple testing correction). Methods/interpretation as in Extended Data Fig. 1d.
Extended Data Figure 6
Extended Data Figure 6. Tissue-specific properties of HSC/MPP
6a) Direction of Transition (DoT)-scores computed between CD34+ CITE-seq HSC/MPP1 across tissue (using cross-tissue HSC/MPP1 DEGs as input - see Supplementary Table 40). ABM scRNA-seq was used as reference and the origin point was defined as HSC/MPP (see Methods). Red-coloured cells indicate a shift towards their state (blue colour vice versa). 6b) Sort gates for HSC culture experiments. HSC/MPP, LMPP/MLP and CD34+CD38mid cells were index-sorted for single-cell culture on an MS5 stromal layer, as described in Methods. LMPP/MLP and CD34+CD38mid cells were analysed as ‘committed progenitors’. Abbreviations: LMPP/MLP = lymphoid-primed multipotent progenitor/ multipotent lymphoid progenitor. Figure was created using BioRender.com. 6c) Examples of single-cell HSC culture outputs showing outputs for: i) MK (CD41+), erythroid (CD235a+) and myeloid (CD14+ monocyte and CD15+ neutrophil), ii) NK (CD56+) and myeloid (CD14+ monocyte and CD15+ neutrophil). 6d) Outputs from single-cell culture on MS5 stromal layer for paired FL and FBM HSC/MPPs. Proportion of culture wells producing colonies by cell-type/tissue (assessed by light microscopy under 4x magnification, analysed per plate- k=7 from n=3 biologically independent samples per tissue; lines display mean and error bars SEM). *p=0.011 by 2-sided Mann Whitney test of BM HSC/MPP vs. FL HSC/MPP and ***p=0.0006 BM committed progenitor vs. FL committed progenitor. 6e) Well contents analysed by flow cytometry and number of lineage outputs per well compared between HSC/MPP and committed progenitors from FL vs. FBM. U=colony present but lineage undefinable by this assay. Statistical comparison (binomial test) for unipotential vs. multipotential colonies: HSC/MPP FL vs. FBM *** p=0.0008, 2-sided; committed progenitor FL vs. BM ‘ns’ p=0.27, 2-sided. 6f) Proportion of FL and FBM HSC/MPPs producing myeloid-containing colonies in single-cell culture on MS5 stromal layer (paired FBM and FL from n=2 biologically independent samples). Statistical comparison is of ‘myeloid-only’ vs. ‘myeloid plus other’ in k=77 wells producing myeloid colonies; *** p=0.0001, 2-sided by binomial test. Abbreviations as follows: M = myeloid; E = erythroid; MK = megakaryocyte; NK = natural killer.
Extended Data Figure 7
Extended Data Figure 7. Perturbed haematopoiesis in Down syndrome
7a) UMAP of DS FBM scRNA-seq (n=4, k=16,743, 12-13 PCW) (Supplementary Table 20). Abbreviations as in Fig. 1a. 7b) Top 30 PySCENIC-inferred differentially active TFs in DS vs. non-DS FBM scRNA-seq HSC/MPPs, MEMPs and MKs (Supplementary Tables 7, 20). TFs (red) described in text. 7c) Proportions of erythroid lineage cell states in DS (n=4) and age-matched non-DS FBM scRNA-seq data (n=2, where n=biologically independent samples). **** p<10-15, 2-sided, by Chi-squared test. Abbreviations: eryth = erythroid. 7d) Heatmap showing cell-cycle gene enrichment in DS and age-matched non-DS FBM erythroid lineage cell states. Colour indicates relative enrichment. 7e) Representative images from single-cell HSC/MPP methylcellulose cultures, showing relative erythrocyte colony size/structure in DS (top; n=2 biological independent samples; PCW=17, 19; k=246) and non-DS (bottom; n=3 biologically independent samples; PCW=17, 19, 21; k=365) FBM; scale bar; 400µm. 7f) Heatmap of erythropoiesis-implicated genes across Monocle3-inferred erythroid development pseudotime in DS and non-DS FBM scRNA-seq datasets (all genes shown are DEGs across both pseudotime trajectories; one-sided Moran’s I statistical test; Supplementary Tables 32; 41-42). Log-transformed, normalised and scaled GEX (upper limit of 3). 7g) Dotplot showing chromosome 21 TFs differentially expressed in DS and non-DS FBM scRNA-seq datasets (two-sided Wilcoxon rank-sum statistical test with Benjamini-Hochberg procedure for multiple testing correction; adjusted-p-value=<0.05; Supplementary Table 21). Dot-size = average log2 fold-change in DS expression. Colour = log(log(adjusted-p-value)). 7h) Dotplot showing TFs for differentially active regulons in DS vs. non-DS FBM scRNA-seq (see panel b). 7i) Top: Heatmap showing TNF expression in DS and non-DS FBM scRNA-seq cell states. Bottom: TNFα-signalling pathway enrichment (see Methods, Supplementary Table 43). Dot-size = normalised enrichment score (NES) for TNFα-signalling pathway. Line = ±log10(0.25). 7j) Sankey-plot of putative TNF superfamily interactions in DS FBM scRNA-seq (see Methods; Supplementary Table 44). Fold-change expression in DS relative to non-DS (red scale). Combined expression in DS/non-DS (blue scale).
Extended Data Figure 8
Extended Data Figure 8. Stromal cell heterogeneity in FBM
8a) UMAP of FBM scRNA-seq stromal cells (k=6,287). Dotted lines indicate broad lineages. Abbreviations: mac = macrophage; Fb = fibroblast; pre. = precursor. 8b) Dotplot showing cell state-defining genes for osteoclasts and macrophages in the FBM scRNA-seq dataset. Methods/interpretation as in Fig. 1b. 8c) Dotplot showing cell state-defining genes for osteochondral-lineage cells in the FBM scRNA-seq dataset. Methods/interpretation as in Fig. 1b. 8d) Barplot showing frequency of stromal cell states in FBM scRNA-seq samples. Samples are grouped into 4 developmental stages to facilitate statistical comparison over gestational stage. P-values resulting from quasibinomial regression model (subject to one-sided ANOVA; with correction for sort gates; computed at 95% CI and adjusted for multiple testing using Bonferroni correction) are shown in parentheses; *p < 0.05, **p < 0.01, ***p < 0.001, ****p < 0.0001; Supplementary Table 19, 45). 8e) Heatmap showing gene enrichment (see Methods) of postnatal mouse BM stromal cell signatures in human FBM scRNA-seq stromal cells (coloured as in panel a). 8f) Dotplot showing cell state-defining genes for EC in the FBM scRNA-seq dataset. Methods/interpretation as in Fig. 1b. 8g) Left panel: Violin-plot showing expression of genes with documented role in sinusoidal EC functionin sinusoidal ECs from FBM and FL scRNA-seq datasets. Right panel: Equivalent protein dotplot where marker was present in CD34+ CITE-seq ADT panel. Asterisks indicate DEGs (two-sided Wilcoxon rank-sum statistical test with Benjamini-Hochberg procedure for multiple testing correction; *p<0.05, **p<0.01, ***p<0.001, ****p<0.0001; Supplementary Table 46-47). Methods/interpretation as in Fig. 3a, c (upper limit of 5.5 for protein dotplot). 8h) Heatmap showing expression of mouse BM EC DEGs from Baryawno et al (see Supplementary Methods) in FBM scRNA-seq ECs. GEX values are log-transformed, normalised and scaled (upper limit of 3). Hierarchical clustering for each cell type is shown (see Methods). 8i) Heatmap of differentially enriched inflammatory and cytokine production pathways in DS vs. non-DS FBM scRNA-seq stroma defined by a two-sided Wilcoxon rank-sum test with Benjamini-Hochberg procedure for multiple testing correction; Supplementary Tables 20, 43).
Extended Data Figure 9
Extended Data Figure 9. Stromal cell heterogeneity in FBM
9a) Expression of IF microscopy markers in the FBM (total) CITE-seq dataset; genes (left) and their protein equivalent (right). Methods/interpretation as in Extended Data Fig. 1d (upper limits of 3/15 applied for gene/protein expression). 9b) Left: Scatterplot of CD34 and CD117 co-expression in FBM leukocytes by flow cytometry and expression of CLEC9A in gated fractions (representative from n=2). Right: Scatterplots of CD34, CD38 and CD117 protein expression in the FBM (total) CITE-seq dataset (Supplementary Table 48). Values are ln(DSB-normalised) and scaled to a lower limit of 0. Quadrants denote manual ‘gating’ thresholds (see Methods). Kernel density gradient is overlaid. 9c) Longitudinal section of fetal bone stained with hematoxylin and eosin. Left: location of haematopoietic tissue (10x magnification), scale bar; 1mm. Right top: haematopoietic architecture (20x magnification), scale bar; 200µm. Right bottom: identification of morphologically distinct cell types (50x magnification), scale bar; 20µm. Abbreviations: Eryth. = erythroid Neut. = neutrophil lineage; Eo. = eosinophil. Representative from n=4 samples (14-15 PCW). 9d) Longitudinal section of fetal femur with multiplex IF staining. Yellow boxes = regions of interest. Representative image from n=4 samples (14-15 PCW) at 4x magnification. Scale bar; 3mm. 9e) Sections of fetal femur, each stained with a single primary antibody from the multiplex and co-stained with DAPI. Representative fields of view from n=2 samples (14-15 PCW) at 20x magnification. Scale bars; 100µm. 9f) Identification of HSC/MPP and progenitors as cells co-expressing CD34 and CD117 (white arrow): left = all multiplex channels, middle = CD117 only, right = CD34 only. Representative image at 100x magnification. Replicates as per panel g. Scale bars; 50µm. 9g) Scatterplot showing proportions of CD34+ CD117+ HSC/MPP and progenitors per nucleated cells in metaphyseal (M) versus diaphyseal (D) regions of interest. Bars display mean and error bars SD of 522 HSC/MPP locations across 127 regions of interest in n=4 biologically independent FBM samples (14-15 PCW). Difference in frequency of CD34+CD117+ HSC/MPP and progenitors relative to cellular density was assessed by Wald test (p= 0.431) (Supplementary Table 28).
Extended Data Figure 10
Extended Data Figure 10. Stromal cell heterogeneity in FBM
10a) Summary of receptor-ligand interactions predicted by CellPhoneDB (see Methods) between FBM stromal ligands and HSC/MPP receptors (Supplementary Table 49). Significant putative receptor-ligands across FBM neighbourhoods are indicated in Venn diagram overlapping regions. Figure was created using BioRender.com. 10b) GEX dotplot for FBM scRNA-seq stromal ligands and HSC/MPP receptors with role in CellPhoneDB-predicted receptor-ligand interactions shown in panel a. Methods/interpretation as shown in Fig. 1b (upper limit of 2 for both dotplots). Colours represent grouping of stromal cell types, as in panel a. 10c) Protein dotplot for CD34+ CITE-seq HSC/MPPs receptors with role in CellPhoneDB-predicted receptor-ligand interactions as per panels a-b. Methods/interpretation as in Extended Data Fig. 1f(upper limit of 1.5). 10d) Summary of receptor-ligand interactions predicted by CellPhoneDB between FBM HSC/MPP ligands and stromal receptors (Supplementary Table 49). Interpretation as detailed in panel a, and cell-type groupings detailed in Methods. 10e) GEX dotplot for FBM scRNA-seq stromal receptors and HSC/MPP ligands with role in CellPhoneDB-predicted receptor-ligand interactions shown in panel d. Methods/interpretation as shown in Fig. 1b (upper limit of 20% was placed on the HSC/MPP dotplot and upper limit of 2 was placed on both dotplots).
Figure 1
Figure 1. A single cell atlas of human FBM
1a) UMAP of FBM scRNA-seq data (n=9, k=103,228, 12-19 PCW) by broad categories (Supplementary Table 7). 1b) Gene expression dotplot of cell state-defining genes for broad categories in FBM scRNA-seq data. Dot colour indicates log-transformed, normalised and scaled gene expression value. Dot size indicates the percentage of cells in each category expressing a given gene. 1c) Frequency of broad cell categories in FBM scRNA-seq data. n=9 biologically independent samples are grouped into 4 developmental stages to facilitate statistical comparison over gestational stage. P-values resulting from quasibinomial regression model (subject to one-sided ANOVA; with correction for sort gates; computed at 95% CI and adjusted for multiple testing using Bonferroni correction) are shown in parentheses; *p<0.05, **p<0.01, ****p< 0.0001 (Supplementary Table 18, 19). 1d) Beeswarm plot of log fold-change in abundance between cells in equivalent broad categories in DS (n=4, k=16,743) and aged-matched non-DS FBM scRNA-seq (n=2, k=9,717) from biologically independent samples (Supplementary Tables 7, 20). Coloured dots indicate significant difference in abundance (p-value adjusted for multiple testing >10% FDR) estimated with a two-sided quasi-likelihood test (null hypothesis: no difference in abundance between the two conditions). 1e) Heatmap visualizing number of DEGs between equivalent cell states in DS vs. non-DS FBM scRNA-seq per chromosome, including correction for number of genes per chromosome (two-sided Wilcoxon rank-sum statistical test with Benjamini-Hochberg procedure for multiple testing correction; Supplementary Table 21). 1f) Cytospin images of FBM eosinophils, basophils and neutrophils (n=2 biologically independent samples; both 17 PCW, performed as 2 independent experiments) sorted according to gating strategy in Extended Data Fig. 1 and stained with Giemsa. 100x images were concatenated as shown by dotted lines. Scale bars; 10µm.
Figure 2
Figure 2. Myeloid diversification, B-lineage expansion and tissue-specific properties of HSC/MPP
2a) Left: frequency of monocytes (M), neutrophils (N) and DCs in YS (n=3), FL (n=14), FBM (n=9) and ABM (n=4) scRNA-seq datasets (n=biologically independent samples; line =median; *p<0.05,****p<0.0001 from one-way ANOVA with Tukey’s multiple comparison). Right: mean proportions of cell states within monocyte, neutrophil and DC lineages for above datasets (****p<0.0001 from quasibinomial regression model subject to one-sided ANOVA with 95% CI and Bonferroni correction; Supplementary Table 19,22). 2b) FDG of B-lineage cell states (k=28,583) in FBM scRNA-seq data. Grey ellipses highlight cycling cells. Dashed arrows denote i) cycling Pre B cell and ii) B cell differentiation branches. 2c) Frequency of B-lineage cells in YS, FL, FBM and ABM scRNA-seq datasets (replicates, measures of centre and statistical tests as per 2a; ***p<0.001,****p<0.0001; Supplementary Table 19,23). 2d) FDG visualisation of CD34+ FL (left), FBM (centre), and CB (right) cells on a CITE-seq gene expression landscape (Extended Data Fig. 5b). Colour indicates relative cell abundance per tissue by kernel density estimation (KDE). 2e) Colonies produced by DS (n=2, k=246, k*=64) and aged-matched non-DS (n=3, k=365, k*=73) HSC/MPPs where n=biologically independent samples, k=plated cells and k*=wells producing colonies). Bar graph shows proportions by colony type, with colony numbers provided in brackets. Statistical difference between DS and expected distribution based on non-DS tested by Chi square with **** p<10-15, 2-sided.
Figure 3
Figure 3. Stromal cell heterogeneity in FBM
3a) Left: dotplot of top 10 genes (by p-value) differentially expressed between tip EC (k=362) and sinusoidal ECs (k=550) in FBM scRNA-seq data (n=9) (Methods/interpretation as in Fig. 1b; two-sided Wilcoxon rank-sum test with Benjamini-Hochberg correction; ****=p<0.0001, Supplementary Table 24). Right: dotplot of equivalent protein expression (where antibody present in CITE-seq panel) on tip and sinusoidal ECs in the FBM (total) CITE-seq dataset (n=3). Dot colour indicates DSB-normalised protein expression. Dot size indicates the percentage of cells in each category expressing a given protein. 3b) Top: longitudinal section of fetal femur with multiplex IF staining, showing CD34 (red) and VEGFR2 (green) channels to demonstrate regional differences in BM vasculature between metaphysis (M) and diaphysis (D). Scale bar; 2mm. White boxes locate regions of interest (ROI) shown below. Bottom: ROIs with all channels and single channels to demonstrate patterns of co-expression in CD34hiVEGFRlo metaphyseal vessels, VEGFR2hiCD34hi diaphyseal sinusoids and CD34hiCXCL12-associated arterioles. Scale bars; 50µm. Representative images from n=4 biologically independent FBM samples (14-15 PCW), with staining performed in 2 independent experiments. 3c) Violin-plots of gene expression in HSC/MPPs and pooled ECs from DS (n=4; k=105 HSC/MPPs; k=111 ECs) and non-DS (n=9; k=92 HSC/MPPs; k=938 ECs) FBM scRNA-seq datasets. Genes shown have a significant receptor-ligand interaction in non-DS FBM predicted by CellPhoneDB analysis (detailed in Extended Data Fig. 10a-b). Significance in expression difference between DS and non-DS calculated by two-sided Wilcoxon rank-sum test with Benjamini-Hochberg correction; *p<0.05,**p<0.01,***p<0.001,****p<0.0001; Supplementary Table 25).

References

    1. O’Byrne S, et al. Discovery of a CD10-negative B-progenitor in human fetal life identifies unique ontogeny-related developmental programs. Blood. 2019;134:1059–1071. - PubMed
    1. Charbord P, Tavian M, Humeau L, Péault B. Early ontogeny of the human marrow from long bones: an immunohistochemical study of hematopoiesis and its microenvironment. Blood. 1996;87:4109–4119. - PubMed
    1. Park J-E, et al. A cell atlas of human thymic development defines T cell repertoire formation. Science. 2020;367 - PMC - PubMed
    1. Popescu D-M, et al. Decoding human fetal liver haematopoiesis. Nature. 2019;574:365–371. - PMC - PubMed
    1. Wiemels JL, et al. Prenatal origin of acute lymphoblastic leukaemia in children. Lancet. 1999;354:1499–1503. - PubMed

Publication types