. 2021 Sep 2:19:5059-5071.
doi: 10.1016/j.csbj.2021.08.043. eCollection 2021.

MDM-TASK-web: MD-TASK and MODE-TASK web server for analyzing protein dynamics

Affiliations

MDM-TASK-web: MD-TASK and MODE-TASK web server for analyzing protein dynamics

Olivier Sheik Amamuddy et al. Comput Struct Biotechnol J. .

Abstract

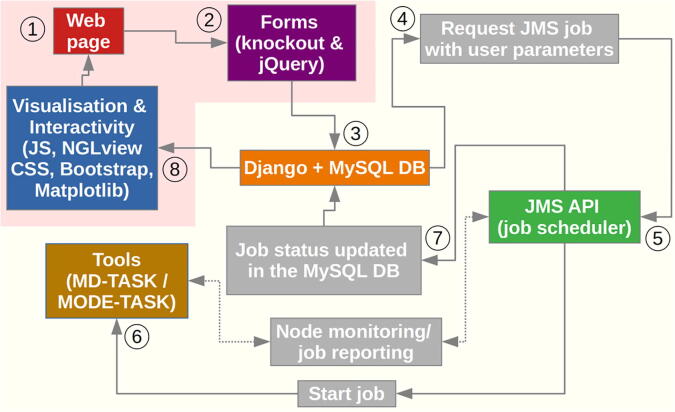
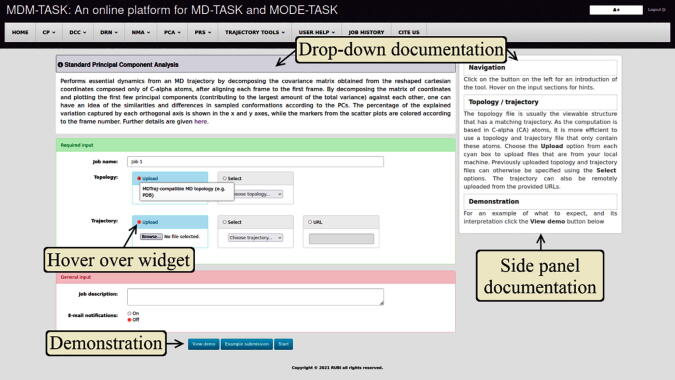
The web server, MDM-TASK-web, combines the MD-TASK and MODE-TASK software suites, which are aimed at the coarse-grained analysis of static and all-atom MD-simulated proteins, using a variety of non-conventional approaches, such as dynamic residue network analysis, perturbation-response scanning, dynamic cross-correlation, essential dynamics and normal mode analysis. Altogether, these tools allow for the exploration of protein dynamics at various levels of detail, spanning single residue perturbations and weighted contact network representations, to global residue centrality measurements and the investigation of global protein motion. Typically, following molecular dynamic simulations designed to investigate intrinsic and extrinsic protein perturbations (for instance induced by allosteric and orthosteric ligands, protein binding, temperature, pH and mutations), this selection of tools can be used to further describe protein dynamics. This may lead to the discovery of key residues involved in biological processes, such as drug resistance. The server simplifies the set-up required for running these tools and visualizing their results. Several scripts from the tool suites were updated and new ones were also added and integrated with 2D/3D visualization via the web interface. An embedded work-flow, integrated documentation and visualization tools shorten the number of steps to follow, starting from calculations to result visualization. The Django-powered web server (available at https://mdmtaskweb.rubi.ru.ac.za/) is compatible with all major web browsers. All scripts implemented in the web platform are freely available at https://github.com/RUBi-ZA/MD-TASK/tree/mdm-task-web and https://github.com/RUBi-ZA/MODE-TASK/tree/mdm-task-web.

Keywords: MD-TASK; MODE-TASK; Molecular dynamics analysis; Normal mode analysis; Residue network analysis.


Conflict of interest statement

The authors declare that they have no known competing financial interests or personal relationships that could have appeared to influence the work reported in this paper.

Figures

Fig. 1
Fig. 1
Workflow for MDM-TASK-web. The flow of execution is numbered, starting with user inputs, and ends with the visualization stage, along the unidirectional arrows. Double-sided arrows denote the two-way communication handled by JMS. Internal processes are shown in gray boxes. Front-end and back-end functionalities are highlighted with a light red and yellowish background, respectively. (For interpretation of the references to color in this figure legend, the reader is referred to the web version of this article.)
Fig. 2
Fig. 2
Example of the MDM-TASK-web interface, showing the embedded sources of documentation. Documentation is mainly embedded within each input page via a drop-down button, on the side panel, as hoverable tool tips and within demonstration pages.
Fig. 3
Fig. 3
Top views of two DRN metrics mapped in two highly drug resistant HIV protease mutants. Averaged BC is shown as a “spacefill” representation in a common color scale for panels (A) and (B); while averaged EC is shown as a “cartoon” representation in panels (C) and (D) – as obtained from MDM-TASK-web. Panel (A) shows a DRV-bound multi-drug (highly) resistant HIV protease, and panel (B) shows another, TPV-bound multi-drug resistant HIV protease, for which DRV is still effective. A color gradient ranging from pale yellow to red in the top and bottom panels, is used to represent low to high centrality values. Non-protein portions are colored blue. The flap residue 54 (numbered 153 in chain B) is circled and highlighted in the top panels, showing the decreased averaged BC in the DRV-susceptible mutant, where the residue had mutated. Panels (C) and (D) make visible inner details of averaged EC at the core of the proteases, hinting at the highly central catalytic aspartate by black arrows. (For interpretation of the references to color in this figure legend, the reader is referred to the web version of this article.)
Fig. 4
Fig. 4
Estimating contact frequencies around a single residue in a single and in multiple protein structures, using HIV protease mutants as example. The locus of interest is displayed at the center in panel (A), and is surrounded by its neighbouring residues. Additionally, the edge thicknesses and labels depict the residue contact frequencies obtained from the MD simulations. In both panels, residues are depicted by the three-letter residue code followed by the residue position, a dot and the chain label. In panel (B), multiple related contacts (gathered from the contact mapping tool) are stacked on top of each other along the y-axis, with their neighbours spanning the x-axis.
Fig. 5
Fig. 5
The coordination propensity calculation shows the variance in the distance between residue pairs in an HIV protease mutant.
Fig. 6
Fig. 6
Pairwise residue correlations from an MD simulation of an HIV protease mutant. Anti-correlated and correlated movements are denoted by negative and positive DCC values, respectively, in the range [−1, 1], while uncorrelated motion has a value of zero.
Fig. 7
Fig. 7
Normal mode analysis using (A) the anisotropic network model obtained from a static viral capsid pentamer, and (B) the MD covariance matrix of an HIV protease mutant. In each case, each arrow is colored by its parent chain. The arrow at each residue denotes both the extent of motion and direction with respect to each of the residue.
Fig. 8
Fig. 8
Representations of conformational sampling from independent MD simulations of (A) a reference and (B) an early pandemic stage mutant of the dimeric SARS-CoV-2 Mpro in the same eigen subspace, using comparative essential dynamics. Dots correspond to individual protein conformations (defined by a selection) and are colored by the time of sampling. The kernel density contour plots [colored from blue (lowest density) through yellow to red (highest density)] only serve as a visual guide for the energy surface, and are independently scaled, based on the respective samples. The red labels are estimates obtained from the k-means algorithm, while the blue ones are obtained from the probability density maxima. (For interpretation of the references to color in this figure legend, the reader is referred to the web version of this article.)
Fig. 9
Fig. 9
Application of PRS to scan for residues associated with the conformational shift from a closed to an opened flap conformation in HIV protease. The front (A) and (B) top views of the protease are shown, with an arrow depicting the protease flaps. The correlation mappings default to the range [0, 1], with a color gradient ranging from yellow to dark red, but can also be scaled to the range of the observed correlations by clicking on the “Min-max scaling” option when signals have a narrower range.
Fig. 10
Fig. 10
Benchmarking of the performance of MDM-TASK-web DRN metrics evaluated using triplicate MD simulations of dimeric HIV protease. Each panel shows the time taken for each of the metrics, namely the averaged (A) BC, (B) CC, (C) DC, (D) EC, (E) ECC, (F) KC, (G) L and (H) PR, for increasing protein sizes.
Fig. 11
Fig. 11
Reproducibility of the MDM-TASK-web DRN metrics. Probability density plots for each of the averaged network centrality metrics were evaluated from triplicate MD simulations of dimeric HIV protease, using varying residue contact cut-off radii (rc = 6, 6.7 and 7 Angstroms). Each metric is labeled along the x-axis in each of the panels (A) to (H). A cut-off value of 6 Angstroms tends to produce more divergent results.

References

    1. Golbeck J. Newnes; 2013. Analyzing the social web.
    1. Chakrabarty B., Naganathan V., Garg K., Agarwal Y., Parekh N. NAPS update: network analysis of molecular dynamics data and protein–nucleic acid complexes. Nucleic Acids Res. 2019;47:W462–W470. doi: 10.1093/nar/gkz399. - DOI - PMC - PubMed
    1. Yan W., Yu C., Chen J., Zhou J., Shen B. ANCA: A web server for amino acid networks construction and analysis. Front Mol Biosci. 2020;7:1–8. doi: 10.3389/fmolb.2020.582702. - DOI - PMC - PubMed
    1. Contreras-Riquelme S, Garate J-A, Perez-Acle T, Martin AJM, RIP-MD: a tool to study residue interaction networks in protein molecular dynamics, PeerJ. 6 (2018) e5998. https://doi.org/10.7717/peerj.5998. - PMC - PubMed
    1. Ribeiro A.S.T., Ortiz V. MDN: A web portal for network analysis of molecular dynamics simulations. Biophys J. 2015;109:1110–1116. doi: 10.1016/j.bpj.2015.06.013. - DOI - PMC - PubMed

LinkOut - more resources