. 2021 May 27;6(3):e10226.
doi: 10.1002/btm2.10226. eCollection 2021 Sep.

Cell stiffness predicts cancer cell sensitivity to ultrasound as a selective superficial cancer therapy

Affiliations

Cell stiffness predicts cancer cell sensitivity to ultrasound as a selective superficial cancer therapy

Eden Bergman et al. Bioeng Transl Med. .

Abstract

We hypothesize that the biomechanical properties of cells can predict their viability, with Young's modulus representing the former and cell sensitivity to ultrasound representing the latter. Using atomic force microscopy, we show that the Young's modulus stiffness measure is significantly lower for superficial cancer cells (squamous cell carcinomas and melanoma) compared with noncancerous keratinocyte cells. In vitro findings reveal a significant difference between cancerous and noncancerous cell viability at the four ultrasound energy levels evaluated, with different cell lines exhibiting different sensitivities to the same ultrasound intensity. Young's modulus correlates with cell viability (R 2 = 0.93), indicating that this single biomechanical property can predict cell sensitivity to ultrasound treatment. In mice, repeated ultrasound treatment inhibits tumor growth without damaging healthy skin tissue. Histopathological tumor analysis indicates ultrasound-induced focal necrosis at the treatment site. Our findings provide a strong rationale for developing ultrasound as a noninvasive selective treatment for superficial cancers.

Keywords: AFM measurements; mechanical properties of cancer cells; noninvasive therapy; selective cancer therapy; superficial cancer; ultrasound.


Conflict of interest statement

J. K. is an inventor on a U.S. patent application 14/198,701 on low intensity ultrasound therapy of hyperproliferative diseases and disorders. The authors declare no other conflict of interests.

Figures

FIGURE 1
FIGURE 1
Cellular stiffness is associated with sensitivity to ultrasound treatment. (a) Atomic force microscopy (AFM) deflection measurement experimental set‐up: (1) Side view illustration of AFM deflection measurement. (2) Up view of the Cal33 cancer cell line during AFM measurement (optical microscope, bright‐field mode, ocular magnification 10×, objective magnification 10×, for total magnification 100×). (b) AFM analysis: A representative example of a deflection–force–distance plot for noncancerous HaCaT cells using MATLAB analysis based on the Hertz model: (Curve a) hard, nondeformable surface (glass); (Curve b) HaCaT cell. (c) Calculated Young's modulus values for different types of superficial cancerous (Cal33 and A375) and noncancerous (HaCaT) cells at 37°C. Error bars indicate SEM. Each dot is the mean of three measurements at different areas on the same cell (60 force–distance curves total). Statistical significance was calculated using one‐way ANOVA test, *p < 0.05, ****p < 0.0001. (d) Confocal images of different types of superficial cancerous and noncancerous cells with F‐actin labeled in red and the nucleus labeled in blue: (1) HaCaT (keratinocytes); (2) Cal33 (squamous cell carcinoma of the head and neck [HNSCC]); and (3) A375 (melanoma)
FIGURE 2
FIGURE 2
Effect of ultrasound exposure on cell viability in vitro. (a) Experimental setup: (1) Cell seeding in a 12‐well plate in a set order; (2) ultrasound plate horn set‐up (20 kHz). (b) Cell viability of noncancerous keratinocytes cells (HaCaT) compared with superficial squamous cell carcinoma of the head and neck (HNSCC) cells (Cal33) under ultrasound conditions of 0.139–0.164 W/cm2 intensity, 20 or 40 s application times, and a 50% duty cycle. The table shows the statistical significance calculated using two‐way ANOVA in terms of the energy level row factor, the cell viability column factor, and the interaction between them, where *p < 0.05, **p < 0.01, ***p < 0.001, ****p < 0.0001, and ns indicates a nonsignificant result. (c) Cell viability of various superficial cancer cell lines in vitro under ultrasound conditions of 0.139 W/cm2 intensity, 20 s application time, and a 50% duty cycle. Statistical significance was calculated using one‐way ANOVA test, with p values as per panel (b). (d) The correlation between cell viability and average Young's modulus for noncancerous and cancerous cells from various lines (red line) and for solely the cancerous cell lines (blue line) after their exposure to ultrasound under conditions of 0.139 W/cm2 intensity, 20 s application time, and 50% duty cycle
FIGURE 3
FIGURE 3
Ultrasound treatment delays tumor progression in vivo. (a) The effect of ultrasound on normal skin: (1) Visual view of NOD/SCID mouse skin after ultrasound exposure; (2) hematoxylin and eosin (H&E) histological analysis of mouse skin following exposure to ultrasound (12.3 W/cm2 intensity, 3 min application time, and a 50% duty cycle). (b) The in vivo procedure. (c) Effect on tumor volume of ultrasound treatment every other day over 15 days using three different ultrasound intensities for 1 min on a 50% duty cycle. (d) Effect of ultrasound intensity on squamous cell carcinoma of the head and neck (HNSCC) tumors. (1) Tumor mass measurements, 15 days after the treatment groups were first exposed to ultrasound, using three different intensities for 1 min on a 50% duty cycle. (2) Florescent scanning of Cal33‐green fluorescent protein (GFP) histological sections (GFP labeled green, nucleus labeled blue) for (a) the control group; (b) following ultrasound treatment at 12.3 W/cm2 every other day for 15 days. (3) GFP fluorescent signal analysis (using the ImageJ program) of the control group and a treatment group exposed to an ultrasound intensity of 12.3 W/cm2 after 15 days of treatment. Statistical significance was calculated using t test, **p < 0.01
FIGURE 4
FIGURE 4
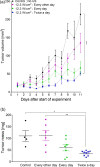
The effect of repeated ultrasound treatment on squamous cell carcinoma of the head and neck (HNSCC) tumor growth. (a) Tumor volume change in the control group (no ultrasound exposure) compared with groups treated with ultrasound (1 min operation time at 12.3 W/cm2 intensity and a 50% duty cycle) for 11 days on different treatment repetition schedules: ultrasound exposure every other day; once a day; or twice a day. (b) Tumor mass measurements 11 days after the treatment groups were first exposed to ultrasound. Statistical significance was calculated using one‐way ANOVA test *p < 0.05, **p < 0.01, ***p < 0.001, ****p < 0.0001
FIGURE 5
FIGURE 5
Representative images of hematoxylin and eosin (H&E) histological sections of Cal33 tumors and their morphological analysis. (a) Untreated and (b) treated tumor sections (1) 48 h and (2) 11 days after the first application of ultrasound to the treatment group. The necrotic area is indicated by a black outline. The treatment group received ultrasound treatment twice a day (1 min operation time at an intensity of 12.3 W/cm2 on a 50% duty cycle). Insets: ImageJ or CaseView images used for morphological analysis indicating the characteristics of necrosis
FIGURE 6
FIGURE 6
Ultrasound treatment‐induced necrosis in tumors: (a) Effect of ultrasound treatment (1 min operation time at 12.3 W/cm2 intensity and on a 50% duty cycle) on the necrotic area as a percentage of total tumor area (AON%) in groups treated according to different treatment repetition schedules compared with the control group, measured: (1) 48 h and (2) 11 days after first ultrasound application to the treatment groups. (b) (1) Tumor kinetics in the control group and in the treatment groups after 48 h (red) and 11 days (blue) of a twice a day ultrasound treatment schedule; and (2) two‐way ANOVA comparing the two treatment durations in terms of the energy level row factor, the cell viability column factor, and the interaction between them, where **p < 0.01, ***p < 0.001, ****p < 0.0001, and ns indicates a nonsignificant result

References

    1. Weaver VM. Mechanics, malignancy, and metastasis: the force journey of a tumor cell. Cancer Metastasis Rev. 2009;28:113‐127. 10.1007/s10555-008-9173-4.Mechanics. - DOI - PMC - PubMed
    1. Burridge K, Monaghan‐Benson E, Graham DM. Mechanotransduction: from the cell surface to the nucleus via RhoA. Philosophical Transactions of the Royal Society B. 2019;374(1779):3‐5. 10.1098/rstb.2018.0229. - DOI - PMC - PubMed
    1. Jonietz E. Mechanics: the forces of cancer. Nature. 2012;491(7425):S56‐S57. 10.1038/491s56a. - DOI - PubMed
    1. Salbreux G, Charras G, Paluch E. Actin cortex mechanics and cellular morphogenesis. Trends Cell Biol. 2012;22(10):536‐545. 10.1016/j.tcb.2012.07.001. - DOI - PubMed
    1. Mandal K, Asnacios A, Goud B, Manneville JB. Mapping intracellular mechanics on micropatterned substrates. Proc Natl Acad Sci U S A. 2016;113(46):E7159‐E7168. 10.1073/pnas.1605112113. - DOI - PMC - PubMed

LinkOut - more resources