

The Epidemiology of Adult Tracheostomy in the United States 2002-2017: A Serial Cross-Sectional Study
- PMID: 34589711
- PMCID: PMC8437212
- DOI: 10.1097/CCE.0000000000000523
The Epidemiology of Adult Tracheostomy in the United States 2002-2017: A Serial Cross-Sectional Study
Abstract
Describe the longitudinal national epidemiology of tracheostomies performed in acute care hospitals and describe the annual rate of tracheostomy performed for patients with respiratory failure with invasive mechanical ventilation.
Design: Serial cross-sectional study.
Setting: The 2002-2014 and 2016-2017 Healthcare Utilization Project's National Inpatient Sample datasets.
Patients: Discharges greater than or equal to 18 years old, excluding those with head and neck cancer or transferred from another hospital. We used diagnostic and procedure codes from the International Classification of Diseases, 9th and 10th revisions to define cases of respiratory failure, invasive mechanical ventilation, and tracheostomy.
Interventions: None.
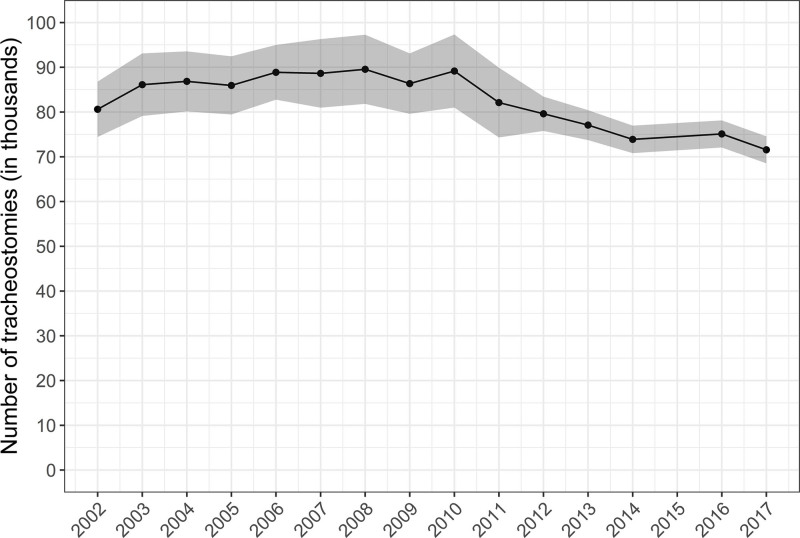
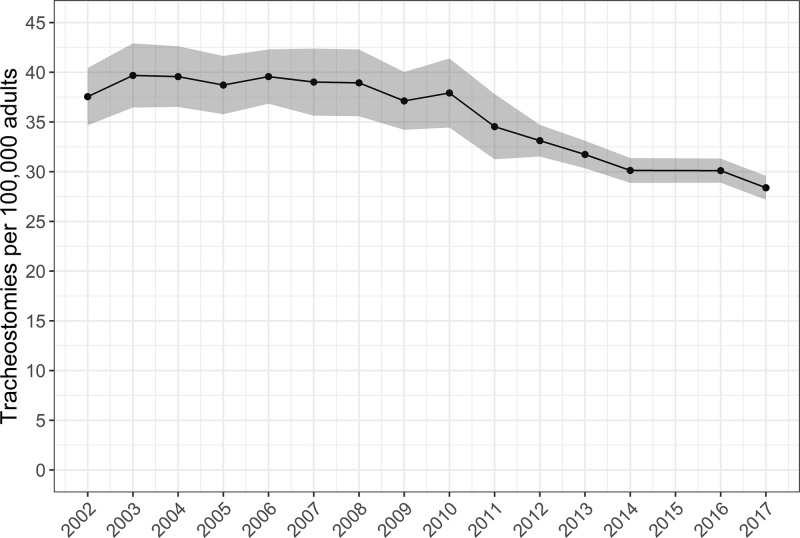
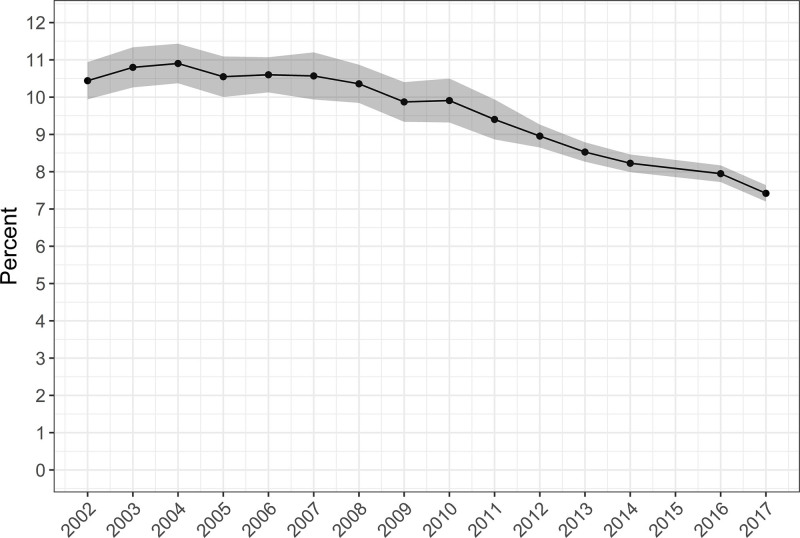
Measurements and main results: There were an estimated 80,612 tracheostomies performed in 2002, a peak of 89,545 tracheostomies in 2008, and a nadir of 58,840 tracheostomies in 2017. The annual occurrence rate was 37.5 (95% CI, 34.7-40.4) tracheostomies per 100,000 U.S. adults in 2002, with a peak of 39.7 (95% CI, 36.5-42.9) in 2003, and with a nadir of 28.4 (95% CI, 27.2-29.6) in 2017. Specifically, among the subgroup of hospital discharges with respiratory failure with invasive mechanical ventilation, an annual average of 9.6% received tracheostomy in the hospital. This changed over the study period from 10.4% in 2002, with a peak of 10.9% in 2004, and with a nadir of 7.4% in 2017. Among respiratory failure with invasive mechanical ventilation discharges with tracheostomy, the annual proportion of patients 50-59 and 60-69 years old increased, whereas patients from 70 to 79 and greater than or equal to 80 years old decreased. The mean hospital length of stay decreased, and in-hospital mortality decreased, whereas discharge to intermediate care facilities increased.
Conclusions: Over the study period, there were decreases in the annual total case volume and adult occurrence rate of tracheostomy as well as decreases in the rate of tracheostomy among the subgroup with respiratory failure with invasive mechanical ventilation. There is some evidence of changing patterns of patient selection for in-hospital tracheostomy among those with respiratory failure with invasive mechanical ventilation with decreasing proportions of patients with advanced age.
Keywords: epidemiology; health services research; respiratory failure; tracheostomy.
Copyright © 2021 The Authors. Published by Wolters Kluwer Health, Inc. on behalf of the Society of Critical Care Medicine.
Conflict of interest statement
Dr. Martin received research support from the National Institutes of Health’s National Center for Advancing Translational Science (UL1 TR-002378) and the Marcus Foundation and has served as a consultant for Grifols, Inc. Dr. Kempker received support from the Agency for Healthcare Quality and Research (K08HS025240) and has received consulting fees from Grifols, Inc. The remaining authors have disclosed that they do not have any conflicts of interest.
Figures
References
-
- Barrett ML, Smith MW, Elixhauser A, et al. : Utilization of intensive care services, 2011: Statistical brief #185. In: Healthcare Cost and Utilization Project (HCUP) Statistical Briefs. Rockville, MD, Agency for Healthcare Research and Quality (US); 2014 - PubMed
-
- Cheung NH, Napolitano LM: Tracheostomy: Epidemiology, indications, timing, technique, and outcomes. Respir Care. 2014; 59:895–915 - PubMed
Grants and funding
LinkOut - more resources
Full Text Sources
