. 2021 Sep 30:10:e69222.
doi: 10.7554/eLife.69222.

First-principles model of optimal translation factors stoichiometry

Affiliations

First-principles model of optimal translation factors stoichiometry

Jean-Benoît Lalanne et al. Elife. .

Abstract

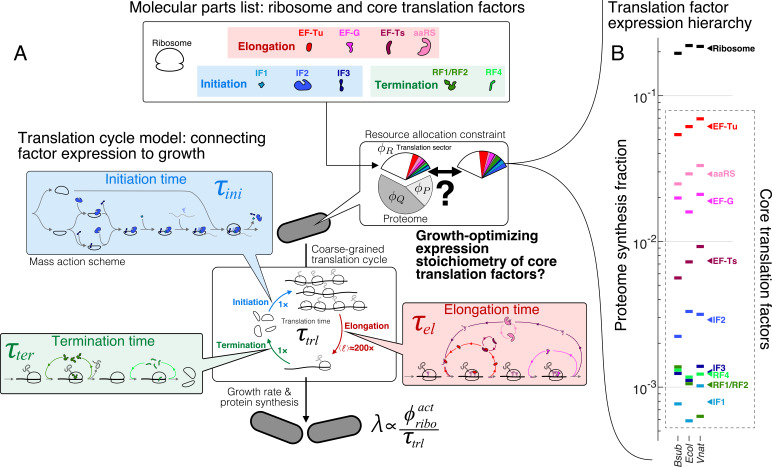
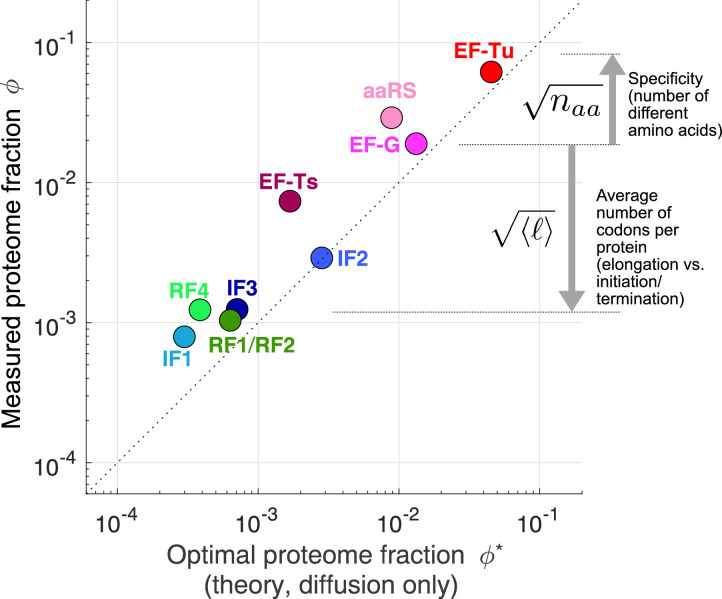
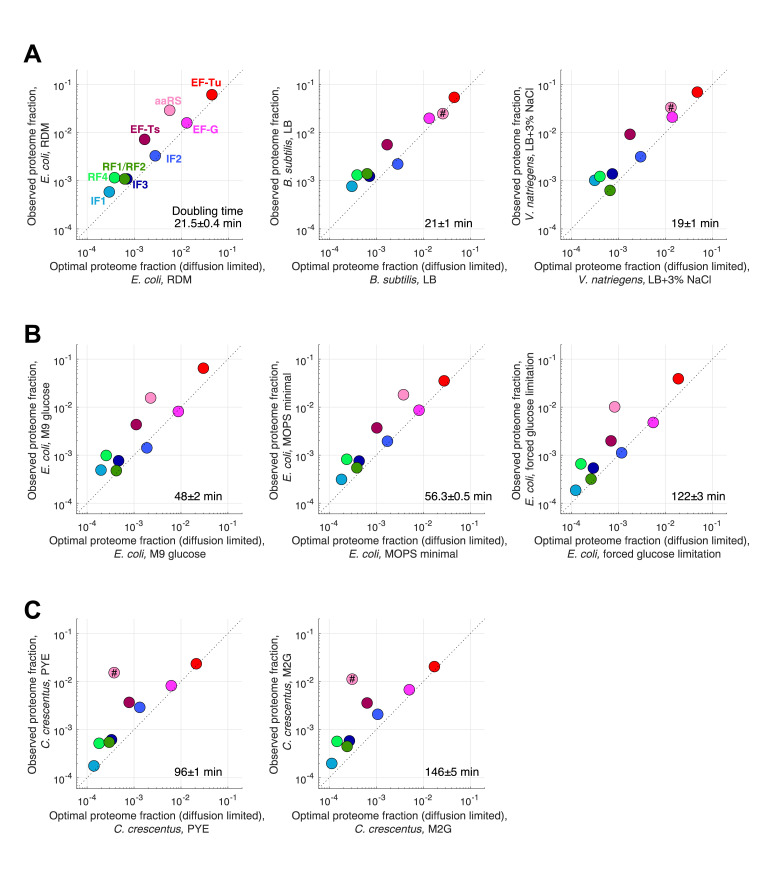
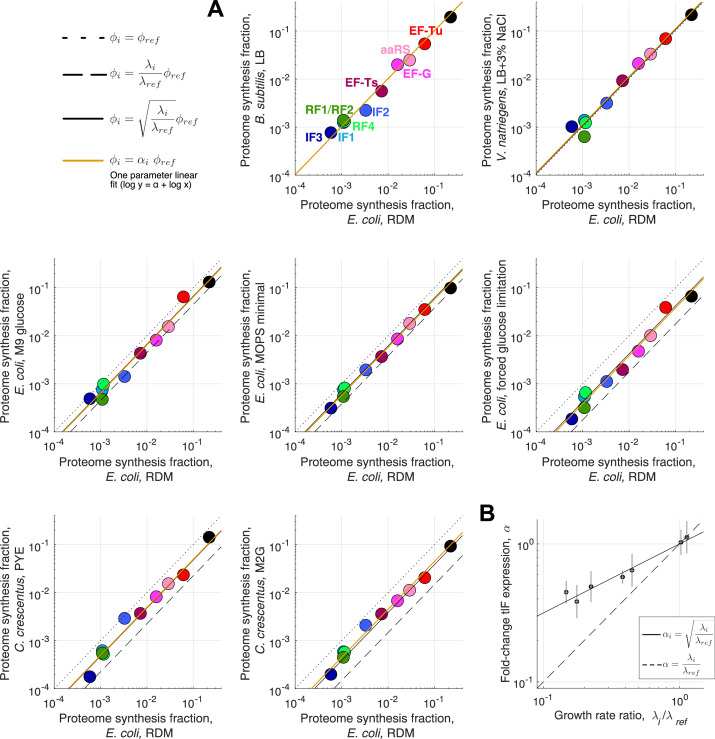
Enzymatic pathways have evolved uniquely preferred protein expression stoichiometry in living cells, but our ability to predict the optimal abundances from basic properties remains underdeveloped. Here, we report a biophysical, first-principles model of growth optimization for core mRNA translation, a multi-enzyme system that involves proteins with a broadly conserved stoichiometry spanning two orders of magnitude. We show that predictions from maximization of ribosome usage in a parsimonious flux model constrained by proteome allocation agree with the conserved ratios of translation factors. The analytical solutions, without free parameters, provide an interpretable framework for the observed hierarchy of expression levels based on simple biophysical properties, such as diffusion constants and protein sizes. Our results provide an intuitive and quantitative understanding for the construction of a central process of life, as well as a path toward rational design of pathway-specific enzyme expression stoichiometry.

Keywords: B. subtilis; E. coli; computational biology; expression stoichiometry; mRNA translation factors; physics of living systems; predictive model; systems biology.


Conflict of interest statement

JL, GL No competing interests declared

Figures

Figure 1.
Figure 1.. The hierarchy of mRNA translation factor expression stoichiometry.
(A) Multiscale model relating translation factor expression to growth rate. The growth rate λ is directly proportional to the active ribosome content (ϕriboact) in the cell and inversely proportional to the average time to complete the translation cycle τtl, consisting of the sum of the initiation (τini), elongation (τel), and termination (τter) times. Each of these reaction times are determined by the translation factor abundances. On average, the elongation step is repeated around 200× to complete a full protein, compared to 1 × for initiation and termination. Our framework of flux optimization under proteome allocation constraint addresses what ribosome and translation factor abundances maximize growth rate. (B) Measured expression hierarchy of bacterial mRNA translation factors, conserved across evolution. Horizontal bars mark the proteome synthesis fractions as measured by ribosome profiling (Lalanne et al., 2018) (equal to the proteome fraction by weight for a stable proteome) for key mRNA translation factors in B. subtilis (Bsub), E. coli (Ecol), and V. natriegens (Vnat) and are color-coded according to the protein (or group of proteins) specified. Triangles (◂) on the right indicate the mean synthesis fraction of the protein in the three species. See Table 1 for a short description of the translation factors considered. Synthesis fractions in (B) can be found in Supplementary file 1.
Figure 2.
Figure 2.. Case study with translation termination.
(A) Coarse-grained translation termination scheme. (B) Illustration of the minimization of effective proteome fraction corresponding to peptide chain release factors, leading to the equipartition principle.
Figure 3.
Figure 3.. Case study with elongation factors (EF-Tu/aaRS).
(A) Schematic of the translation elongation scheme, with the tRNA cycle, involving aminoacyl-tRNA synthetases (aaRS) and EF-Tu. Reactions with a # have their association rate constants rescaled by a factor of naa-11/20 through our coarse-graining to a single codon model. Greyed out cycles (EF-Ts and EF-G) can be solved in isolation (Appendix 3, sections Optimal EF-Ts abundance and Optimal EF-G abundance). (B) Exploration of the aaRS/EF-Tu expression space from numerical solution of the elongation model (Appendix 3, section Optimal EF-Tu and aaRS abundances). The transition line (orange) marks the boundary between the EF-Tu limited and aaRS limited regimes. Left panel shows the ternary complex concentration (which is closely related to the elongation rate, Equation 10). The ternary complex concentration is scaled by the dissociation constant KTC to the ribosome A site (see Equation 39). Middle panel shows the free charged tRNA fraction. Right panel shows the free EF-Tu fraction (ϕTuGTP denotes the proteome fraction of EF-Tu GTP that can bind to charged tRNAs to form the ternary complex). The star marks the optimal solution, as described in the text.
Figure 3—figure supplement 1.
Figure 3—figure supplement 1.. Geometrical interpretation of the sharpness of the separation of the aaRS limited and EF-Tu limited regimes.
Geometrical interpretation of the sharpness of the separation of the aaRS limited and EF-Tu limited regimes. Each graph corresponds to a different combination of aaRS and EF-Tu abundance. The solution for ϕTC (yellow circle) corresponds to the intersection of the full (tRNA budget minus TC concentration and ribosome bound tRNAs) and dashed (all remaining tRNA contributions) black lines. Red and pink lines correspond to the free uncharged and charged tRNAs respectively. Because of the rapid divergence of the free charged tRNA term (red) at ϕTC=ϕTu, the system shifts from being limited by aaRS-limited (pink line intersecting full black line) to being EF-Tu limited (red line intersect full black line) over a very narrow range in aaRS or EF-Tu expression change. The central graph corresponds to the abundance of EF-Tu and aaRS matched (no unbound charged tRNAs or EF-Tu), and falls on the transition line of Figure 3.
Figure 4.
Figure 4.. Predicted optimal abundance (no catalytic contribution, kcat) versus observed abundance.
Measured proteome fractions are the average of E. coli, B. subtilis, V. natriegens (Lalanne et al., 2018). We note that given the sensitivity of the optimal aaRS abundance on the total tRNA/ribosome ratio (visually: yellow star’s position in Figure 3B moves rapidly along x-axis upon changes in plateau of transition line), the prediction for aaRS should be interpreted with caution. Data and predicted values can be found in Supplementary file 1 and 2.
Figure 4—figure supplement 1.
Figure 4—figure supplement 1.. Measured and predicted proteome fraction for core translation factors in individual conditions.
Measured (ribosome profiling) and predicted (diffusion-limited estimates) proteome fraction for core translation factors in individual conditions corresponding to different ribosome profiling datasets included in our analysis (see Supplementary files 1–4). Doubling time for each condition is indicated. (A) Individual fast growing species (see Figure 4 for the average). (B) Slower growth conditions in E. coli. (C) C. crescentus datasets. Predictions of aaRS in species other than E. coli are marked by # to indicate that we used E. coli tRNA abundance measurements from Dong et al., 1996 to make prediction for this tlF these other species.
Figure 4—figure supplement 2.
Figure 4—figure supplement 2.. Expression stoichiometry of core translation factors in different species and at different growth rates.
Expression stoichiometry of core translation factors in different species and at different growth rates. (A) Comparison of measured (ribosome profiling) proteome fraction for core translation factors across different species and growth conditions (same conditions as Figure 4—figure supplement 1). All conditions are compared to the E. coli RDM dataset (reference: ref, condition of interest: i). Dotted line correspond to ϕi=ϕref, dashed line to ϕi=(λi/λref)ϕref and full black line to ϕi=λi/λrefϕref (the parameter free prediction from the binding-limited regime of the model, optimal abundance λ). Orange line corresponds to the one parameter fit logϕi=αi+logϕref (excluding aaRS, not expected to follow the square root scaling, and ribosomes), corresponding to the scaling of all factor’s abundance. (B) Best one-parameter fit αi (scale factor) from (A) as a function of the growth rate ratio λi/λref. Square root scaling: full line. Linear scaling: dashed line. Uncertainties on the growth ratio are propagated from uncertainties of the respective growth rates. Uncertainties in αi are 95% confidence interval from the linear fits in (A).
Appendix 2—figure 1.
Appendix 2—figure 1.. Coarse-grained translation termination scheme with three stop codons and RF1/RF2.
Appendix 3—figure 1.
Appendix 3—figure 1.. Coarse-grained reaction scheme for a single step (amino acid incorporation) of translation elongation.
Tu: EF-Tu, Ts: EF-Ts, G: EF-G, aaRS: aminoacyl tRNA synthetases. Steps with slower rates as a result of the coarse-graining to one effective codon are marked by #.
Appendix 3—figure 2.
Appendix 3—figure 2.. Graphical illustration of the sum (Equation 27).
Left: codon usage (vertical, from analysis of ribosome profiling data from Li et al., 2014), tRNA-codon specificity (matrix, from Björk and Hagervall, 2014, with different amino acids outlined with different colors), and tRNA abundance (horizontal, from Dong et al., 1996) organized by amino acid. Right: product matrix.
Appendix 4—figure 1.
Appendix 4—figure 1.. Simplified kinetic scheme for translation initiation.
Reactions in dashed box correspond to sub-system solved in detail first (section Sub-pathway without subunits joining). Variables are labeled on the scheme.

References

    1. Agirrezabala X, Frank J. Elongation in translation as a dynamic interaction among the ribosome, tRNA, and elongation factors EF-G and EF-Tu. Quarterly Reviews of Biophysics. 2009;42:159–200. doi: 10.1017/S0033583509990060. - DOI - PMC - PubMed
    1. Andersen GR, Nissen P, Nyborg J. Elongation factors in protein biosynthesis. Trends in Biochemical Sciences. 2003;28:434–441. doi: 10.1016/S0968-0004(03)00162-2. - DOI - PubMed
    1. Baggett NE, Zhang Y, Gross CA. Global analysis of translation termination in E. coli. PLOS Genetics. 2017;13:e1006676. doi: 10.1371/journal.pgen.1006676. - DOI - PMC - PubMed
    1. Bakshi S, Siryaporn A, Goulian M, Weisshaar JC. Superresolution imaging of ribosomes and RNA polymerase in live Escherichia coli cells. Molecular Microbiology. 2012;85:21–38. doi: 10.1111/j.1365-2958.2012.08081.x. - DOI - PMC - PubMed
    1. Belliveau NM, Chure G, Hueschen CL, Garcia HG, Kondev J, Fisher DS, Theriot JA, Phillips R. Fundamental limits on the rate of bacterial growth and their influence on proteomic composition. Cell Systems. 2021;12:924–944. doi: 10.1016/j.cels.2021.06.002. - DOI - PMC - PubMed

Publication types

Associated data