. 2021 Oct;374(6563):eabf3066.
doi: 10.1126/science.abf3066. Epub 2021 Oct 1.

A protein interaction landscape of breast cancer

Affiliations

A protein interaction landscape of breast cancer

Minkyu Kim et al. Science. 2021 Oct.

Abstract

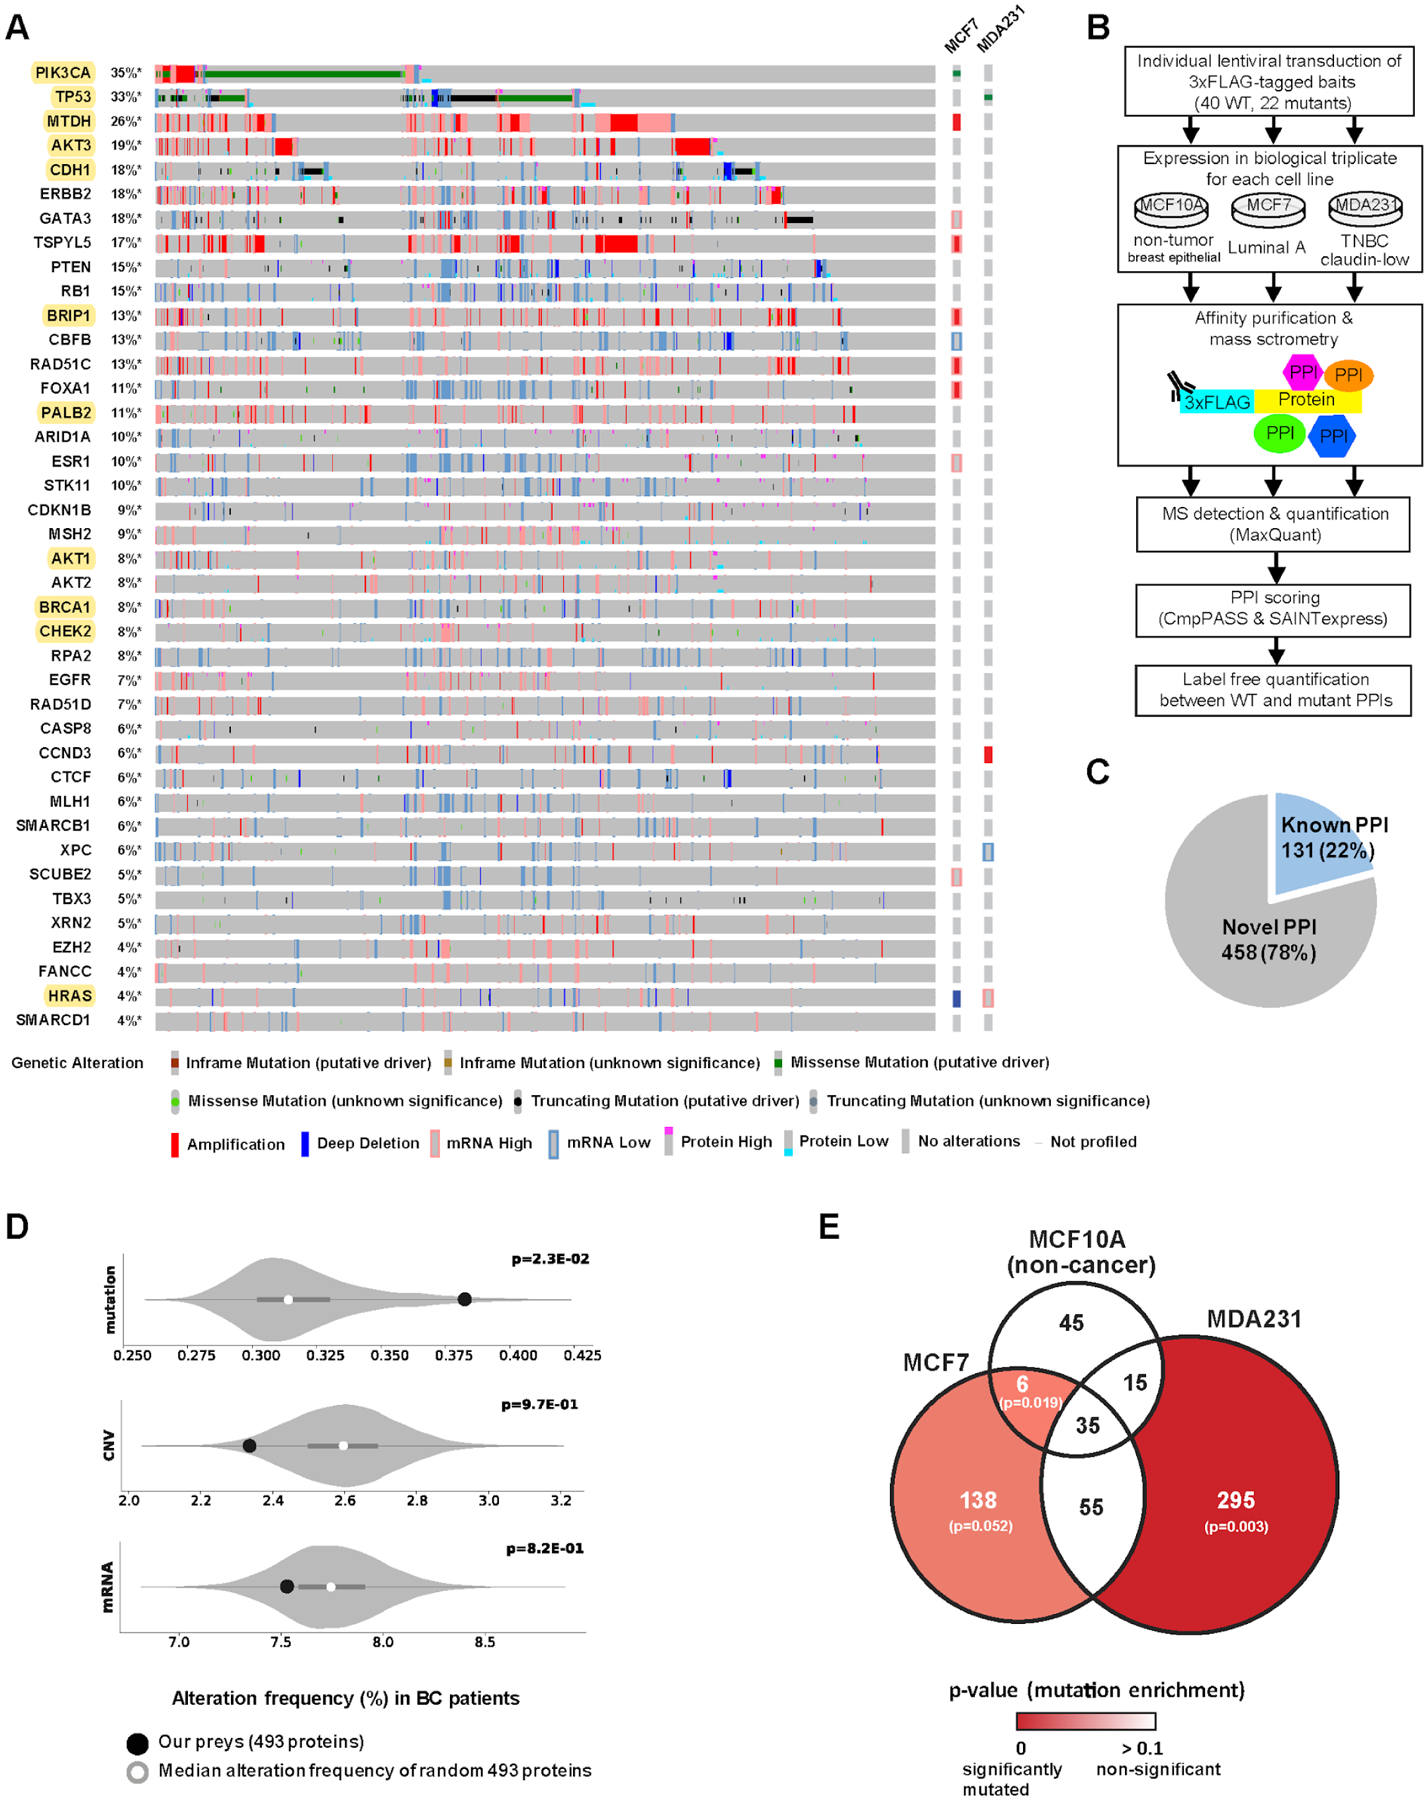
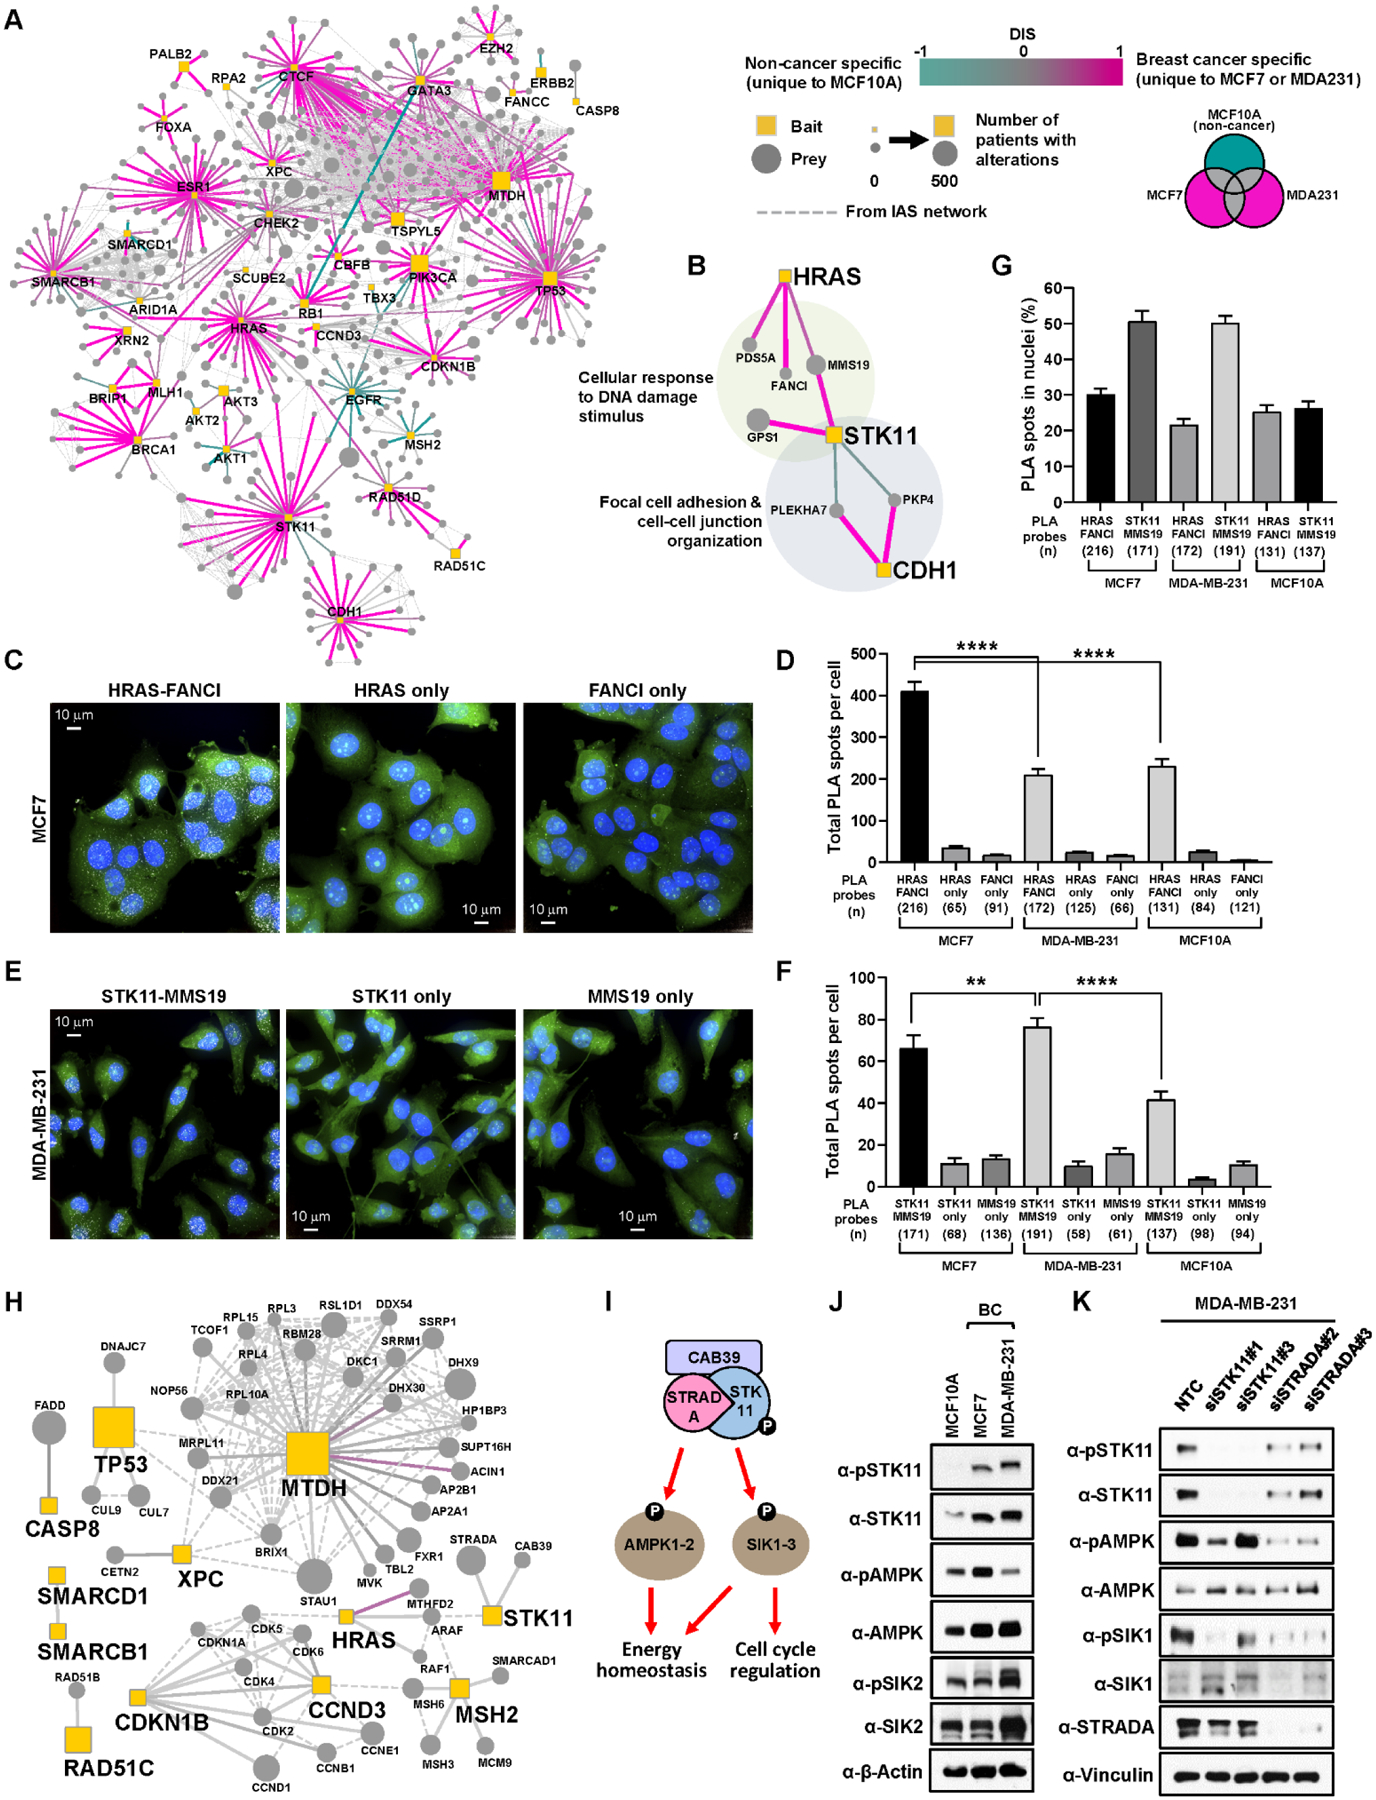
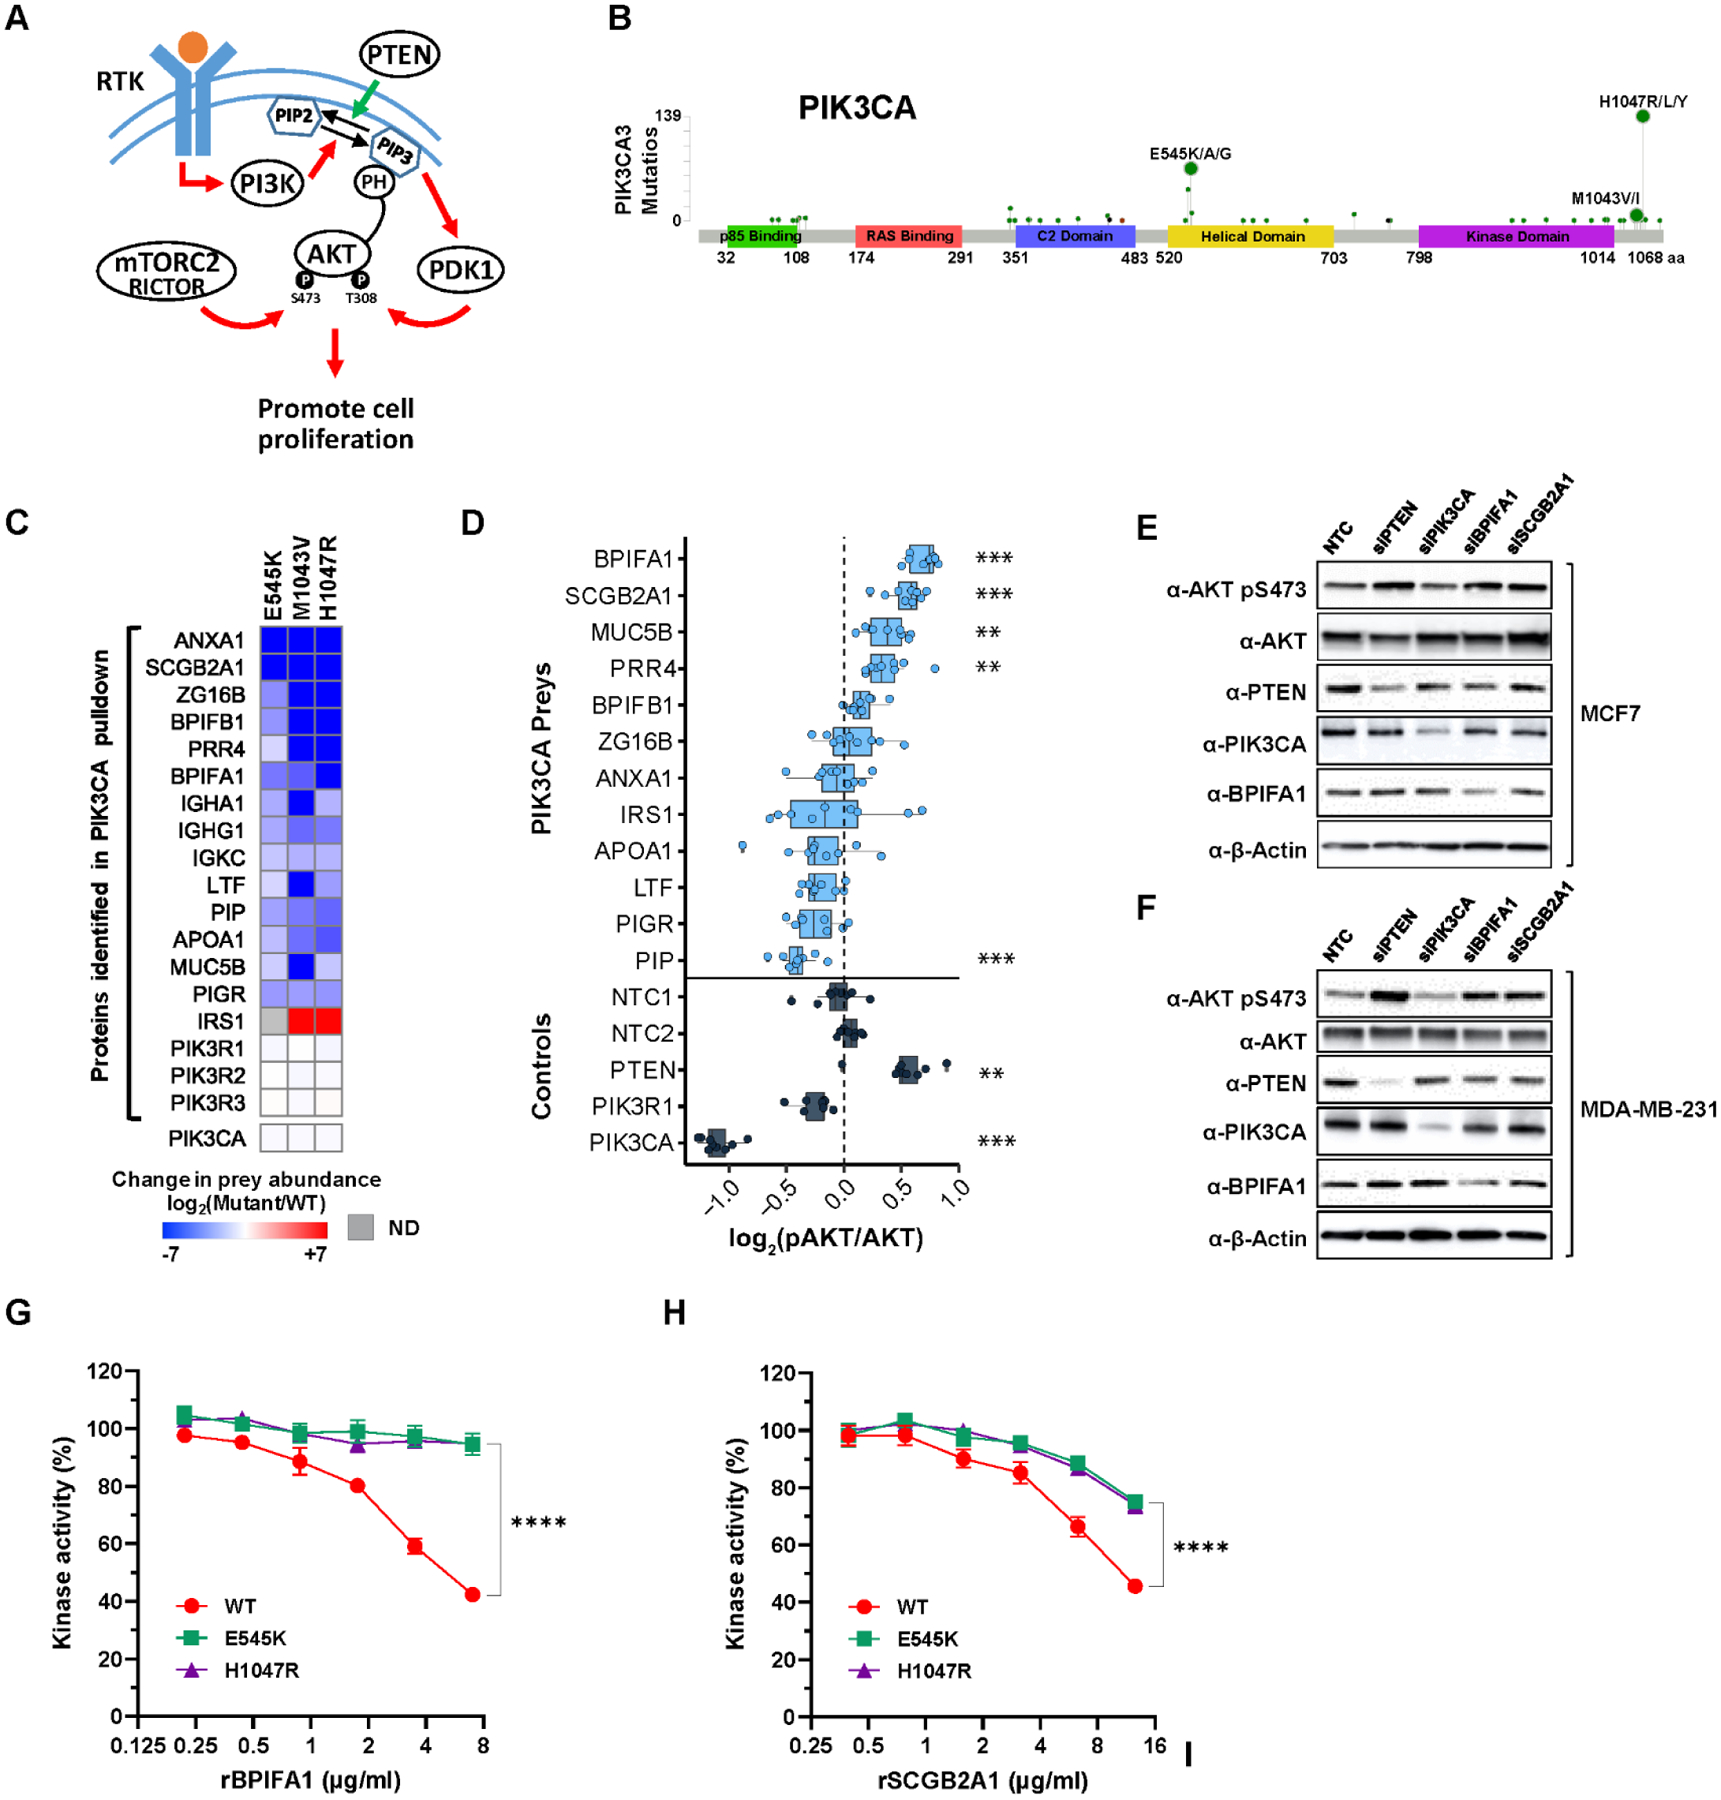
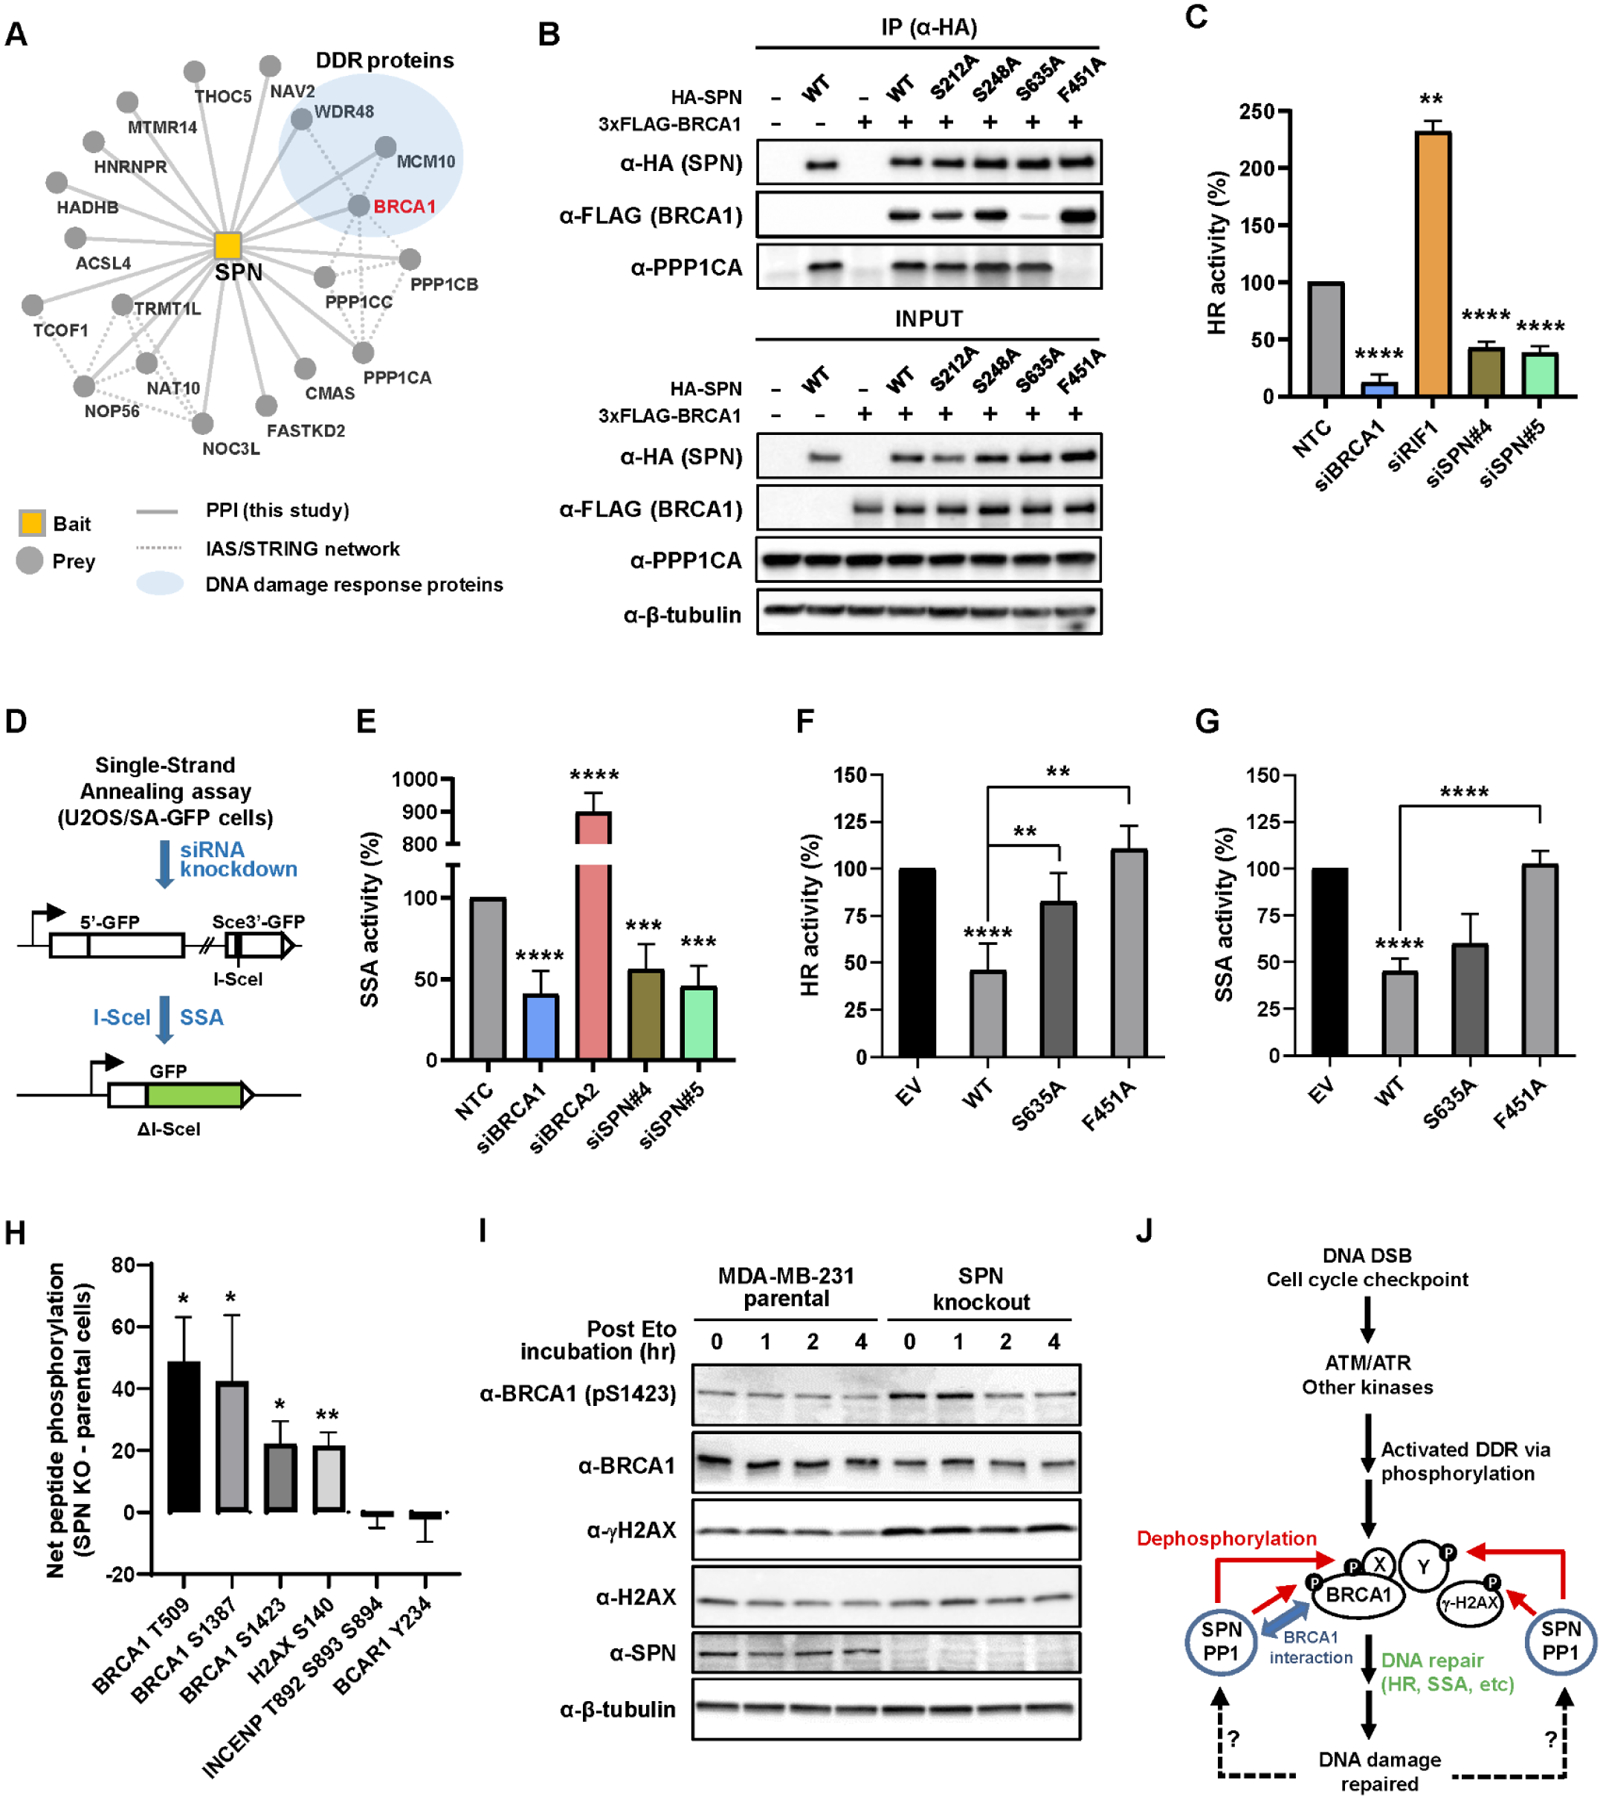
Cancers have been associated with a diverse array of genomic alterations. To help mechanistically understand such alterations in breast-invasive carcinoma, we applied affinity purification–mass spectrometry to delineate comprehensive biophysical interaction networks for 40 frequently altered breast cancer (BC) proteins, with and without relevant mutations, across three human breast cell lines. These networks identify cancer-specific protein-protein interactions (PPIs), interconnected and enriched for common and rare cancer mutations, that are substantially rewired by the introduction of key BC mutations. Our analysis identified BPIFA1 and SCGB2A1 as PIK3CA-interacting proteins, which repress PI3K-AKT signaling, and uncovered USP28 and UBE2N as functionally relevant interactors of BRCA1. We also show that the protein phosphatase 1 regulatory subunit spinophilin interacts with and regulates dephosphorylation of BRCA1 to promote DNA double-strand break repair. Thus, PPI landscapes provide a powerful framework for mechanistically interpreting disease genomic data and can identify valuable therapeutic targets.


Figures

Figure 1.
Figure 1.. Overview of protein-protein interaction mapping in breast epithelial cells
(A) The gene alteration frequencies from the breast invasive carcinoma (TCGA Firehose Legacy) dataset for the 40 genes selected as AP-MS baits in this study. Each vertical grey column represents a patient, such that various genetic alterations of 40 genes in a given patient are indicated as seen at the bottom. In total, 93% (1028 out of 1108) of BC patients have non-synonymous mutation, chromosomal copy-number alteration (CNA), or mRNA/protein expression alteration in one or more of these 40 genes. Genes analyzed for both wild-type and mutant proteins are highlighted in yellow. Existing gene alterations in MCF7 and MDA-MB-231 are shown on the right. (B) The experimental workflow in which each bait was expressed in biological triplicate in 3 cell lines and subjected to AP-MS analysis. (C) Majority (78%) of the high-confidence PPIs identified in this study are not represented in a panel of public PPI databases (CORUM, BioPlex 2.0, IMEx and BioGRID low throughput & multivalidated). (D) The frequency of non-synonymous mutations, chromosomal CNVs, or mRNA expression alterations of 10,000 random size-matched permutations taken from the list of genes detected in the global protein abundance analysis. The white circle indicates the median of the random sampling, and the grey bar represents ±1 standard deviation. The frequency of alterations found in the prey retrieved in our PPI dataset is indicated in the black circle. (E) Venn diagram illustrating the overlap of PPIs (PPI score ≥ 0.9) across the 3 cell lines. PPI score is an average of the PPI confidence scores calculated from compPASS and SAINTexpress (see methods for details). The frequency of non-synonymous mutations of the prey genes in each sector of the Venn diagram was compared to those of 10,000 random size-matched permutations as in (D). The p-values for mutation enrichment in each prey set were shown in a color scale, where a stronger red represents more significant mutation enrichment.
Figure 2.
Figure 2.. Differential interaction analysis of the BC-enriched interactome.
(A) Interactome of the union of all high-confidence PPIs detected across all cell lines. Edges are colored based on their differential interaction, with pink edges representing PPIs that are enriched to BC cell lines (unique to either MDA-MB-231 or MCF7) as compared to MCF10A cells (shown in teal edges). Dotted line represents the physical protein-protein association (validated in other studies) with high Integrated Association Stringency score. (B) PPIs connecting HRAS, STK11, and CDH1. HRAS and STK11 have several interactors including FANCI and MMS19 in BC cells involved in cellular response to DNA damage stimulus. STK11 and CDH1 interact with PKP4 and PLEKHA7 in a cell type-specific manner, implying differential regulation of cell adhesion and cell-cell junction in non-BC and BC cells. (C) Representative images of MCF7 cells from the PLA between HRAS and FANCI antibodies. Maximum intensity projection images are shown to represent total PLA interactions. PLA with only one of the two primary antibodies was performed as negative control. PLA spots (white), HCS CellMask Green stain (Green) and DAPI (blue). Scale bar = 10 μm. (D) Total PLA spots per cell using HRAS and FANCI antibodies were quantified in MCF7, MDA-MB-231, and MCF10A cells. n= total number of cells analyzed in each condition. **** p-value ≤ 1.0×10⁻⁴. (E) Representative images of MDA-MB-231 cells from the PLA between STK11 and MMS19 antibodies. (F) Total PLA spots per cell using STK11 and MMS19 antibodies were quantified in MCF7, MDA-MB-231, and MCF10A cells. **** p-value ≤ 1.0×10⁻⁴, ** p-value ≤ 1.0×10⁻². (G) Percent nuclear PLA spots in each PLA condition. (H) High-confidence PPIs that are commonly detected only in two cancer cell lines (MDA-MB-231 and MCF7) but not in non-cancerous MCF10A cells. Node and edge styles and colors as seen in A. (I) STK11 forms a heterotrimeric complex with CAB39 and STRADA to activate its kinase activity and phosphorylate downstream kinases including AMPK and SIKs for regulating energy homeostasis and cell cycle. (J) STK11 kinase activity was monitored by measuring total and phosphorylation levels of its known downstream substrates (AMPK and SIK2) as well as itself. The following phospho-epitopes were detected by antibodies: pSTK11 (pS428), pAMPKα (pT172), pSIK2 (pT175). (K) Knockdown of STK11 and its interacting protein (STRADA) by two individual small-interfering RNAs reduces phosphorylation of STK11 (S428), AMPK (T172), and SIK1 (T182).
Figure 3.
Figure 3.. Comparative interactome analysis of WT and mutant PIK3CA proteins.
(A) Overview of the receptor tyrosine kinase (RTK)-PI3K signaling cascade leading to the phosphorylation (T308 and S473) and activation of the AKT pathway. (B) A lollipop plot representing the sites of PIK3CA mutations and the number of BC patients bearing a given PIK3CA mutation from TCGA (Firehose Legacy) study. (C) Relative quantification of the abundance of high-confidence preys observed from pull-down of PIK3CA (WT and mutants) in MCF7 cells. Preys detected only in WT are represented in deep blue while preys detected only in mutants are in deep red. All three PIK3CA mutants were expressed and detected at a similar level. ND, not detected. (D) The level of AKT S473 phosphorylation (as proxy of activation) was measured by in-cell western analysis upon siRNA-mediated knockdown of PIK3CA interacting preys and control genes (PTEN, PIK3CA, and PIK3R1) in MCF7 cells. The intensity of AKT pS473 was normalized to total AKT as well as cell viability. *** p-value ≤ 1.0×10⁻³, ** p-value ≤ 1.0×10⁻². (E-F) Increase of AKT S473 phosphorylation upon knockdown of BPIFA1 and SCGB2A1 was confirmed by western blot in both MCF7 and MDA-MB-231 cells, respectively. (G-H) PIK3CA (WT, E545K, and H1047R) kinase activity towards phosphatidylinositol-4, 5-bisphosphate (PIP2) was measured in vitro in the presence of increasing amounts of recombinant BPIFA1 and SCGB2A1, respectively. Results are from at least 3–6 independent experiments. **** p-value ≤ 1.0×10⁻⁴.
Figure 4.
Figure 4.. Quantitative analysis of the effect of mutations on the BRCA1 interactome.
(A) Functional domains in the BRCA1 gene and the location of mutations analyzed by AP-MS. (B) Relative quantification of the abundance of prey proteins (PPI score ≥ 0.65, ≥ 8-fold change) identified by BRCA1 AP-MS in MDA-MB-231 cells. All prey abundance values were normalized by 3xFLAG-tagged BRCA1 levels in their respective AP-MS experiments. Preys detected only in WT are represented in deep blue while preys detected only in mutants are in deep red. A group of proteins involved in HR repair (boxed in green) are clustered together, wherein RING domain and BRCT domain BRCA1 mutants show distinct PPI abundance profiles. Spinophilin has not previously been known to have a function relevant to HR repair. UBE2N is boxed in sky blue. ND, not detected. (C) PPIs of selected proteins with BRCA1 (WT or C61G mutant) were confirmed by co-immunoprecipitation with anti-FLAG antibody followed by western blot analysis. (D) Box plot shows that the patient group (enrolled in the I-SPY 2 clinical trial) with pCR to veliparib (PARP inhibitor) and carboplatin (VC) had pre-treatment tumors with significantly lower UBE2N mRNA expression (LR p-value = 0.034) than those of non-responding patients. In contrast, BC patient tumors in the control arm did not show any significant difference in UBE2N expression between pCR and no pCR groups. (E) Mosaic plot shows that BC patients who did pCR to VC in addition to standard chemotherapy had 2.9 times more likely had lower mRNA expression of UBE2N in their pre-treatment tumors (Odds Ratio = 2.9). In the control arm, there is no significant difference in pCR between low and high UBE2N expression groups. Numbers in each block represent the patient sample size. Column width indicates the relative proportion of the UBE2N low and high expression group on the patient population. (F) A schematic of the HR reporter assay. The DR-GFP reporter contains two defective copies of the GFP gene, one disrupted by an I-SceI site and the other lacking a promoter. I-SceI cutting of the first copy generates a DSB, and repair by HR with the second copy as a template leads to restoration of a functional GFP gene. siRNA-mediated knockdown of HR-related genes leads to reduction of GFP+ cells (a proxy of HR activity) compared to NTC experiments. (G) HR activities upon depletion of USP28 relative to NTC (set to 100%). Depletion of BRCA1 and RIF1 was included and analyzed as controls. Data shown are the means from 3–6 independent experiments for each siRNA. Error bars represent standard deviations (SDs). **** p-value ≤ 1.0×10⁻⁵, ** p-value ≤ 0.01, * p-value ≤ 0.05.
Figure 5.
Figure 5.. Spinophilin interacts with BRCA1 and regulates DNA damage response via dephosphorylation.
(A) AP-MS of 3xFLAG-tagged Spinophilin (SPN, encoded by PPP1R9B) identifies BRCA1 (highlighted in a red edge) and other DDR-related proteins as well as PP1 catalytic subunits (PPP1CA, PPP1CB, and PPP1CC) in MDA-MB-231 cells. (B) HA-tagged SPN (WT, S212A, S248A, S635A, or F451A) was transfected with 3xFLAG-BRCA1 into HEK293T cells. After pulldown with anti-HA magnetic beads, co-associated 3xFLAG-BRCA1 was monitored. S635A mutation significantly diminished BRCA1 pulldown, while F451A mutation abolished the association with PP1 catalytic subunit (PPP1CA). Empty vectors were used as negative control. (C) HR activities upon depletion of SPN relative to NTC (set to 100%) were measured as in Fig. 4G. Data shown are the means from 3–9 independent experiments for each siRNA. Error bars represent standard deviations (SDs). **** p-value ≤ 1.0×10⁻⁵, ** p-value ≤ 1.0×10⁻². (D) A schematic of the SA-GFP reporter assay. The SA-GFP reporter contains a 5’-fragment of GFP (5’-GFP) and a 3’-fragment of GFP (Sce3’-GFP) that contains an I-SceI site. Repair of the DSB in Sce3’-GFP using 266 nt homology by single-strand annealing (SSA) restores a functional GFP gene. (E) SSA activities upon depletion of SPN relative to NTC (set to 100%). Depletion of BRCA1 and BRCA2 was included and analyzed as controls. Data shown are the means ± SDs from six independent experiments for each siRNA. **** p-value ≤ 1.0×10⁻⁴, *** p-value ≤ 1.0×10⁻³. (F-G) CMV promoter-driven SPN (WT, S635A, or F451A) expression DNA construct was transfected into U2OS DR and SA-GFP reporter cells, and the effect of SPN overexpression on HR and SSA activities was monitored, respectively. **** p-value ≤ 1.0×10⁻⁴, ** p-value ≤ 1.0×10⁻². (H) Selective peptides derived from various proteins including BRCA1 and H2AX as well as non-DNA repair proteins (INCENP and BCAR1) were individually mixed with lysates from either SPN KO or parental cells and subsequently monitored for phosphorylation by measuring ATP consumption in each reaction. Net peptide phosphorylation values are net changes in ATP concentrations between SPN knockout cells and parental control cells (subtraction of parental runs from SPN KO runs). Mean value of two independent runs was shown in the y-axis. Units are arbitrary. Error bars represent standard deviations (SDs). * p-value ≤ 0.05, ** p-value ≤ 1.0×10⁻². (I) SPN KO and parental cells were treated with 2.5 μM etoposide (Eto) for 16 hr and changes in the phosphorylation level of BRCA1 S1423 (pS1423) and H2AX S140 (γ-H2AX) were monitored at 0, 1, 2, and 4 hr post Eto treatment with fresh medium. (J) Model for the role of SPN in regulating DDR. See text for details.

Comment in

  • Identifying cancer drivers.
    Cheng R, Jackson PK. Cheng R, et al. Science. 2021 Oct;374(6563):38-39. doi: 10.1126/science.abl9080. Epub 2021 Sep 30. Science. 2021. PMID: 34591644

Similar articles

Cited by

References

    1. Siegel RL, Miller KD, Fuchs HE, Jemal A, Cancer Statistics, 2021. CA: A Cancer Journal for Clinicians. 71 (2021), pp. 7–33. - PubMed
    1. Cancer Genome Atlas, Network, Comprehensive molecular portraits of human breast tumours. Nature. 490, 61–70 (2012). - PMC - PubMed
    1. Stephens PJ, Tarpey PS, Davies H, Van Loo P, Greenman C, Wedge DC, Nik-Zainal S, Martin S, Varela I, Bignell GR, Yates LR, Papaemmanuil E, Beare D, Butler A, Cheverton A, Gamble J, Hinton J, Jia M, Jayakumar A, Jones D, Latimer C, Lau KW, McLaren S, McBride DJ, Menzies A, Mudie L, Raine K, Rad R, Chapman MS, Teague J, Easton D, Langerod A, Oslo Breast Cancer, Consortium, Lee MT, Shen CY, Tee BT, Huimin BW, Broeks A, Vargas AC, Turashvili G, Martens J, Fatima A, Miron P, Chin SF, Thomas G, Boyault S, Mariani O, Lakhani SR, van de Vijver M, van ‘t Veer L, Foekens J, Desmedt C, Sotiriou C, Tutt A, Caldas C, Reis-Filho JS, Aparicio SA, Salomon AV, Borresen-Dale AL, Richardson AL, Campbell PJ, Futreal PA, Stratton MR, The landscape of cancer genes and mutational processes in breast cancer. Nature. 486, 400–404 (2012). - PMC - PubMed
    1. Wood LD, Parsons DW, Jones S, Lin J, Sjöblom T, Leary RJ, Shen D, Boca SM, Barber T, Ptak J, Silliman N, Szabo S, Dezso Z, Ustyanksky V, Nikolskaya T, Nikolsky Y, Karchin R, Wilson PA, Kaminker JS, Zhang Z, Croshaw R, Willis J, Dawson D, Shipitsin M, Willson JKV, Sukumar S, Polyak K, Park BH, Pethiyagoda CL, Pant PVK, Ballinger DG, Sparks AB, Hartigan J, Smith DR, Suh E, Papadopoulos N, Buckhaults P, Markowitz SD, Parmigiani G, Kinzler KW, Velculescu VE, Vogelstein B, The genomic landscapes of human breast and colorectal cancers. Science. 318, 1108–1113 (2007). - PubMed
    1. Cho A, Shim JE, Kim E, Supek F, Lehner B, Lee I, MUFFINN: cancer gene discovery via network analysis of somatic mutation data. Genome Biology. 17 (2016), , doi:10.1186/s13059-016-0989-x. - DOI - PMC - PubMed

Publication types

Substances