Laboratory evaluation of twelve portable devices for medicine quality screening
- PMID: 34591844
- PMCID: PMC8483346
- DOI: 10.1371/journal.pntd.0009360
Laboratory evaluation of twelve portable devices for medicine quality screening
Abstract
Background: Post-market surveillance is a key regulatory function to prevent substandard and falsified (SF) medicines from being consumed by patients. Field deployable technologies offer the potential for rapid objective screening for SF medicines.
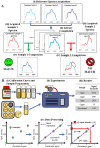
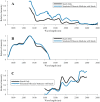
Methods and findings: We evaluated twelve devices: three near infrared spectrometers (MicroPHAZIR RX, NIR-S-G1, Neospectra 2.5), two Raman spectrometers (Progeny, TruScan RM), one mid-infrared spectrometer (4500a), one disposable colorimetric assay (Paper Analytical Devices, PAD), one disposable immunoassay (Rapid Diagnostic Test, RDT), one portable liquid chromatograph (C-Vue), one microfluidic system (PharmaChk), one mass spectrometer (QDa), and one thin layer chromatography kit (GPHF-Minilab). Each device was tested with a series of field collected medicines (FCM) along with simulated medicines (SIM) formulated in a laboratory. The FCM and SIM ranged from samples with good quality active pharmaceutical ingredient (API) concentrations, reduced concentrations of API (80% and 50% of the API), no API, and the wrong API. All the devices had high sensitivities (91.5 to 100.0%) detecting medicines with no API or the wrong API. However, the sensitivities of each device towards samples with 50% and 80% API varied greatly, from 0% to 100%. The infrared and Raman spectrometers had variable sensitivities for detecting samples with 50% and 80% API (from 5.6% to 50.0%). The devices with the ability to quantitate API (C-Vue, PharmaChk, QDa) had sensitivities ranging from 91.7% to 100% to detect all poor quality samples. The specificity was lower for the quantitative C-Vue, PharmaChk, & QDa (50.0% to 91.7%) than for all the other devices in this study (95.5% to 100%).
Conclusions: The twelve devices evaluated could detect medicines with the wrong or none of the APIs, consistent with falsified medicines, with high accuracy. However, API quantitation to detect formulations similar to those commonly found in substandards proved more difficult, requiring further technological innovation.
Conflict of interest statement
The authors have declared that no competing interests exist.
Figures


Similar articles
-
Implementation of field detection devices for antimalarial quality screening in Lao PDR-A cost-effectiveness analysis.PLoS Negl Trop Dis. 2021 Sep 30;15(9):e0009539. doi: 10.1371/journal.pntd.0009539. eCollection 2021 Sep. PLoS Negl Trop Dis. 2021. PMID: 34591842 Free PMC article.
-
A comparative field evaluation of six medicine quality screening devices in Laos.PLoS Negl Trop Dis. 2021 Sep 30;15(9):e0009674. doi: 10.1371/journal.pntd.0009674. eCollection 2021 Sep. PLoS Negl Trop Dis. 2021. PMID: 34591852 Free PMC article.
-
Multiphase evaluation of portable medicines quality screening devices.PLoS Negl Trop Dis. 2021 Sep 30;15(9):e0009287. doi: 10.1371/journal.pntd.0009287. eCollection 2021 Sep. PLoS Negl Trop Dis. 2021. PMID: 34591864 Free PMC article. No abstract available.
-
Characterizing Medicine Quality by Active Pharmaceutical Ingredient Levels: A Systematic Review and Meta-Analysis across Low- and Middle-Income Countries.Am J Trop Med Hyg. 2022 Jun 15;106(6):1778-1790. doi: 10.4269/ajtmh.21-1123. Print 2022 Jun 15. Am J Trop Med Hyg. 2022. PMID: 35895431 Free PMC article.
-
Falsification of biotechnology drugs: current dangers and/or future disasters?J Pharm Biomed Anal. 2018 Nov 30;161:175-191. doi: 10.1016/j.jpba.2018.08.037. Epub 2018 Aug 20. J Pharm Biomed Anal. 2018. PMID: 30165334 Review.
Cited by
-
Relationship between Prices and Quality of Essential Medicines from Different Manufacturers Collected in Cameroon, the Democratic Republic of the Congo, and Nigeria.Am J Trop Med Hyg. 2024 Oct 8;111(6):1378-1395. doi: 10.4269/ajtmh.24-0309. Print 2024 Dec 4. Am J Trop Med Hyg. 2024. PMID: 39378886 Free PMC article.
-
Screening for substandard and falsified medicines in Nigeria using visual inspection and GPHF-Minilab analysis: lessons learnt for future training of health workers and pharmacy personnel.J Pharm Policy Pract. 2024 Dec 9;17(1):2432471. doi: 10.1080/20523211.2024.2432471. eCollection 2024. J Pharm Policy Pract. 2024. PMID: 39664864 Free PMC article.
-
Usefulness of medicine screening tools in the frame of pharmaceutical post-marketing surveillance.PLoS One. 2023 Aug 11;18(8):e0289865. doi: 10.1371/journal.pone.0289865. eCollection 2023. PLoS One. 2023. PMID: 37566594 Free PMC article.
-
Implementation of field detection devices for antimalarial quality screening in Lao PDR-A cost-effectiveness analysis.PLoS Negl Trop Dis. 2021 Sep 30;15(9):e0009539. doi: 10.1371/journal.pntd.0009539. eCollection 2021 Sep. PLoS Negl Trop Dis. 2021. PMID: 34591842 Free PMC article.
-
A comparative field evaluation of six medicine quality screening devices in Laos.PLoS Negl Trop Dis. 2021 Sep 30;15(9):e0009674. doi: 10.1371/journal.pntd.0009674. eCollection 2021 Sep. PLoS Negl Trop Dis. 2021. PMID: 34591852 Free PMC article.
References
-
- World Health Organization. A study on the public health and socioeconomic impact of substandard and falsified medical products. Geneva: World Health Organization; 2017. https://www.who.int/medicines/regulation/ssffc/publications/se-study-sf/en/
Publication types
MeSH terms
Substances
Grants and funding
LinkOut - more resources
Full Text Sources
Medical
Miscellaneous

