

Kinetic modeling reveals additional regulation at co-transcriptional level by post-transcriptional sRNA regulators
- PMID: 34592145
- PMCID: PMC8634553
- DOI: 10.1016/j.celrep.2021.109764
Kinetic modeling reveals additional regulation at co-transcriptional level by post-transcriptional sRNA regulators
Abstract
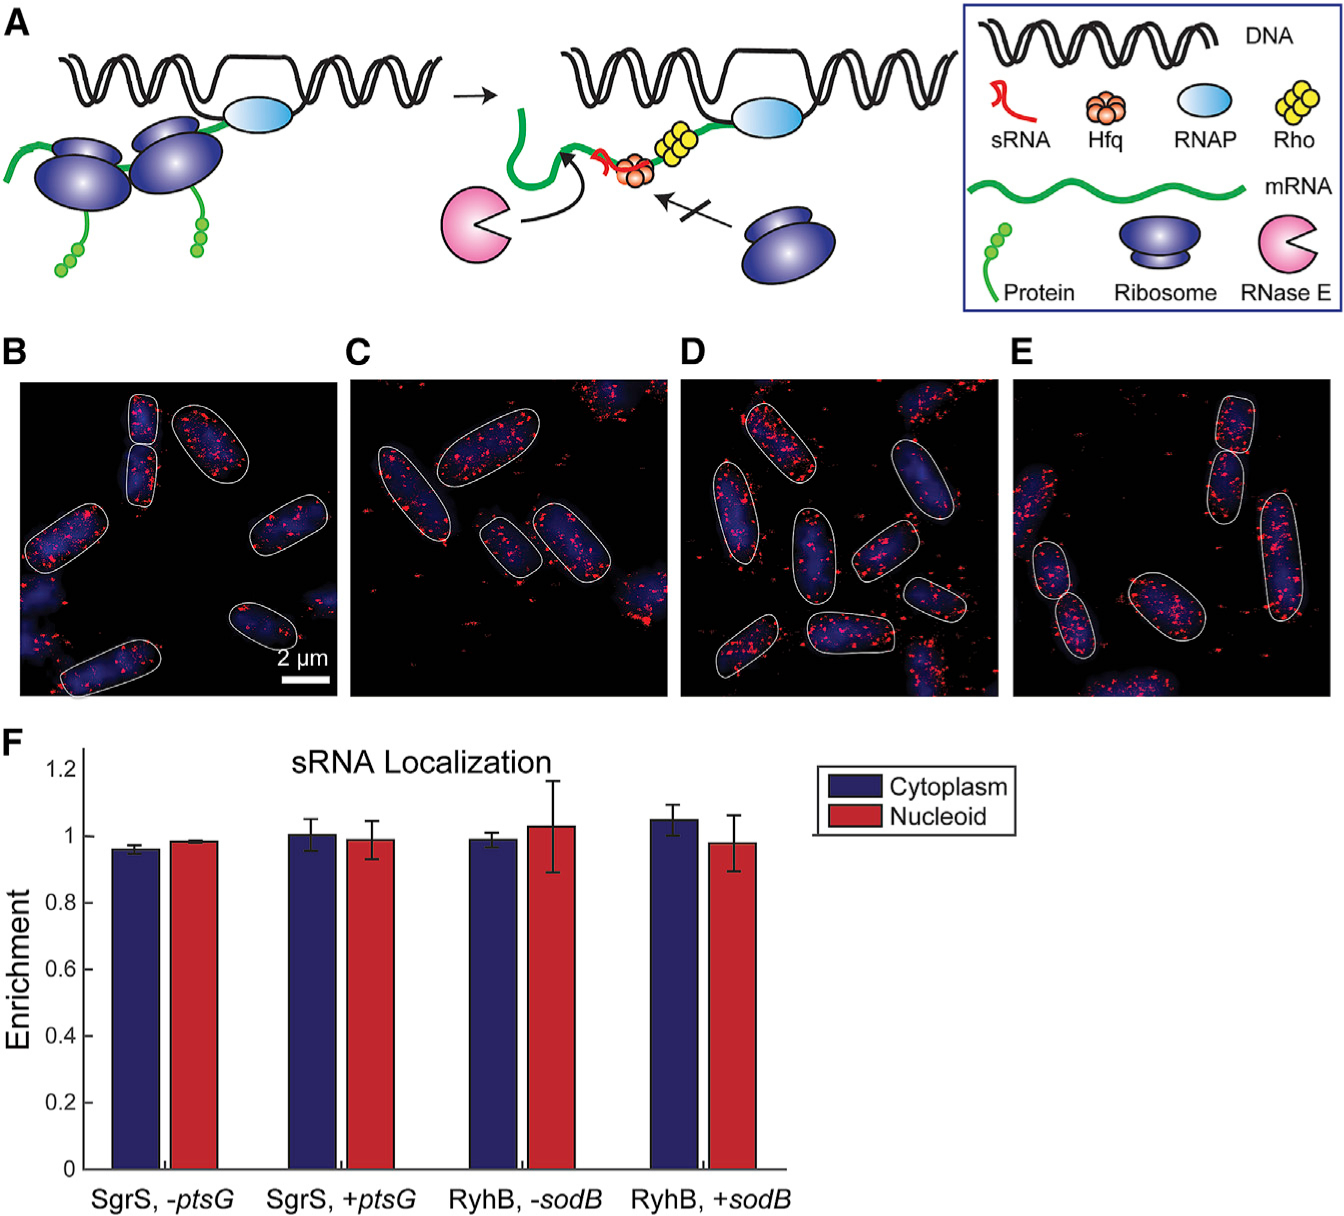
Small RNAs (sRNAs) are important gene regulators in bacteria. Many sRNAs act post-transcriptionally by affecting translation and degradation of the target mRNAs upon base-pairing interactions. Here we present a general approach combining imaging and mathematical modeling to determine kinetic parameters at different levels of sRNA-mediated gene regulation that contribute to overall regulation efficacy. Our data reveal that certain sRNAs previously characterized as post-transcriptional regulators can regulate some targets co-transcriptionally, leading to a revised model that sRNA-mediated regulation can occur early in an mRNA's lifetime, as soon as the sRNA binding site is transcribed. This co-transcriptional regulation is likely mediated by Rho-dependent termination when transcription-coupled translation is reduced upon sRNA binding. Our data also reveal several important kinetic steps that contribute to the differential regulation of mRNA targets by an sRNA. Particularly, binding of sRNA to the target mRNA may dictate the regulation hierarchy observed within an sRNA regulon.
Keywords: bacterial small RNA; fluorescence microscopy; gene regulation; mathematical modeling.
Copyright © 2021 The Author(s). Published by Elsevier Inc. All rights reserved.
Conflict of interest statement
Declaration of interests The authors declare no competing interests.
Figures


Similar articles
-
Dynamic interactions between the RNA chaperone Hfq, small regulatory RNAs, and mRNAs in live bacterial cells.Elife. 2021 Feb 22;10:e64207. doi: 10.7554/eLife.64207. Elife. 2021. PMID: 33616037 Free PMC article.
-
The Phosphorolytic Exoribonucleases Polynucleotide Phosphorylase and RNase PH Stabilize sRNAs and Facilitate Regulation of Their mRNA Targets.J Bacteriol. 2016 Nov 18;198(24):3309-3317. doi: 10.1128/JB.00624-16. Print 2016 Dec 15. J Bacteriol. 2016. PMID: 27698082 Free PMC article.
-
A Modular Genetic System for High-Throughput Profiling and Engineering of Multi-Target Small RNAs.Methods Mol Biol. 2018;1737:373-391. doi: 10.1007/978-1-4939-7634-8_21. Methods Mol Biol. 2018. PMID: 29484604
-
Regulation of Transcription Termination of Small RNAs and by Small RNAs: Molecular Mechanisms and Biological Functions.Front Cell Infect Microbiol. 2019 Jun 12;9:201. doi: 10.3389/fcimb.2019.00201. eCollection 2019. Front Cell Infect Microbiol. 2019. PMID: 31249814 Free PMC article. Review.
-
Hfq chaperone brings speed dating to bacterial sRNA.Wiley Interdiscip Rev RNA. 2018 Jul;9(4):e1475. doi: 10.1002/wrna.1475. Epub 2018 Apr 6. Wiley Interdiscip Rev RNA. 2018. PMID: 29633565 Free PMC article. Review.
Cited by
-
Cultivation driven transcriptomic changes in the wild-type and mutant strains of Rhodospirillum rubrum.Comput Struct Biotechnol J. 2024 Jun 20;23:2681-2694. doi: 10.1016/j.csbj.2024.06.023. eCollection 2024 Dec. Comput Struct Biotechnol J. 2024. PMID: 39035834 Free PMC article.
-
Single-molecule imaging reveals the role of membrane-binding motif and C-terminal domain of RNase E in its localization and diffusion in Escherichia coli.bioRxiv [Preprint]. 2024 Nov 5:2024.11.05.622141. doi: 10.1101/2024.11.05.622141. bioRxiv. 2024. PMID: 40093181 Free PMC article. Preprint.
-
RNA Metabolism and the Role of Small RNAs in Regulating Multiple Aspects of RNA Metabolism.Noncoding RNA. 2024 Dec 24;11(1):1. doi: 10.3390/ncrna11010001. Noncoding RNA. 2024. PMID: 39846679 Free PMC article. Review.
-
Riboswitch and small RNAs modulate btuB translation initiation in Escherichia coli and trigger distinct mRNA regulatory mechanisms.Nucleic Acids Res. 2024 Jun 10;52(10):5852-5865. doi: 10.1093/nar/gkae347. Nucleic Acids Res. 2024. PMID: 38742638 Free PMC article.
-
Bacterial RNA chaperones and chaperone-like riboregulators: behind the scenes of RNA-mediated regulation of cellular metabolism.RNA Biol. 2022;19(1):419-436. doi: 10.1080/15476286.2022.2048565. Epub 2021 Dec 31. RNA Biol. 2022. PMID: 35438047 Free PMC article.
References
Publication types
MeSH terms
Substances
Grants and funding
LinkOut - more resources
Full Text Sources
Other Literature Sources
Molecular Biology Databases
