. 2021 Sep 28;36(13):109758.
doi: 10.1016/j.celrep.2021.109758.

A cell-type-specific atlas of the inner ear transcriptional response to acoustic trauma

Affiliations

A cell-type-specific atlas of the inner ear transcriptional response to acoustic trauma

Beatrice Milon et al. Cell Rep. .

Abstract

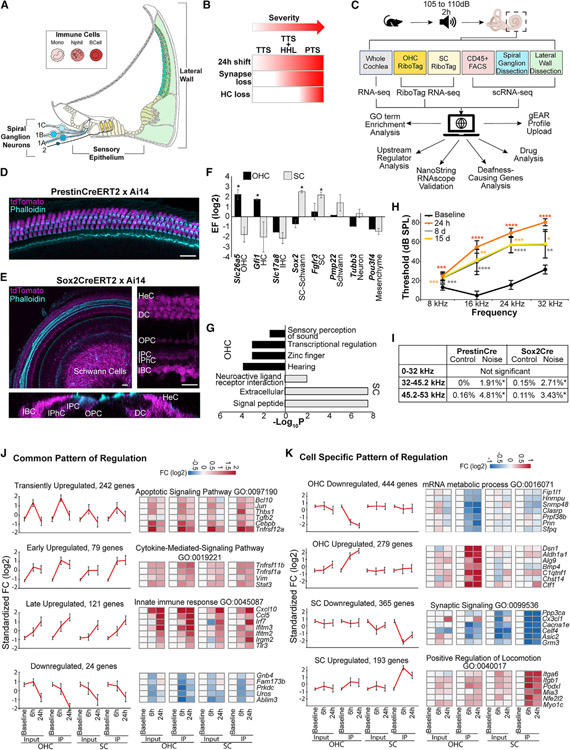
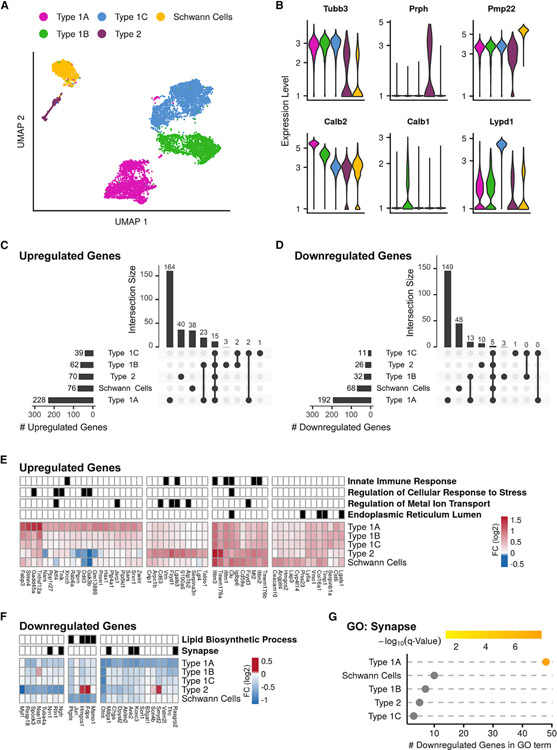
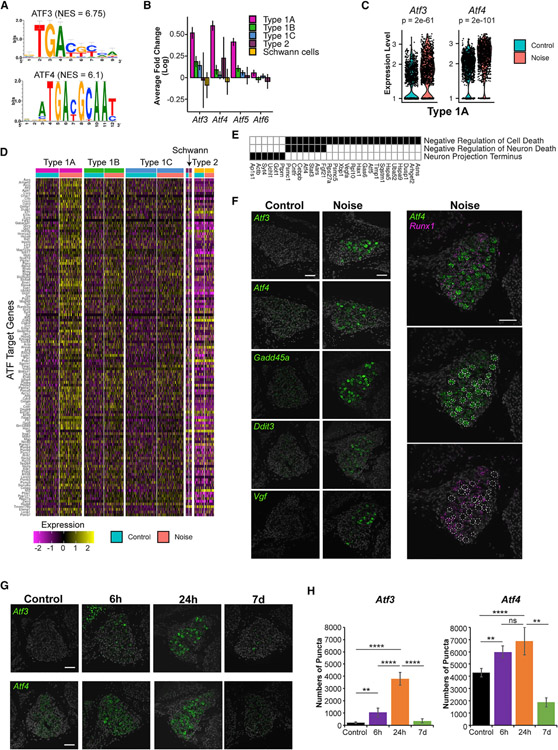
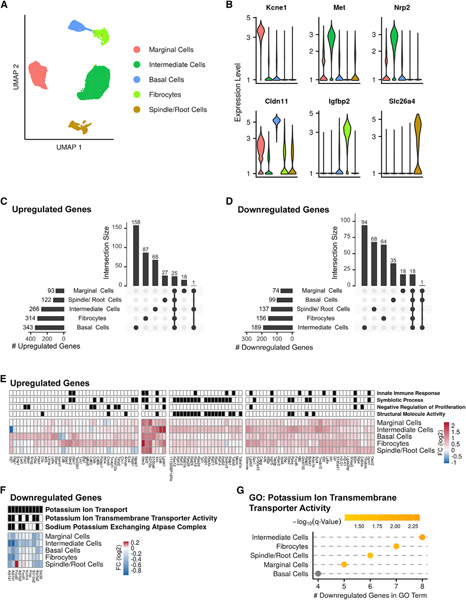
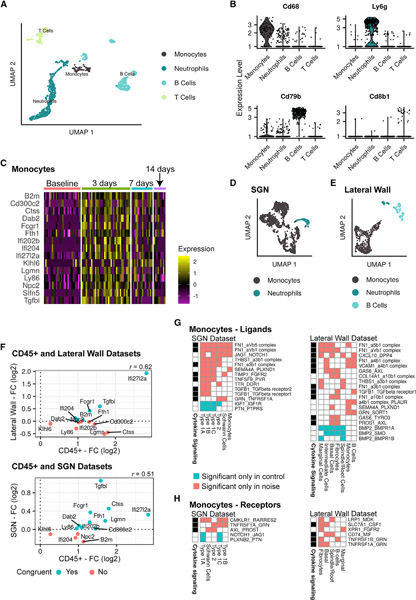
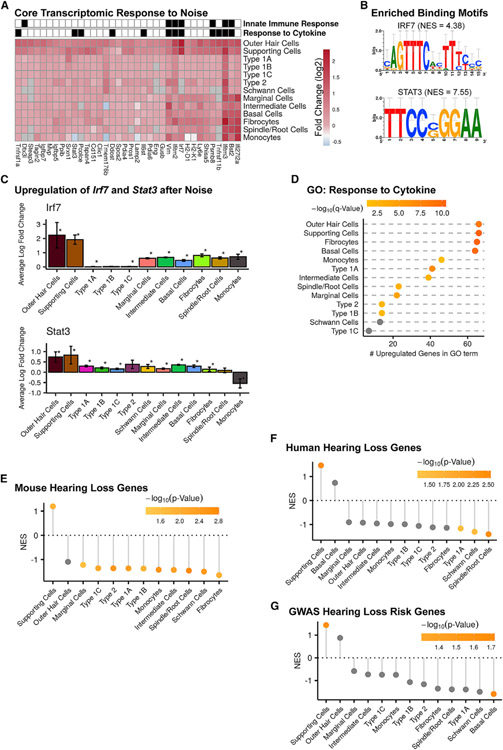
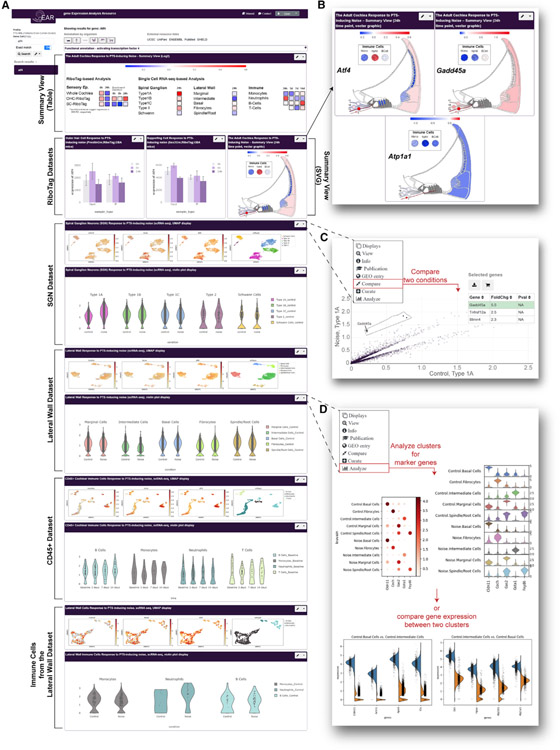
Noise-induced hearing loss (NIHL) results from a complex interplay of damage to the sensory cells of the inner ear, dysfunction of its lateral wall, axonal retraction of type 1C spiral ganglion neurons, and activation of the immune response. We use RiboTag and single-cell RNA sequencing to survey the cell-type-specific molecular landscape of the mouse inner ear before and after noise trauma. We identify induction of the transcription factors STAT3 and IRF7 and immune-related genes across all cell-types. Yet, cell-type-specific transcriptomic changes dominate the response. The ATF3/ATF4 stress-response pathway is robustly induced in the type 1A noise-resilient neurons, potassium transport genes are downregulated in the lateral wall, mRNA metabolism genes are downregulated in outer hair cells, and deafness-associated genes are downregulated in most cell types. This transcriptomic resource is available via the Gene Expression Analysis Resource (gEAR; https://umgear.org/NIHL) and provides a blueprint for the rational development of drugs to prevent and treat NIHL.

Keywords: ATF; IRF7; RiboTag; STAT3; cochlea; noise-induced hearing loss; scRNA-seq; spiral ganglion; transcriptomics.


Conflict of interest statement

Declaration of interests K.S.S., J.B.S., G.P., A.T.P., and J.B. are employees of Decibel Therapeutics. The data presented in this manuscript are registered for pending U.S. Provisional Patent Application, number: 63/151,249, title: “System and Methods for Cell Type-Specific Atlas for the Inner Ear Transcriptional Response to Acoustic Trauma,” and UMB docket number: RH-2021-073.

Figures

Figure 1.
Figure 1.. Experimental design and response of OHCs and SCs to noise
(A) Schematic representing the different domains of the cochlea addressed by the experimental design. (B) The long-term cellular and functional consequences of noise exposure present as a continuum with compounding effects. (C) Schematic of the experimental design. (D and E) Confocal images of whole mounted P14 mouse cochlear ducts. A cross of Prestin-CreERT2 with Ai14 (n = 5) validates the specific expression of the Cre recombinase in OHCs (D). A cross of Sox2-CreERT2 with Ai14 (n = 4) indicates recombination of the Cre in Deiters’ cells (DCs), inner pillar cells (IPCs), outer pillar cells (OPCs), inner phalangeal cells (IPhCs), inner border cells (IBCs), Hensen’s cells (HeCs), and in the glial cells. Bottom panel is an orthogonal view of a Z stack showing the absence of staining in the hair cells. Scale bar, 20 μm. (F) Enrichment and depletion of cell-type-specific markers in the RiboTag-IP when compared to the input (n = 2 paired input-IP for each dataset). Asterisk (*) indicates genes meeting the enrichment criteria described in the methods. (G) Overrepresented GO categories among genes with expression specifically enriched in SCs or OHCs (p values calculated using hypergeometric test). (H) ABR thresholds from 9-to-11-week-old mice (n = 15) exposed to 105 dB SPL for 2 h before and 24 h, 7 days, and 15 days post noise exposure. Error bars: standard deviations. *p < 0.05; **p < 0.01; ***p < 0.001; ****p < 0.0001. Two-way ANOVA with Tukey’s post hoc test. (I) Percentage of missing OHC along different frequency ranges. (PrestinCre: n = 3 biological replicates for each condition; Sox2Cre: n = 6 controls, n = 5 noise-exposed). *p < 0.05. Unpaired t test. (J and K) Integrated analysis of the OHC and SC datasets delineates the transcriptional responses to noise that are common (J) and OHC- or SC-specific (K). Error bars: standard deviations. Selected genes from each cluster are shown using heatmaps.
Figure 2.
Figure 2.. scRNA-seq analysis of the response of the SGNs to PTS-inducing noise exposure
(A) UMAP of the 8,916 SGNs and Schwann cells (n = 4 biological replicates for each condition). (B) Violin plots for the expression of known marker genes, colored according to cell type as in (A). (C and D) Upset plots of upregulated (C) and downregulated (D) DEGs in noise-exposed versus control samples. Horizontal bars: overall number of DEGs detected in each cell type. Vertical bars: number of DEGs in selected intersections between cell types indicated below the bars. (E) Hierarchical clustering applied to the set of 56 upregulated genes that showed, upon noise exposure, a fold-change induction greater than 1.5 and FDR q value <0.05 (MAST’s statistical test) in at least one of the cell types. The grid above the heatmap displays assignment of genes to enriched GO terms (q < 0.05, hypergeometric test) (Table S3). (F) Same as (E) but for the 27 downregulated genes (Table S3). (G) The GO term “synapse” is enriched in the downregulated DEGs of type 1A. (q < 0.05, hypergeometric test).
Figure 3.
Figure 3.. ATF transcription factors regulate the type 1A transcriptional response to noise
(A) Top scoring enriched motifs on promoters of the genes induced in type 1A SGNs. NES, normalized enrichment score. (B) Several genes from the Aft family display a greater induction in type 1A compared to other SGNs. Error bar: 95% confidence interval from MAST DE analysis. (C) Violin plots showing Atf3 and Atf4 expression in type 1A control and noise-exposed cells. p values calculated using MAST. (D) Heatmap of normalized and scaled expression levels of ATF-predicted target genes induced by noise in type 1A SGNs. Rows are genes and columns are cells. (E) Selected GO terms enriched in the ATF-predicted targets from (D) (Table S3). (F) Representative images of RNAscope labeling for selected ATF-target transcripts in the spiral ganglia of control and noise-exposed mice show an increase in gene expression in type 1A SGNs following noise (n = 3 controls, n = 3 noise-exposed). Scale bar, 50 μm. (G) Time course of Atf3 and Atf4 induction following noise exposure. Scale bar, 50 μm. (H) Quantitative analysis of the RNAscope labeling for Atf3 and Atf4 using QuPath (see Method details). Error bars: standard deviation (n = 3 biological replicates for each condition). **p < 0.01; ****p < 0.0001; ns not significant. One-way ANOVA with Tukey’s post hoc test.
Figure 4.
Figure 4.. scRNA-seq analysis of the response of the lateral wall to noise
(A) UMAP of the 25,599 LW cells (n = 4 biological replicates for each condition). (B) Violin plots for the expression levels of known marker genes, colored according to cell type as in (A). (C and D) Upset plots of upregulated (C) and downregulated (D) DEGs in noise versus control comparisons. (E) Heatmap showing the DEGs induced by a fold change greater than 1.5 (FDR q < 0.05; MAST’s statistical test) in at least one cell type. The grid above the heatmap shows selected GO term enriched in each of the clusters (q < 0.05, hypergeometric test). (F and G) A program of gene repression upon noise exposure shared by most of the LW cell types is enriched for genes that function in potassium transport (hypergeometric test).
Figure 5.
Figure 5.. scRNA-seq analysis of the response of inner ear CD45+ immune cells to PTS noise exposure
(A) UMAP of 1,123 cochlear immune cells taken from control mice and noise-exposed mice at 3, 7, and 14 days after exposure (n = 1 biological replicate consisting of pooled tissue from 6 mice at each time point). (B) Violin plots for the expression of known marker genes for B cells, T cells, monocytes, and neutrophils. (C) Heatmap showing the expression levels of the 15 DEGs detected in monocytes. Columns represent cells, and color indicates scaled normalized expression levels. (D) UMAP of 1,499 immune cells taken from control and 24 h post noise exposure in the SGN dataset. (E) UMAP of 655 immune cells taken from control and 24 h post noise exposure in the LW dataset. (F) Correlation between the response to noise of the DEGs detected in monocytes of the CD45+ sorted dataset and the response in monocytes from the LW and SGNs datasets. Shown are the 13 DEGs (out of 15 DEGs) whose expression was detected also in monocytes of the LW/SGNs dataset. Note: time point posttreatment differs between the two datasets: 24 h in the LW and SGN compared to 3 days in the CD45+ dataset. r, Pearson correlation coefficient. (G) Ligand-receptor interactions detected by CellPhoneDB (FDR < 5%). Shown are interactions called either only in the noise-exposed or the control cells (and that the mean expression of the pair of ligand receptors was higher under that condition) and are mediated by a ligand secreted by monocytes. Each interaction is labeled by the pair of the ligand and receptor symbols with the ligand indicated first. The genes involved in these interactions were enriched for cytokine signaling (q = 0.003 and 0.0007 for SGNs and LW, respectively; hypergeometric test). (H) Similar analysis to (G), focusing on receptors in the immune cells and ligands in the target cells.
Figure 6.
Figure 6.. A common response to PTS-noise exposure in inner ear cells
(A) Heatmap of the set of common upregulated genes. Gray indicates that the gene was not detected in the corresponding cell type. Shown are genes that were detected as upregulated (q < 0.05; fold change > 0; MAST’s or DESeq2 statistical test for scRNA-seq or RiboTag datasets, respectively) in at least two cell types in each of the two single-cell datasets (SGN and LW) and were members of one of the common upregulated gene clusters in the RiboTag dataset (Figure 1J). These genes were enriched for the GO terms “response to cytokine” (q = 0.0008) and “innate immune response” (q = 0.04). “Monocytes” refer to LW monocytes. (B) The promoters of the common upregulated genes from (A) were enriched (RcisTarget analysis) for the binding motifs of IRF7 and STAT3 TFs (NES, normalized enrichment score). (C) Upregulation of Irf7 and Stat3 transcripts was observed in most cell types in the inner ear. *q < 0.05 (MAST’s or DESeq2 statistical test for scRNA-seq or RiboTag datasets, respectively). Error bar: 95% confidence. (D) For 11 out of 13 cell types, the set of upregulated DEGs was enriched for the GO term “response to cytokine” (q < 0.05, hypergeometric test). (E–G) Plots showing the NES obtained from GSEA for the mouse hearing-loss-causing genes (E), for the human hearing-loss-causing genes (F), and for GWAS hearing-loss-risk genes (G) in each cell type following noise exposure. All cells, except for SCs, had a negative NES reflecting downregulation of hearing-loss genes following noise exposure.
Figure 7.
Figure 7.. Data sharing, visualization, and analysis via the gEAR (umgear.org)
A custom profile was generated in the gEAR to support sharing, visualization, and analysis of the processed transcriptomic data presented as part of this manuscript (https://umgear.org/NIHL). (A) Overview of the manuscript profile, which contains two summary views (tabular and graphic, depicting gene expression as log2 fold change), the OHC and SC RiboTag datasets (bar graphs), and the SGN, LW, and immune cells datasets (UMAPs and violin plots). (B) Examples of the graphic summary view representation for Atf4, Gadd45a, and Atp1a1 showing the (log2) fold change in gene expression following noise exposure mapped onto anatomical sites for intuitive interpretation of the data. (C and D) The gEAR portal contains several analysis tools allowing users to further explore the data in the cloud. (C) Example of the “compare tool,” which enables users to compare expression across any two conditions within a single dataset, here showing the DEGs in type 1A SGNs between control and noise samples. (D) The single-cell workbench allows users to perform “de novo” analysis of the data or use a “stored analysis” to explore marker genes and compare across clusters. Here are shown marker genes for the 5 clusters (before and after noise) of the LW dataset (top) and the top 4 DEGs between intermediate and basal cells (bottom).

References

    1. Aibar S, González-Blas CB, Moerman T, Huynh-Thu VA, Imrichova H, Hulselmans G, Rambow F, Marine JC, Geurts P, Aerts J, et al. (2017). SCENIC: single-cell regulatory network inference and clustering. Nat. Methods 14, 1083–1086. - PMC - PubMed
    1. Amici SA, Dunn WA Jr., Murphy AJ, Adams NC, Gale NW, Valenzuela DM, Yancopoulos GD, and Notterpek L (2006). Peripheral myelin protein 22 is in complex with α6β4 integrin, and its absence alters the Schwann cell basal lamina. J. Neurosci. 26, 1179–1189. - PMC - PubMed
    1. Arnold K, Sarkar A, Yram MA, Polo JM, Bronson R, Sengupta S, Seandel M, Geijsen N, and Hochedlinger K (2011). Sox2(+) adult stem and progenitor cells are important for tissue regeneration and survival of mice. Cell Stem Cell 9, 317–329. - PMC - PubMed
    1. Bae SH, Yoo JE, Choe YH, Kwak SH, Choi JY, Jung J, and Hyun Y-M (2021). Neutrophils infiltrate into the spiral ligament but not the stria vascularis in the cochlea during lipopolysaccharide-induced inflammation. Theranostics 11, 2522–2533. - PMC - PubMed
    1. Bakken TE, Hodge RD, Miller JA, Yao Z, Nguyen TN, Aevermann B, Barkan E, Bertagnolli D, Casper T, Dee N, et al. (2018). Single-nucleus and single-cell transcriptomes compared in matched cortical cell types. PLoS ONE 13, e0209648. - PMC - PubMed

Publication types

MeSH terms