Multicenter Study
. 2021 Nov 9;54(11):2650-2669.e14.
doi: 10.1016/j.immuni.2021.09.002. Epub 2021 Sep 4.

Early IFN-α signatures and persistent dysfunction are distinguishing features of NK cells in severe COVID-19

Collaborators, Affiliations
Multicenter Study

Early IFN-α signatures and persistent dysfunction are distinguishing features of NK cells in severe COVID-19

Benjamin Krämer et al. Immunity. .

Abstract

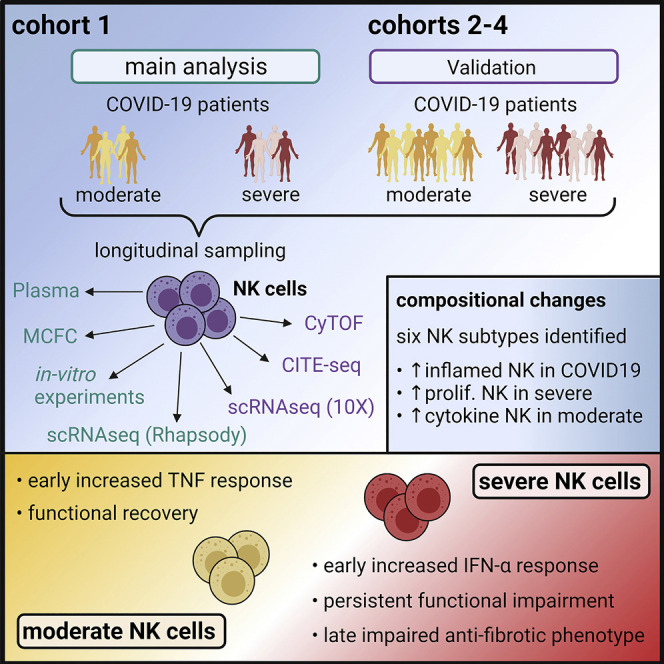
Longitudinal analyses of the innate immune system, including the earliest time points, are essential to understand the immunopathogenesis and clinical course of coronavirus disease (COVID-19). Here, we performed a detailed characterization of natural killer (NK) cells in 205 patients (403 samples; days 2 to 41 after symptom onset) from four independent cohorts using single-cell transcriptomics and proteomics together with functional studies. We found elevated interferon (IFN)-α plasma levels in early severe COVD-19 alongside increased NK cell expression of IFN-stimulated genes (ISGs) and genes involved in IFN-α signaling, while upregulation of tumor necrosis factor (TNF)-induced genes was observed in moderate diseases. NK cells exert anti-SARS-CoV-2 (severe acute respiratory syndrome coronavirus 2) activity but are functionally impaired in severe COVID-19. Further, NK cell dysfunction may be relevant for the development of fibrotic lung disease in severe COVID-19, as NK cells exhibited impaired anti-fibrotic activity. Our study indicates preferential IFN-α and TNF responses in severe and moderate COVID-19, respectively, and associates a prolonged IFN-α-induced NK cell response with poorer disease outcome.

Keywords: COVID-19; NK cells; TNF; antiviral; lung fibrosis; moderate; proteomics; scRNA-seq; severe; type 1 IFN.


Conflict of interest statement

Declaration of interests P.-A.K. and F.I.S. are cofounders and shareholders of Dioscure Therapeutics SE. F.I.S. is a consultant and shareholder of IFM Therapeutics. J.R.H. is founder and board member of Isoplexis and PACT Pharma. J.D.G. declares contracted research with Gilead, Lilly, and Regeneron. K.H., J.M.J., and A.J.B. work at Quanterix Corporation. All other authors declare no competing interests.

Figures

None
Graphical abstract
Figure 1
Figure 1
Multi-center study to determine NK cell molecular phenotype and function (A) Overview of the study design. (B) Overview of longitudinal patient distribution. (C) Absolute numbers of total NK cells and NK cells subsets in cohort 1. (D) Absolute numbers of total NK cells and CD56dim NK cells in cohort 2. (E) Pearson correlation between numbers of absolute and CD56dim NK cells and serum CRP levels. (F) Frequency of NK cells positive for active caspase-3 or CD95 in cohort 1. (G) Detection of CD95 and active caspase-3 in control NK cells co-incubated without or with nucleocapsid. Kruskal-Wallis (KW) test corrected for multiple comparison by controlling the false discovery rate (FDR; Benjamini, Krieger, Yekutieli [BKY]); p < 0.05, ∗∗p < 0.01, ∗∗∗p < 0.01. For n, see Table S6.
Figure 2
Figure 2
COVID-19-specific composition of the circulating NK cell compartment (A) Cell frequency density by disease severity overlaid on the UMAP of cohort 1 (scRNA-seq). (B) Heatmap of DEGs calculated based on the possible severity comparisons for all NK cells (scRNA-seq, cohort 1). Multiple comparison adjustment (Benjamini-Hochberg) and FDR cutoff of 5%. Hierarchical clustering of gene modules and functional enrichment using the Kyoto Encyclopedia of Genes and Genomes (KEGG) and Hallmark databases (Table S3). (C) UMAP of NK cells from cohort 1 (scRNA-seq; 10,927 cells). NK subtypes defined by cluster marker expression and reference-based NK annotations (Table S2). (D) Selected marker genes for each identified NK subtype from (C). (E) Heatmap showing the proportion of each severity group for identified NK subtypes of cohort 1 (scRNA-seq). (F) Cell frequency density plot by disease severity overlaid on the UMAP of cohort 1 (flow cytometric [FC] data) of controls (left top panel), moderate COVID-19 (middle top panel), and severe COVID-19 (left lower panel) patients. Phenograph clustering (middle lower panel) and NK cell subsets based on scRNA-seq data overlaid on the UMAP (right panel; alignment in Figures S2D and S2E). (G) Box and whisker plots of identified NK subtypes in cohort 1 (FC data). KW and Dunn’s multiple comparison test (not significant [ns]: p > 0.05, p ≤ 0.05, ∗∗p ≤ 0.01, ∗∗∗p ≤ 0.001, ∗∗∗∗p ≤ 0.0001). (H) Cell frequency density plot by disease severity overlaid on the UMAP of cohort 2 (CyTOF) of controls (left top panel), flu-like-illness (second top panel), moderate COVID-19 (third top panel), and severe COVID-19 (left lower panel) patients. Phenograph clustering (middle lower panel) and NK cell subsets based on scRNA-seq data overlaid on the UMAP (right panel; alignment in Figures S2F and S2G). (I) Box and whisker plots of identified NK subtypes in cohort 2 (CyTOF). KW with multiple comparison by controlling FDR (BKY) was performed; ns: p > 0.05, p ≤ 0.05, ∗∗p ≤ 0.01, ∗∗∗p ≤ 0.001. For n, see Table S6.
Figure 3
Figure 3
Longitudinal characterization of NK cells in COVID-19 (A–D) Workflow of longitudinal analysis of scRNA-seq data from cohort 1 (A), UMAPs (B), heatmap generation (C), and analysis (D) are indicated. (B) Cell frequency density plot by disease severity and weeks after onset overlaid on the UMAP of cohort 1 (scRNA-seq, for n, see Table S6). (C) Heatmap of DEGs calculated based on the possible comparisons for severities and week after onset based on all NK cells (scRNA-seq, cohort 1). Multiple comparison adjustment (Benjamini-Hochberg) and FDR cutoff of 5%. Hierarchical clustering of genes into modules (Table S4). (D) Selected results from functional enrichment analysis using the Gene Ontology (GO), KEGG, and Hallmark databases, transcription factor (TF) prediction, and upstream ligand prediction for each identified heatmap module from (C) (for the entire list, see Table S4). (E) Heatmap of mean area under the curve (AUC) scores based on AUCell enrichment of heatmap gene modules from (C) for NK subtypes of cohort 1 (scRNA-seq). (F) NK subtype occupancy over time in days after symptom onset as average of all samples stratified by severity. (G) Density plot of cell frequency by disease severity and weeks after onset overlaid on the UMAP of cohort 1 (FC data). (H) Heatmap divided by disease severity and weeks after onset showing the proportion of each severity group for the three identified NK subtypes of cohort 1 (FC data). For n, see Table S6.
Figure 4
Figure 4
Increased IFN-α and TNF signaling drive disease-severity-associated transcriptional programs in COVID-19 NK cells (A) Heatmap of genes of the intersection of the Hallmark IFN-α response and the previously calculated DEGs in cohort 1 (scRNA-seq) separated by disease severity and week after symptom onset. (B) AUCell-based enrichment of the Hallmark IFN-α response signature, and violin plots of the AUC scores per severity group and week after onset for all four cohorts (scRNA-seq). For cohorts 2 and 3, the enrichment of week 2 after symptom onset and for cohort 4 the enrichment of week 1 after symptom onset, together with controls, are shown, respectively. FDR-corrected KW p value is indicated. (C) Heatmap of SARS-CoV-2 nucleocapsid, immunoglobulin G (IgG), and plasma cytokines in samples from patients of cohort 1: control (n = 6), moderate COVID-19 (n = 8), and severe COVID-19 (n = 9). (D) Heatmap showing the Spearman correlation coefficients of Sequential Organ Failure Assessment (SOFA) score and WHO ordinal scale, with plasma cytokines of COVID-19 samples originating from week 1 after symptom onset (severe: n = 9, moderate: n = 9). Statistically significant correlations are indicated. (E) AUCell-based enrichment of the Hallmark IFN-α response signature, and violin plots of the AUC score of controls and severe COVID-19 samples stratified by disease outcome for cohort 1 (scRNA-seq) and cohort 2 (scRNA-seq). KW and Dunn’s multiple comparison test (ns: p > 0.05, p ≤ 0.05, ∗∗p ≤ 0.01, ∗∗∗p ≤ 0.001, ∗∗∗∗p ≤ 0.0001). (F) Heatmap of genes of the intersection of the Hallmark TNF signaling and the previously calculated DEGs in cohort 1 (scRNA-seq) separated by disease severity and week after symptom onset. (G) AUCell-based enrichment of the Hallmark TNF signaling signature, and violin plots of the AUC per severity group and week after onset for all four cohorts (scRNA-seq). For cohorts 2 and 3, the enrichments of week 2 after symptom onset and for cohort 4 the enrichment of week 1 after symptom onset, together with controls, are shown, respectively. FDR-corrected KW p value is indicated. (H) AUCell-based enrichment of the Hallmark TNF signaling signature, and violin plots of the AUC of controls and severe COVID-19 samples stratified by disease outcome for cohort 1 (scRNA-seq) and cohort 2 (scRNA-seq). KW and Dunn’s multiple comparison test (ns: p > 0.05, p ≤ 0.05, ∗∗p ≤ 0.01, ∗∗∗p ≤ 0.001, ∗∗∗∗p ≤ 0.0001). For n, see Table S6. (I) Relative expression of ISG Hallmark transcripts (MX-1, IFI6, and ISG15; 2-ΔCq values related to 2 housekeepers) in unstimulated (black line) or stimulated control NK cells with recombinant IFN-α (pink line: 1ng/ml; violet line: 10ng/ml) in combination with recombinant TNF (0, 10, or 25 ng/ml) for 18 h. (J) Relative expression of TNF Hallmark transcripts (MAP3K, TNF1IP3, and LITAF; Z scored data obtained from 2-ΔCq values related to 2 housekeepers) in unstimulated or stimulated control NK cells with TNF (10 ng/ml) alone or TNF (10 ng/ml) combined with IFN-α (1 ng/ml) for 18 h.
Figure 5
Figure 5
NK cells display anti-SARS-CoV-2 activity but are functionally impaired in COVID-19 (A) Schematic experimental setup. (B) Detection of IFN-γ, TNF-α production, and CD107a expression of CD56dim NK cells severe, n = 41. (C) Functional capacity of K562-stimulated CD56dim NK cells separated according to study groups and weeks after onset. (D) Detection of SARS-CoV-2 Spike protein in Caco-2 and Vero E6 cells cultured with or without control NK cells. (E) Detection of SARS-CoV-2 Spike protein in Caco-2 cells cultured with control versus COVID-19 NK cells. (F) Detection of SARS-CoV-2 Spike protein in Vero E6 cells cultured with control versus COVID-19 NK cells. (G) Detection of active caspase-3 in SARS-CoV-2-infected Caco-2 cells cultured with control versus COVID-19 NK cells. (H) Detection of active caspase-3 in SARS-CoV-2-infected Vero E6 cells cultured with control versus COVID-19 NK cells. (I) IFN-γ concentrations in cell culture supernatants obtained from (E) and (F). (J) TNF-ɑ concentrations in cell culture supernatants obtained from (E) and (F). Statistical analysis in (C)–(E): KW test corrected for multiple comparison by controlling FDR (BKY) was performed; ns, p ≤ 0.05; ∗∗p ≤ 0.01, ∗∗∗p ≤ 0.001, ∗∗∗∗p ≤ 0.0001. For n, see Table S6.
Figure 6
Figure 6
Soluble factors mediate COVID-19-associated NK cell dysfunction (A) Schematic experimental setup. (B) Effects of COVID-19 versus control plasma (severe, n = 27; moderate, n = 27) on NK cell IFN-γ production. (C) Effects of COVID-19 and control plasma on NK cell TNF production. (D) Pearson correlation between ex vivo IFN-γ or TNF production of K-562 stimulated NK cells of a specific COVID-19 patient and in vitro cytokine production of control NK following incubation with plasma of this same COVID-19 patient. (E) Effects of the indicated blocking antibodies on cytokine production of purified control NK cells incubated with plasma obtained from COVID-19 patients before stimulation with K562 cells. (F) Schematic experimental setup. (G) Effects of control versus COVID-19 plasma on functional capacity of severe COVID-19 NK cells. Statistical analysis in (A), (B), and (E): KW test corrected for multiple comparison by controlling FDR (BKY) was performed; ns, p ≤ 0.05; ∗∗p ≤ 0.01, ∗∗∗p ≤ 0.001, ∗∗∗∗p ≤ 0.0001. For n, see Table S6.
Figure 7
Figure 7
COVID-19 NK cells display impaired anti-fibrotic activity (A) Rank-rank analysis plot indicating commonly up- and downregulated genes. (B) Heatmap showing the average log FCs of commonly up- and downregulated genes identified in (A). (C) Violin plots showing AREG and CXCR4 gene expression. FDR-corrected KW p values are indicated. (D) CXCR4 expression (mean fluorescence intensity [MFI]) on CD56dim NK cells in week 3+ severe COVID-19 versus controls. Unpaired t test ∗∗∗p ≤ 0.001. (E) Frequency of amphiregulin(+) NK cells in week 3 severe COVID-19 versus controls control. Unpaired t test ∗∗∗p ≤ 0.001. (F) Amphiregulin expression on NK cells incubated with plasma. (G) CXCR4 expression on NK cells incubated with plasma. (H) Violin plots showing gene expression level of genes identified in (B). NSIP, non-specific interstitial pneumonia; IPF, idiopathic pulmonary fibrosis. KW and Dunn’s multiple comparison test (ns: p > 0.05, p ≤ 0.05, ∗∗p ≤ 0.01, ∗∗∗p ≤ 0.001, ∗∗∗∗p ≤ 0.0001). (I) mRNA expression of COL1A1 and ACTA-2 in human lung fibroblasts following co-incubation with or without NK cells (J) NK cell-mediated induction of active caspase-3 in human lung fibroblasts. Statistical analysis in (F) and (I): KW test corrected for multiple comparison by controlling FDR (BKY) was performed; ns, p ≤ 0.05; ∗∗p ≤ 0.01, ∗∗∗p ≤ 0.001, ∗∗∗∗p ≤ 0.0001. For n, see Table S6.

Comment in

  • Profiling natural killers in COVID-19.
    Mace EM. Mace EM. J Allergy Clin Immunol. 2022 Apr;149(4):1223-1224. doi: 10.1016/j.jaci.2022.01.002. Epub 2022 Jan 17. J Allergy Clin Immunol. 2022. PMID: 35051507 Free PMC article. No abstract available.

References

    1. Ahlenstiel G., Edlich B., Hogdal L.J., Rotman Y., Noureddin M., Feld J.J., Holz L.E., Titerence R.H., Liang T.J., Rehermann B. Early changes in natural killer cell function indicate virologic response to interferon therapy for hepatitis C. Gastroenterology. 2011;141:1231–1239.e1-2. - PMC - PubMed
    1. Aibar S., González-Blas C.B., Moerman T., Huynh-Thu V.A., Imrichova H., Hulselmans G., Rambow F., Marine J.-C., Geurts P., Aerts J., et al. SCENIC: single-cell regulatory network inference and clustering. Nat. Methods. 2017;14:1083–1086. - PMC - PubMed
    1. Alvarez M., Simonetta F., Baker J., Pierini A., Wenokur A.S., Morrison A.R., Murphy W.J., Negrin R.S. Regulation of murine NK cell exhaustion through the activation of the DNA damage repair pathway. JCI Insight. 2019;5:e127729. - PMC - PubMed
    1. Angerer P., Haghverdi L., Büttner M., Theis F.J., Marr C., Buettner F. destiny: diffusion maps for large-scale single-cell data in R. Bioinformatics. 2016;32:1241–1243. - PubMed
    1. Aran D., Looney A.P., Liu L., Wu E., Fong V., Hsu A., Chak S., Naikawadi R.P., Wolters P.J., Abate A.R., et al. Reference-based analysis of lung single-cell sequencing reveals a transitional profibrotic macrophage. Nature Immunology. 2019;20:163–172. - PMC - PubMed

Publication types