. 2021 Sep 30;9(1):162.
doi: 10.1186/s40478-021-01259-7.

Loss of presenilin function enhances tau phosphorylation and aggregation in mice

Affiliations

Loss of presenilin function enhances tau phosphorylation and aggregation in mice

Carlos M Soto-Faguás et al. Acta Neuropathol Commun. .

Abstract

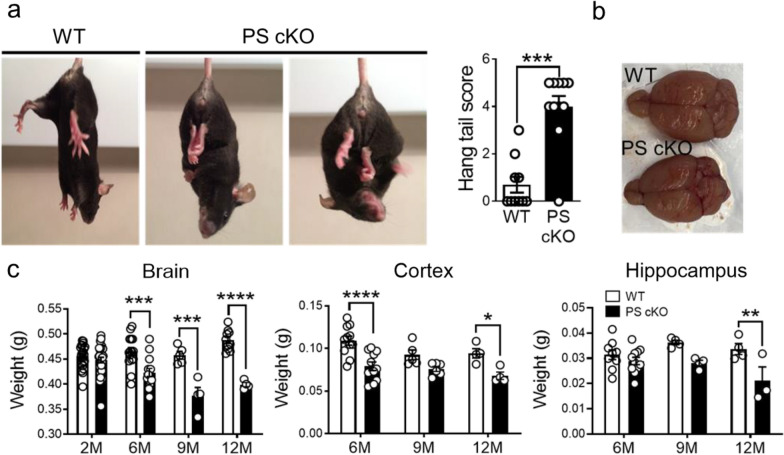
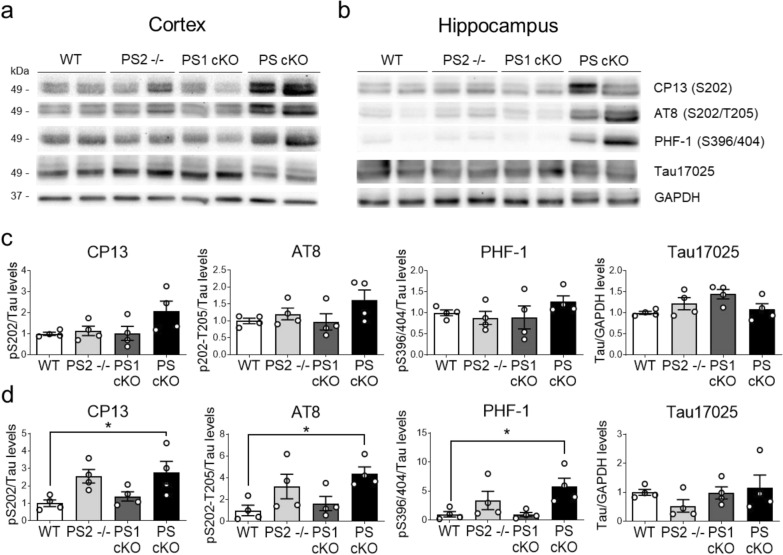
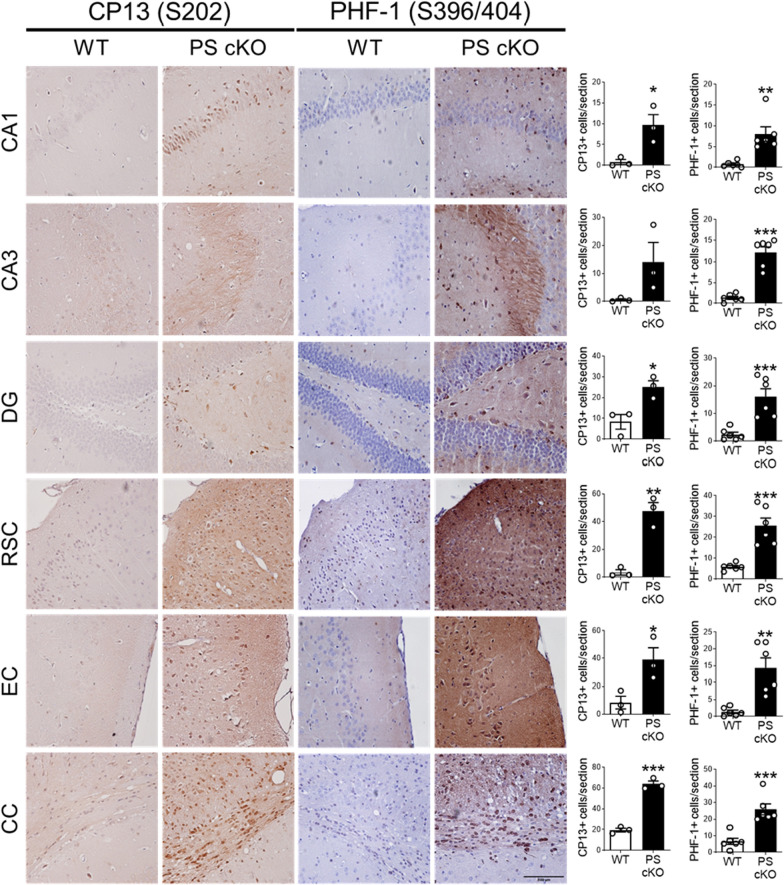
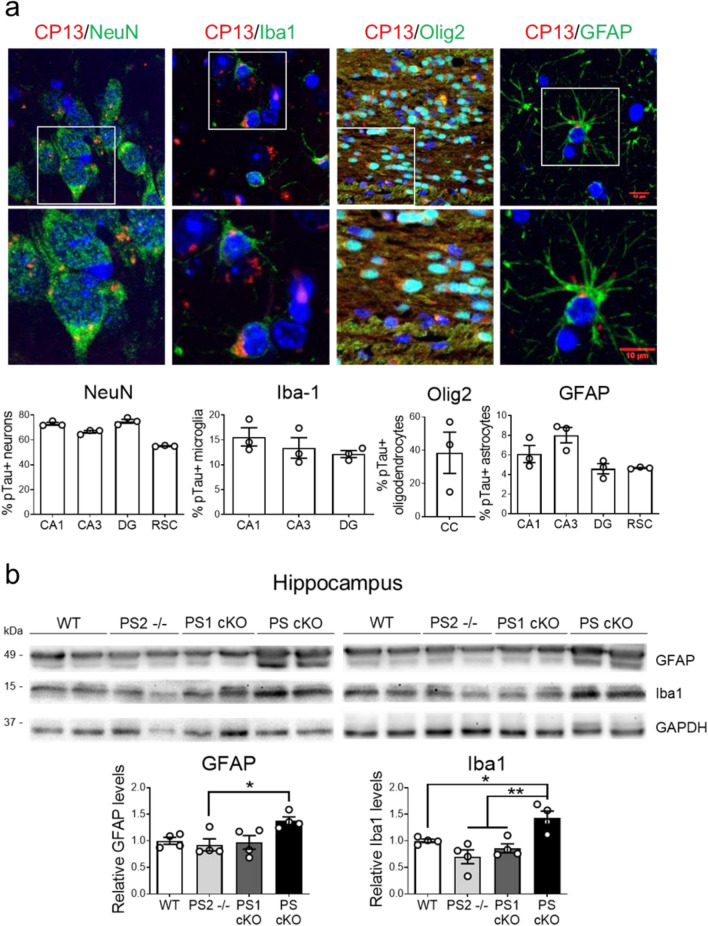
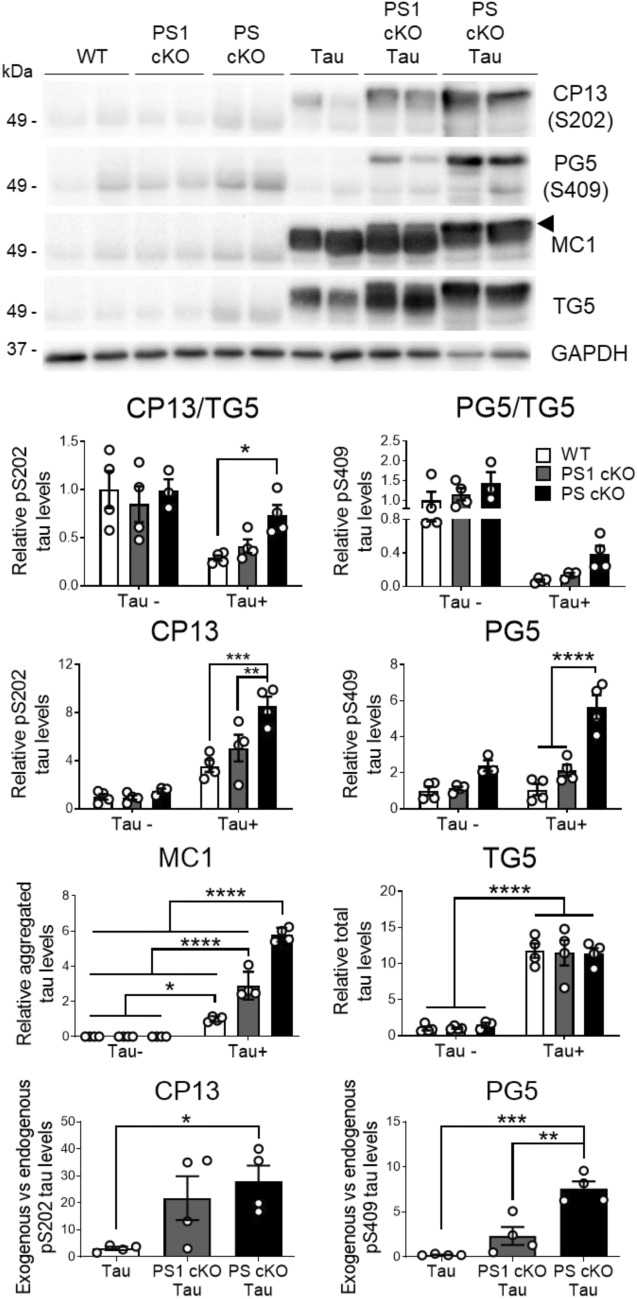
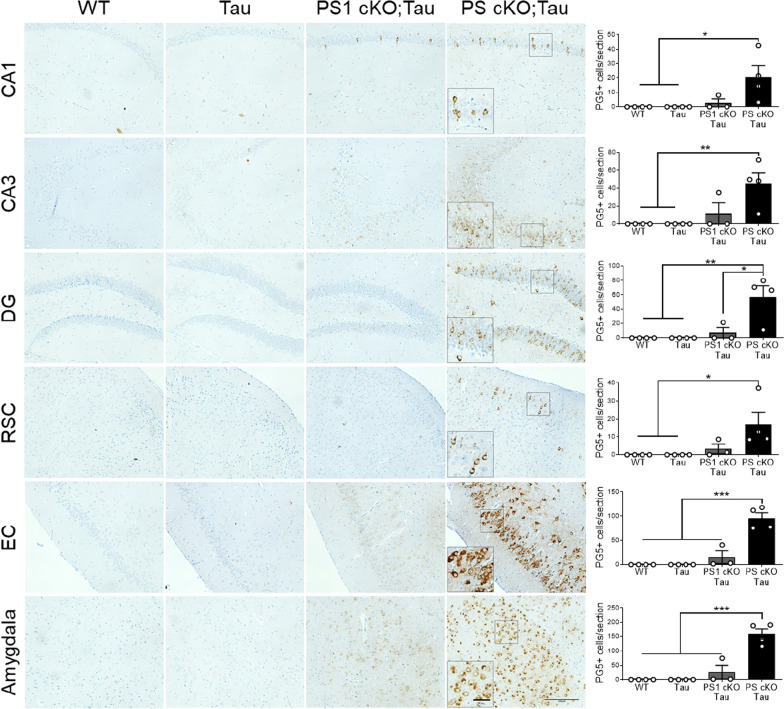
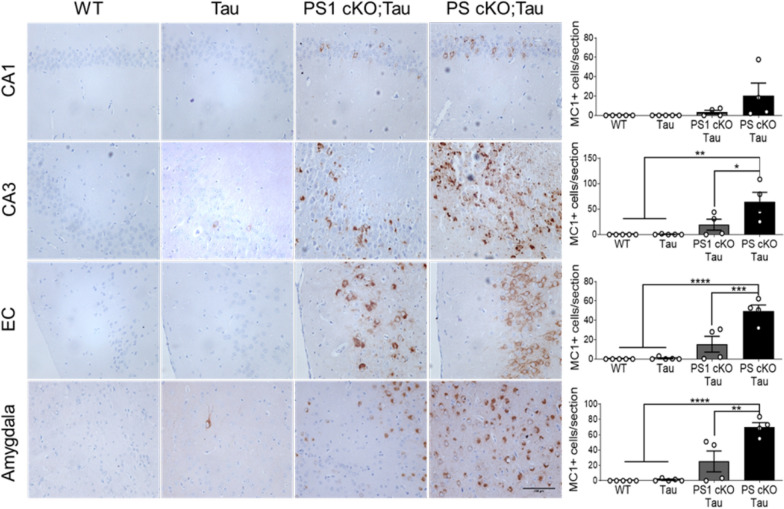
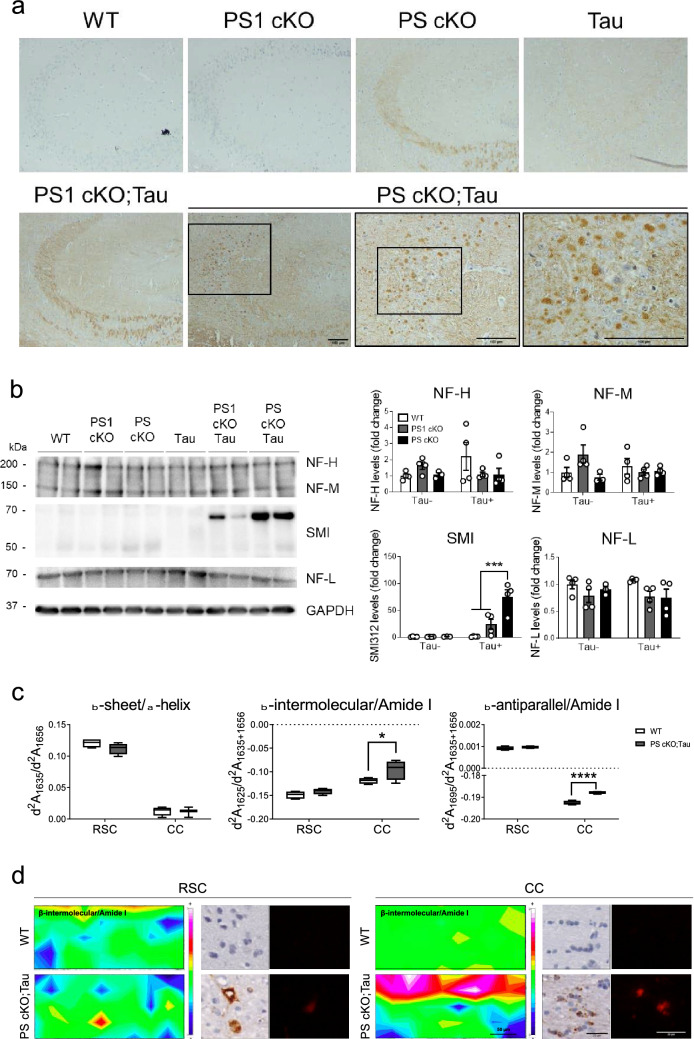
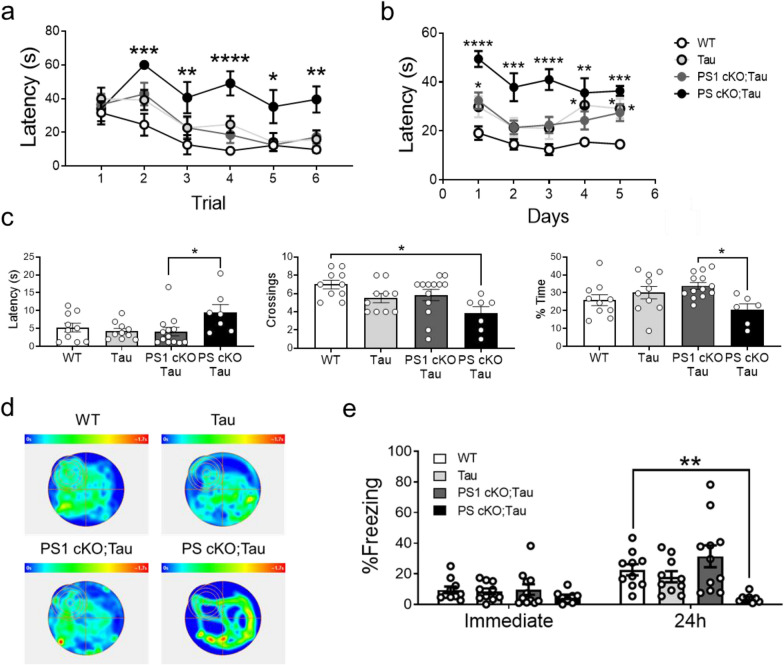
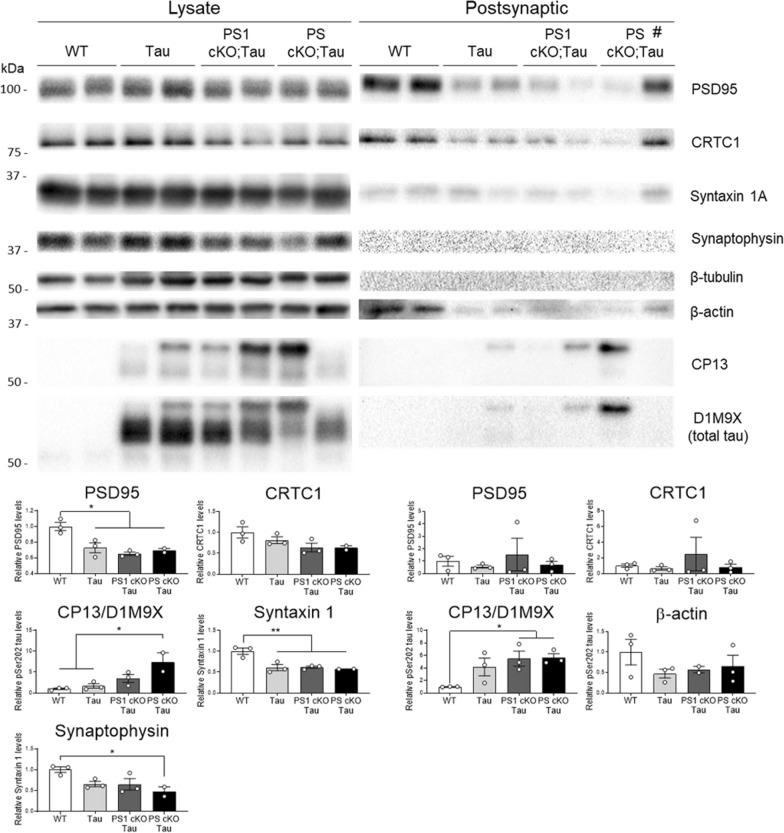
Mutations in the presenilin (PS/PSEN) genes encoding the catalytic components of γ-secretase accelerate amyloid-β (Aβ) and tau pathologies in familial Alzheimer's disease (AD). Although the mechanisms by which these mutations affect Aβ are well defined, the precise role PS/γ-secretase on tau pathology in neurodegeneration independently of Aβ is largely unclear. Here we report that neuronal PS deficiency in conditional knockout (cKO) mice results in age-dependent brain atrophy, inflammatory responses and accumulation of pathological tau in neurons and glial cells. Interestingly, genetic inactivation of presenilin 1 (PS1) or both PS genes in mutant human Tau transgenic mice exacerbates memory deficits by accelerating phosphorylation and aggregation of tau in excitatory neurons of vulnerable AD brain regions (e.g., hippocampus, cortex and amygdala). Remarkably, neurofilament (NF) light chain (NF-L) and phosphorylated NF are abnormally accumulated in the brain of Tau mice lacking PS. Synchrotron infrared microspectroscopy revealed aggregated and oligomeric β-sheet structures in amyloid plaque-free PS-deficient Tau mice. Hippocampal-dependent memory deficits are associated with synaptic tau accumulation and reduction of pre- and post-synaptic proteins in Tau mice. Thus, partial loss of PS/γ-secretase in neurons results in temporal- and spatial-dependent tau aggregation associated with memory deficits and neurodegeneration. Our findings show that tau phosphorylation and aggregation are key pathological processes that may underlie neurodegeneration caused by familial AD-linked PSEN mutations.

Keywords: Alzheimer’s disease; Memory; Neurofilament; Presenilin; Synapse; Tau; β-sheet aggregation; γ-secretase.


Conflict of interest statement

The authors declare no financial competing conflicts of interest in relation to this work.

Figures

Fig. 1
Fig. 1
Loss of PS causes behavioral abnormalities and age-dependent neurodegeneration in mice. a Clasping and postural alterations in PS cKO mice at 9 months of age. Tail suspension test reveals that PS cKO mice show severe clasping behavior, as observed in PS cKO mice scoring 4 (left image) and 5 (right picture). Quantification graph: Statistical differences in hang tail score in PS cKO mice at 9 months. b Decreased brain size, especially the cortical hemispheres in PS cKO mice. c Age-dependent brain atrophy in PS cKO mice. Total brain (left), cortex (middle) and hippocampus (right) weights are reduced in PS cKO mice during aging (2 to 12 months). Values represent mean ± s.e.m (n = 4–30 mice/group). Statistical analysis was determined by two-way ANOVA followed by Sidak’s post hoc tests. *P < 0.05, ** P < 0.01 and ***P < 0.001 compared to control (WT) mice
Fig. 2
Fig. 2
Dose-dependent presenilin effects on tau phosphorylation. Biochemical analysis showing increased tau phosphorylation in the cortex and hippocampus of PS cKO mice. Western blot images (top) and quantitative analysis (bottom) of protein lysates of cortex (a, c) and hippocampus (b, d) of WT, PS2−/−, PS1 cKO and PS cKO mice at 9 months of age. Western blotting was performed using antibodies against total tau (Tau17025) and anti-phosphorylated tau: Ser202 (CP13), Ser202/Thr205 (AT8) and Ser396/404 (PHF-1) tau. Phosphorylated tau levels were normalized to total tau. Tau17025 was incubated in the CP13 membrane after stripping. Values represent mean ± s.e.m. (n = 4 mice/group). Statistical analysis was determined by one-way ANOVA followed by Tukey’s post hoc tests. *P < 0.05
Fig. 3
Fig. 3
Absence of PS increases tau phosphorylation in memory-related brain regions. Left: Representative immunohistochemical images of phosphorylated Ser202 (CP13, left) and Ser396/404 (PHF-1, right) tau in 12 month-old control (WT) and PS cKO mice. Scale bar: 100 µm. Right: Quantitative analysis of total intensity and number of positive cells of CP13 (left) and PHF-1 (right) immunohistochemistry. Values represent mean ± s.e.m. (n = 3 slices/mice, 3 mice/group). Statistical analysis was determined by unpaired student’s t-test. *P < 0.05, **P < 0.01, ***P < 0.001. Abbreviations: CA1/CA3 hippocampus; CC, corpus callosum; DG, dentate gyrus; EC, entorhinal cortex; RSC, restrosplenial cortex
Fig. 4
Fig. 4
Inflammatory responses and accumulation of pathological tau in neurons and glial cells in PS cKO mice. a Representative immunohistological images and quantification (% of positive cells) showing accumulation of phosphorylated tau (CP13: Ser202, red) in neurons (NeuN, green), microglia (Iba1, green), oligodendrocytes (Olig2, green) and astrocytes (GFAP, green) of PS cKO mice at 12 months. Scale bar: 10 µm. Data represent percentage of pTau-positive cells ± s.e.m. (n = 3 mice/group, n = 5 sections/mouse). b Inflammatory responses in PS cKO mice. Western blot images (top) and quantitative analysis (bottom) of GFAP, Iba1 and GAPDH in control (WT), PS1 cKO, PS2−/− and PS cKO mice at 9 months of age. Protein levels were normalized to GAPDH. Data represent relative fold levels ± s.e.m. (n = 4 mice/group). Statistical analysis was determined by one-way ANOVA followed by Tukey’s post hoc test. *P < 0.05, ** P < 0.001 compared to the indicated group
Fig. 5
Fig. 5
Lack of PS increases human tau phosphorylation and aggregation in the hippocampus. Biochemical analysis of phosphorylated tau in the hippocampus of WT, PS1 cKO, PS cKO, Tau, PS1 cKO;Tau and PS cKO;Tau mice at 6 months of age. Western blotting was performed using antibodies against human tau (TG5), phosphorylated tau (CP13: Ser202; PG5: Ser409), and aggregated tau (MC1). TG5 was incubated in the same membrane of CP13 blotting after stripping. The arrowhead indicates the quantified MC1-labeled high molecular weight aggregated tau species. Quantification of exogenous (human) vs endogenous (murine) phosphorylated tau levels are shown at the bottom. Phosphorylated and total tau levels are normalized to GAPDH. Values represent mean ± s.e.m. (n = 4 mice/group). Statistical analysis was determined by one-way ANOVA followed by Tukey’s post hoc tests. *P < 0.05, ** P < 0.001, *** P < 0.0001
Fig. 6
Fig. 6
Increased pathological PKA-mediated tau phosphorylation in Tau mice lacking PS. Left: Representative immunohistochemical images of phosphorylated tau (PG5: pSer409) in 6 month-old non- and tau transgenic mice. Inset: magnified images showing somatic PG5 staining in PS cKO;Tau brains. Scale bar: 100 μm. Right: Quantitative analysis of number of PG5-positive cells/section in the indicated brain region in littermate control (WT), Tau, PS1 cKO;Tau and PS cKO;Tau mice. Values represent mean PG5-positive cells ± s.e.m. (3 slices per mouse, 4–5 mice/group). Statistical analysis was determined by two-way ANOVA followed by Tukey’s post hoc tests. *P < 0.05, **P < 0.01, ***P < 0.001. Abbreviations: Amygdala: basolateral amygdala; CA1/CA3 hippocampus; DG, dentate gyrus; EC, entorhinal cortex; RSC, retrosplenial cortex
Fig. 7
Fig. 7
MC1 staining reveals aggregated human tau in Tau mice lacking PS1 and both PS. Immunohistochemical images (left) and quantitative analysis (right) of MC1 stained sections in 6 month-old control (WT), Tau, PS1 cKO;Tau and PS cKO;Tau mice. Scale bar: 100 μm. Values represent mean of MC1-positive cells/section ± s.e.m. (n = 3 slices per mouse, 4 mice/group). Statistical analysis was determined by one-way ANOVA followed by Tukey’s post hoc tests. *P < 0.05, **P < 0.01, ***P < 0.001, ****P < 0.0001. Abbreviations: Amygdala: basolateral amygdala; CA1/CA3 hippocampus; EC, entorhinal cortex ,
Fig. 8
Fig. 8
PS deficiency causes abnormal NF levels and pathological β-sheet protein structures. a Representative immunohistological images of NF-L in the hippocampus of 6 month-old WT, PS1 cKO, PS cKO, Tau, PS1 cKO;Tau and PS cKO;Tau mice. Insets: magnified images indicated by squares showing prominent NF-L somatic staining in hippocampal neurons of PS cKO;Tau mice. Scale bar = 100 μm. b Left: Biochemical analysis of hippocampal lysates using SMI312 (NF-M/H) and NF-L antibodies. Right: Quantification of NF-H (~ 200 kDa), NF-M (~ 150 kDa), SMI-labeled (~ 60–70 kDa) and NF-L (~ 70 kDa) bands in independent membranes. Protein levels were normalized to GAPDH. Values represent mean ± s.e.m. (n = 4 mice/group). Statistical analysis was determined by two-way ANOVA followed by Tukey’s post hoc tests. ***P < 0.001. c Synchrotron-based µFTIR analysis of the retrosplenial cortex (RSC) and corpus callosum (CC) of WT and PS cKO;Tau mice at 6 months of age. Second derivative absorbances (d2A) of β-sheet/α-helix (d2A1635/d2A1656), and β-intermolecular/Amide I (d2A1625/d2A1635+1656) and β-antiparallel/Amide I (d2A1695/d2A1635+1656) protein structures. Values represent the minimum, the maximum and the median of the average of 100 spectra/mouse (n = 4 mice/group). Statistical analysis was determined by one-way ANOVA followed by Sidak’s post hoc tests. *P < 0.05, ***P < 0.001, ****P < 0.0001. d Representative infrared heat maps of β-intermolecular/Amide I (left images; scale bar = 50 μm) and consecutive immunohistological sections of aggregated tau  detected by MC1 staining (middle images) and Congo red staining (right images; scale bar = 25 μm) in the RSC and CC of WT and PS cKO;Tau mice.
Fig. 9
Fig. 9
Loss of PS function causes hippocampal-dependent memory deficits in Tau transgenic mice. Morris water maze and CFC was performed with 6 month-old WT, Tau, PS1 cKO;Tau and PS cKO;Tau mice. a Visible platform phase consisted in six trials and platform latency in seconds was measured. b During learning phase, which consisted in six trials during five consecutive days, latency to the platform in seconds was measured. c Latency to the first entry to the target quadrant in seconds, number of crossings to the target quadrant and percentage of time in the target quadrant in the first 30 s of the test were analyzed. d Representative heat map of each analyzed group during the probe test. e CFC showing the percentage of freezing time immediately and 24 h after conditioning. Values represent mean % freezing time ± s.e.m. (n = 7–10 mice/group). Statistical analysis was determined by one or two-way ANOVA followed by Tukey’s post hoc tests. *P < 0.05, **P < 0.01, ***P < 0.001, ****P < 0.0001
Fig. 10
Fig. 10
Reduced synaptic proteins and accumulation of synaptic tau in PS-deficient Tau mice. Western blot images (top) and quantification (bottom) of synaptic proteins and phosphorylated Ser202 (CP13) and total (D1M9X) tau in hippocampal lysates (left) and purified postsynaptic fractions (right) of WT, Tau, PS1 cKO;Tau and PS cKO;Tau mice at 6 months. # indicates a young 3 month-old PS cKO;Tau mouse. Protein levels were normalized to β-tubulin in the lysates and total loaded protein (1 μg) in postsynaptic fractions. D1M9X antibody was used for reblotting after CP13 membrane stripping. Notice the lack of typical presynaptic proteins (syntaxin 1A, synaptophysin, β-tubulin) in the postsynaptic fractions. Values represent mean fold ± s.e.m. (n = 3 mice/group). Statistical analysis was determined by one-way ANOVA followed by Tukey’s post hoc tests. *P < 0.05

References

    1. Arriagada PV, Growdon JH, Hedley-Whyte ET, Hyman BT. Neurofibrillary tangles but not senile plaques parallel duration and severity of Alzheimer's disease. Neurology. 1992;42:631–639. doi: 10.1212/WNL.42.3.631. - DOI - PubMed
    1. Benseny-Cases N, Cocera M, Cladera J. Conversion of non-fibrillar β-sheet oligomers into amyloid fibrils in Alzheimer's disease amyloid peptide aggregation. Biochem Biophys Res Commun. 2007;361:916–921. doi: 10.1016/j.bbrc.2007.07.082. - DOI - PubMed
    1. Benseny-Cases N, Klementieva O, Cotte M, Ferrer I, Cladera J. Microspectroscopy (muFTIR) reveals co-localization of lipid oxidation and amyloid plaques in human Alzheimer disease brains. Anal Chem. 2014;86:12047–12054. doi: 10.1021/ac502667b. - DOI - PubMed
    1. Bernardi L, Tomaino C, Anfossi M, Gallo M, Geracitano S, Costanzo A, Colao R, Puccio G, Frangipane F, Curcio SA, et al. Novel PSEN1 and PGRN mutations in early-onset familial frontotemporal dementia. Neurobiol Aging. 2009;30:1825–1833. doi: 10.1016/j.neurobiolaging.2008.01.005. - DOI - PubMed
    1. Berriman J, Serpell LC, Oberg KA, Fink AL, Goedert M, Crowther RA. Tau filaments from human brain and from in vitro assembly of recombinant protein show cross-beta structure. Proc Natl Acad Sci U S A. 2003;100:9034–9038. doi: 10.1073/pnas.1530287100. - DOI - PMC - PubMed

Publication types

LinkOut - more resources