. 2021 Nov 9;8(6):ENEURO.0338-21.2021.
doi: 10.1523/ENEURO.0338-21.2021. Print 2021 Nov-Dec.

Frequency-Dependent Action of Neuromodulation

Affiliations

Frequency-Dependent Action of Neuromodulation

Anna C Schneider et al. eNeuro. .

Abstract

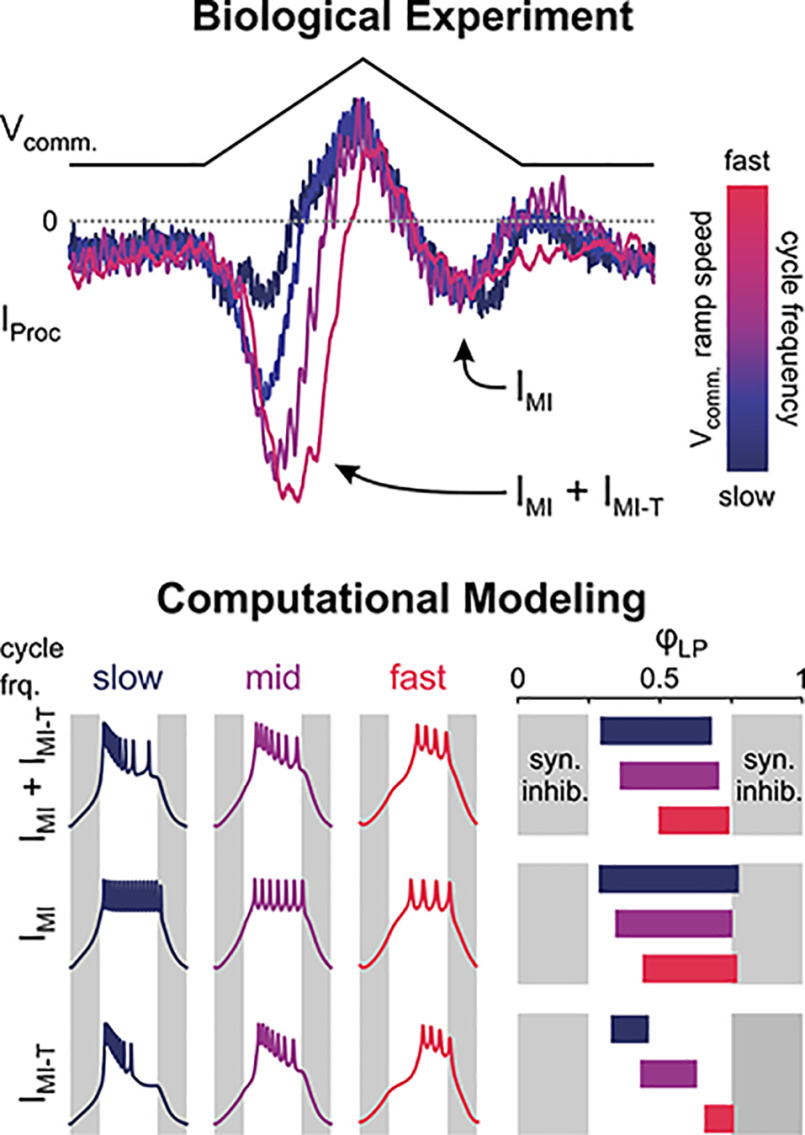
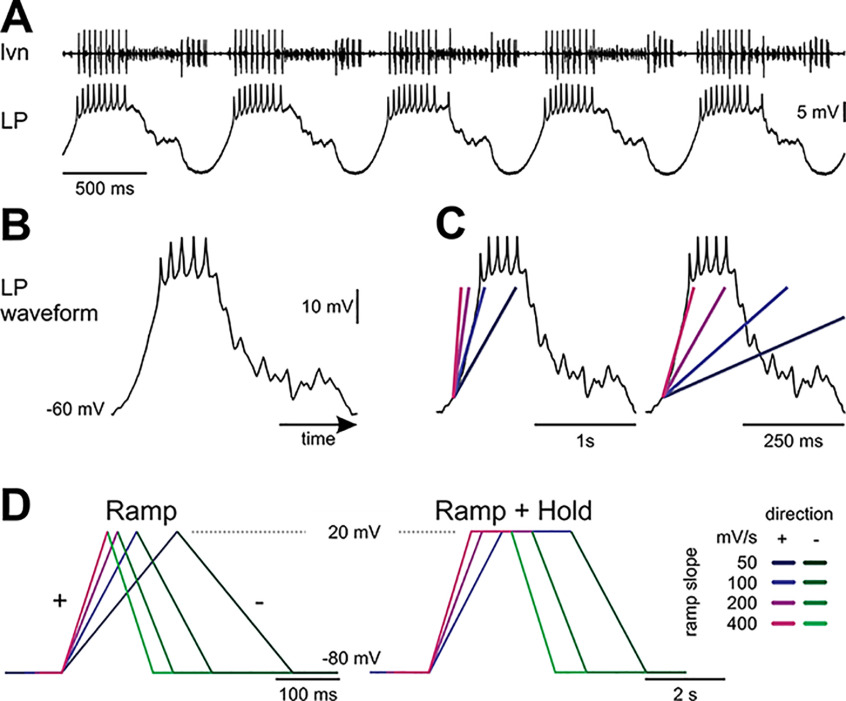
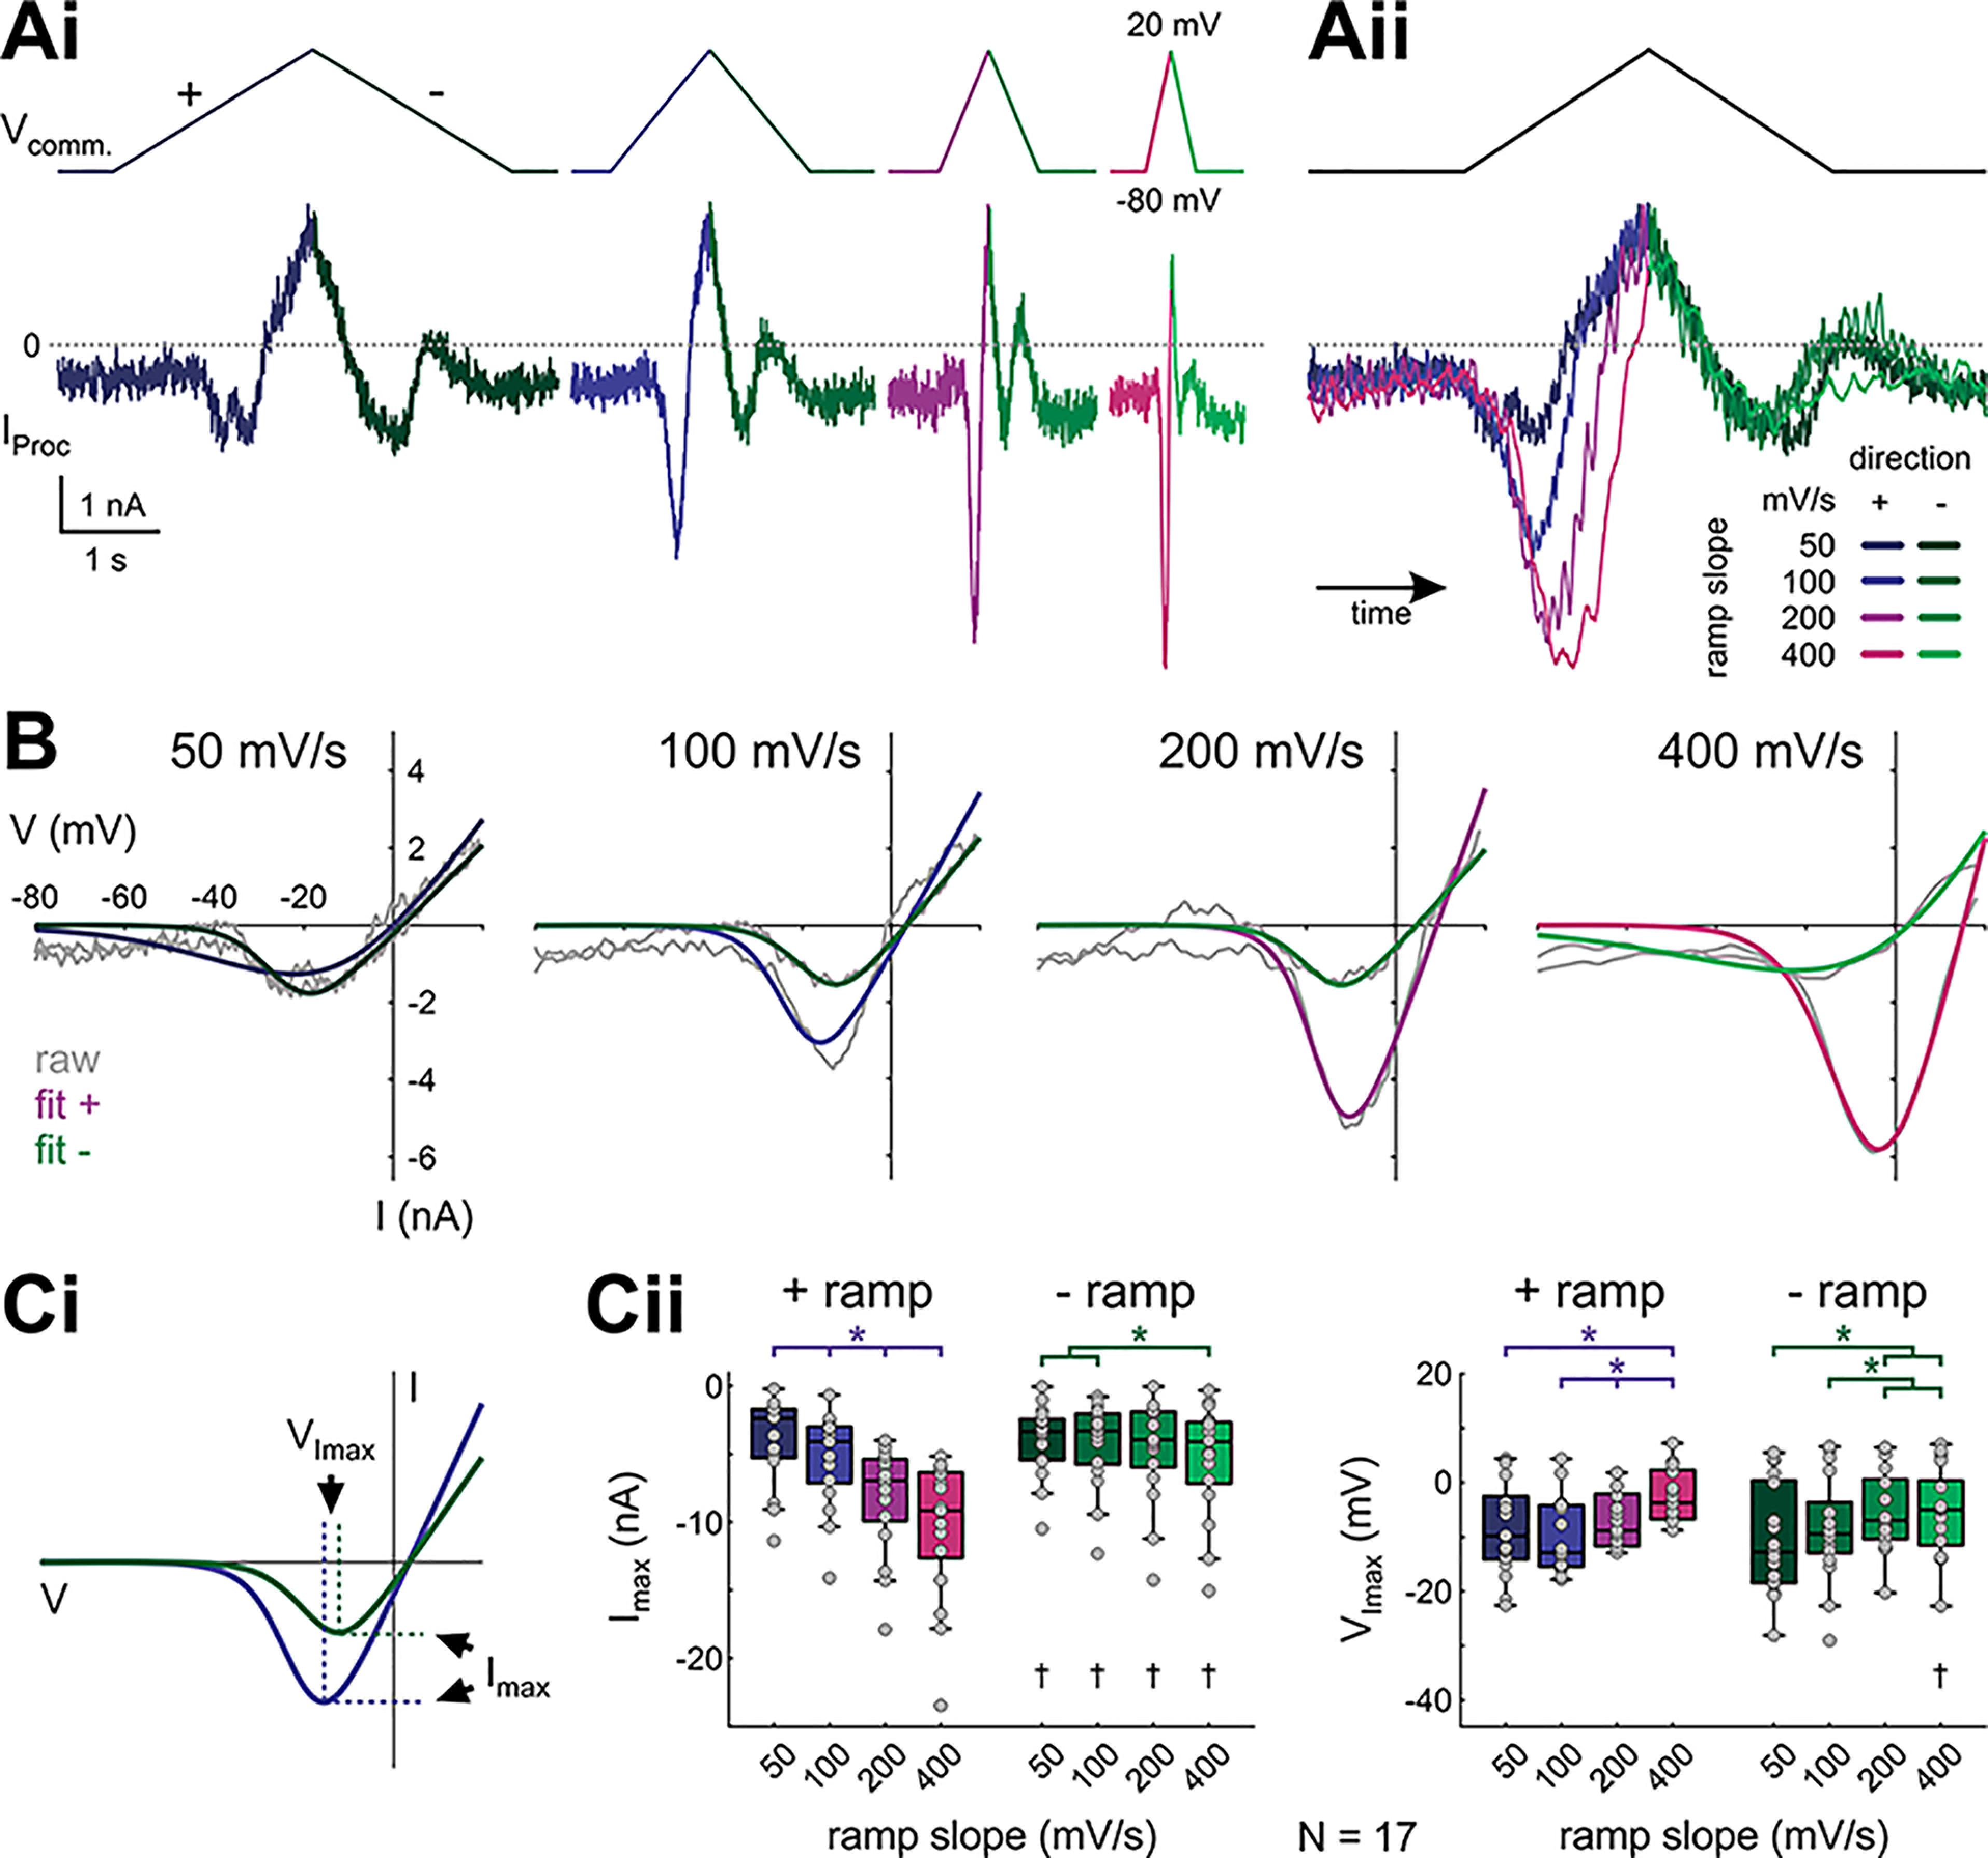
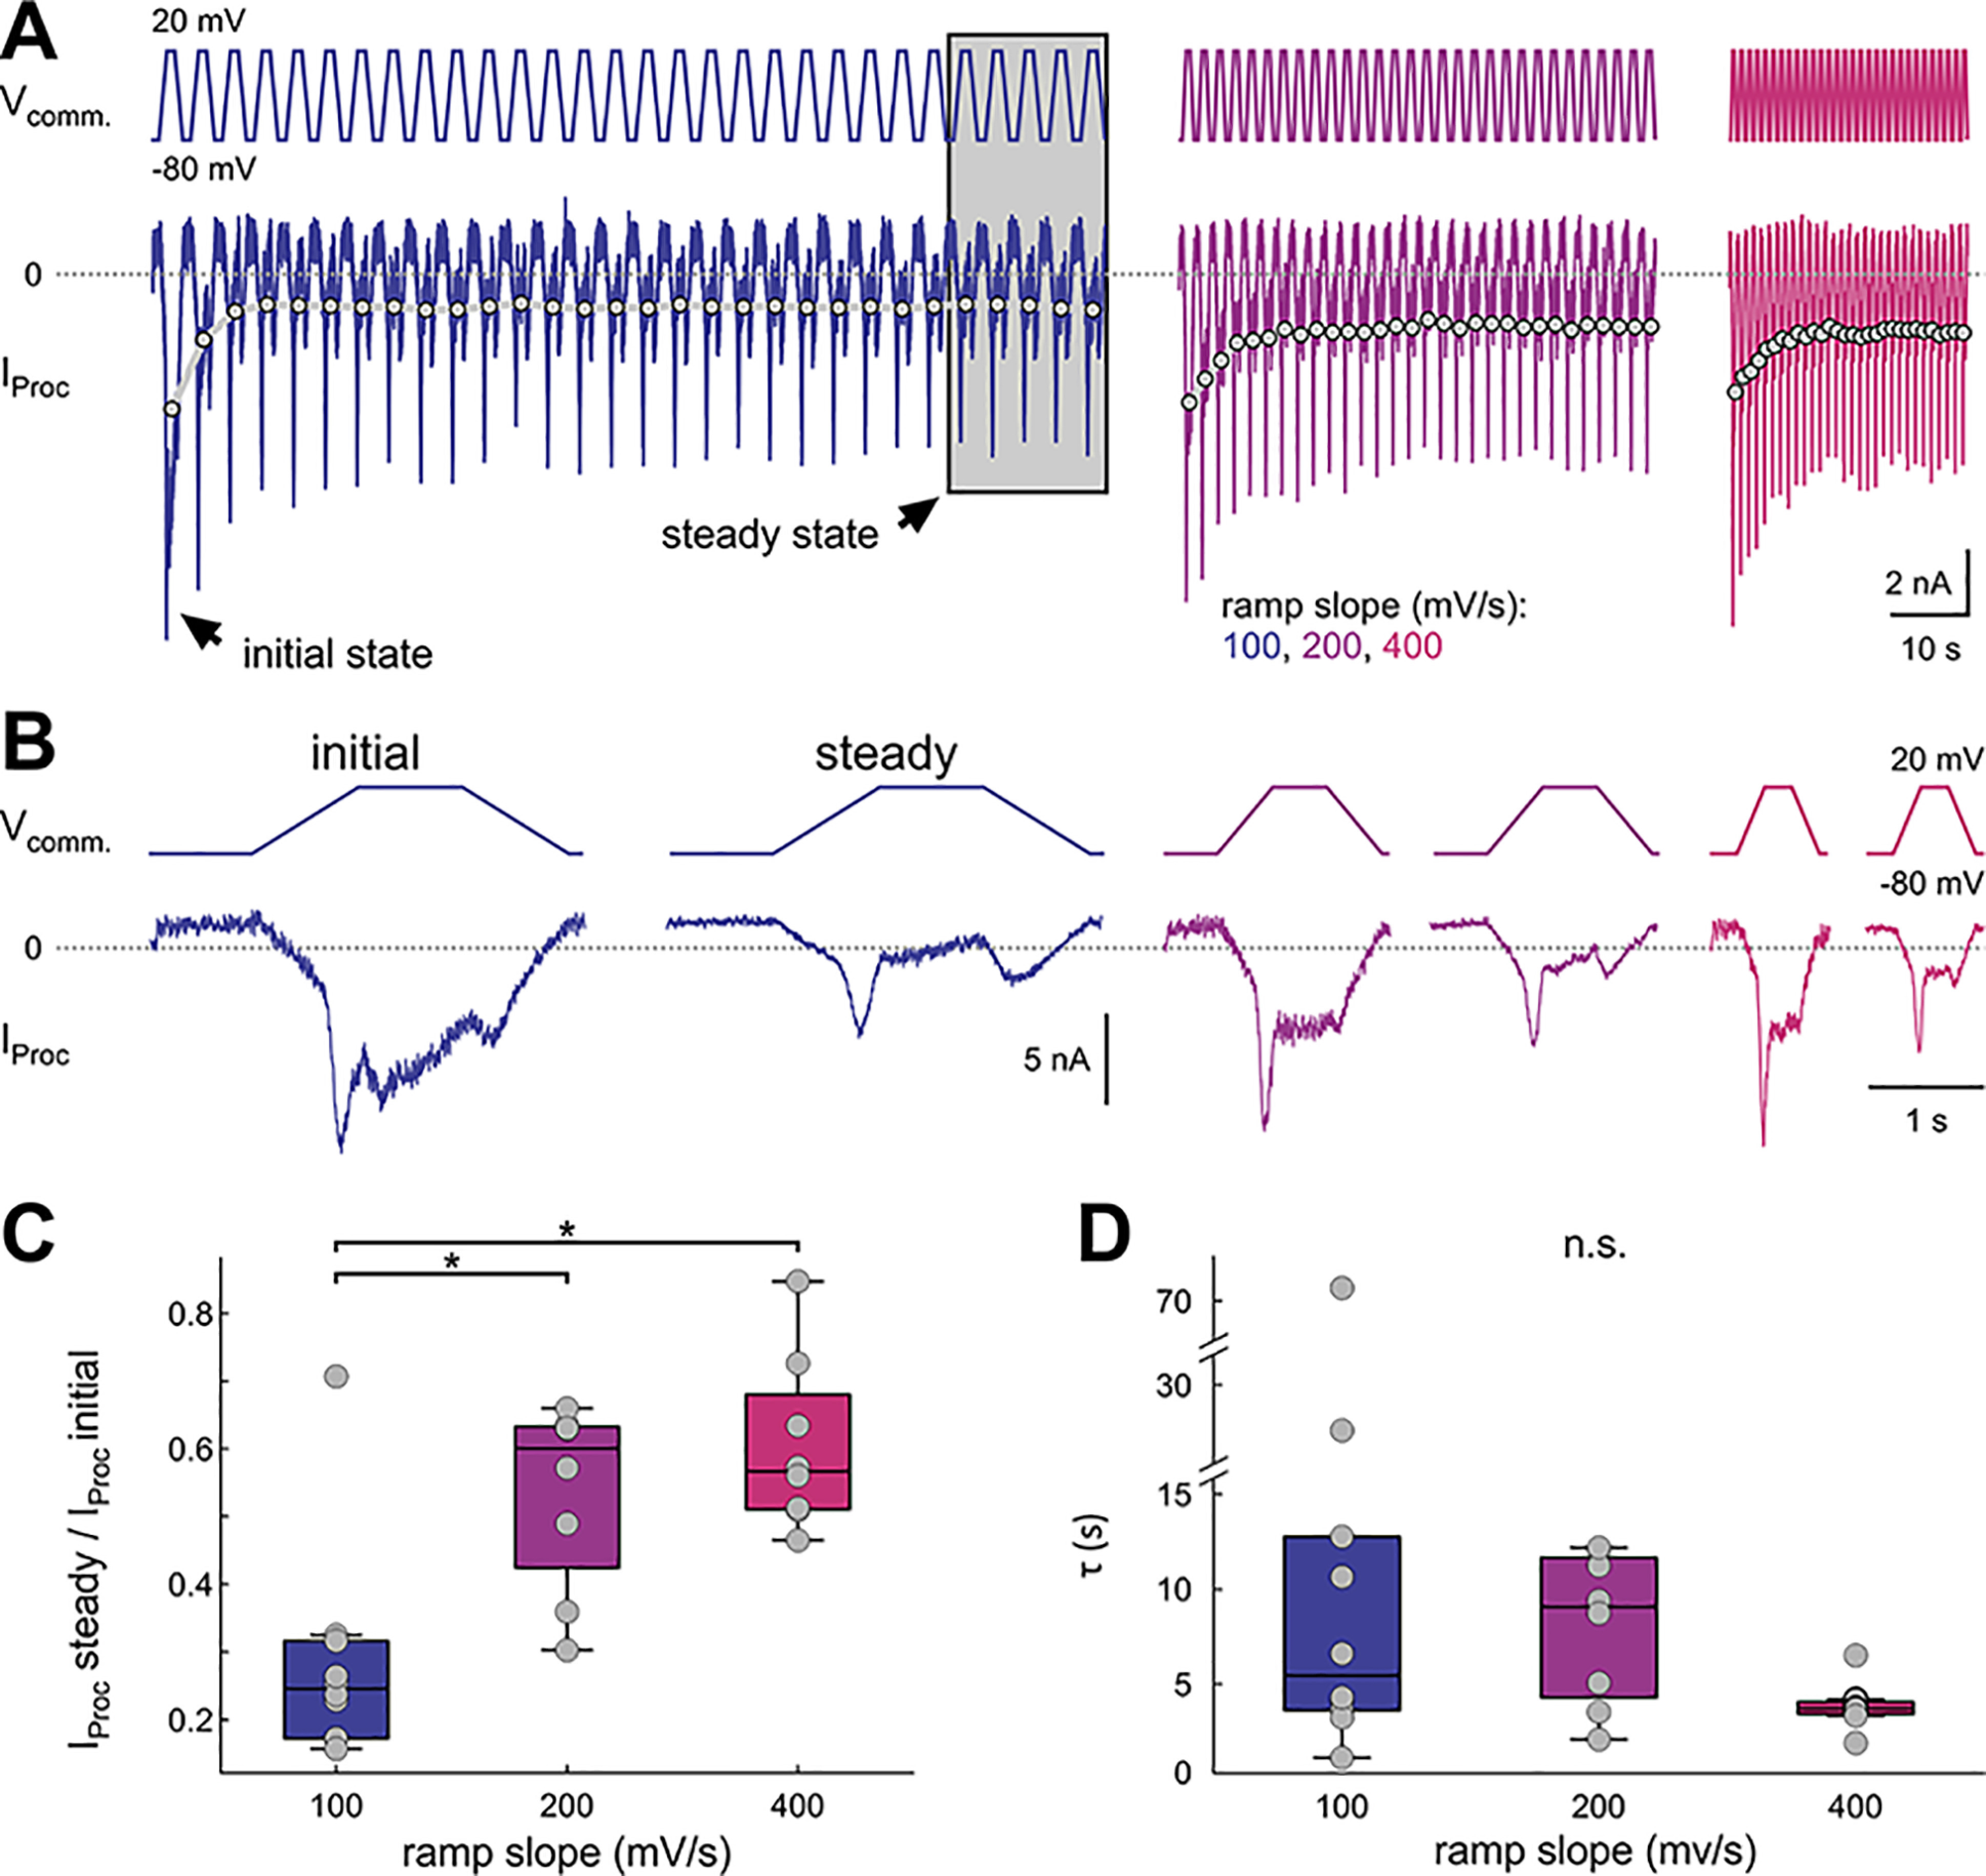
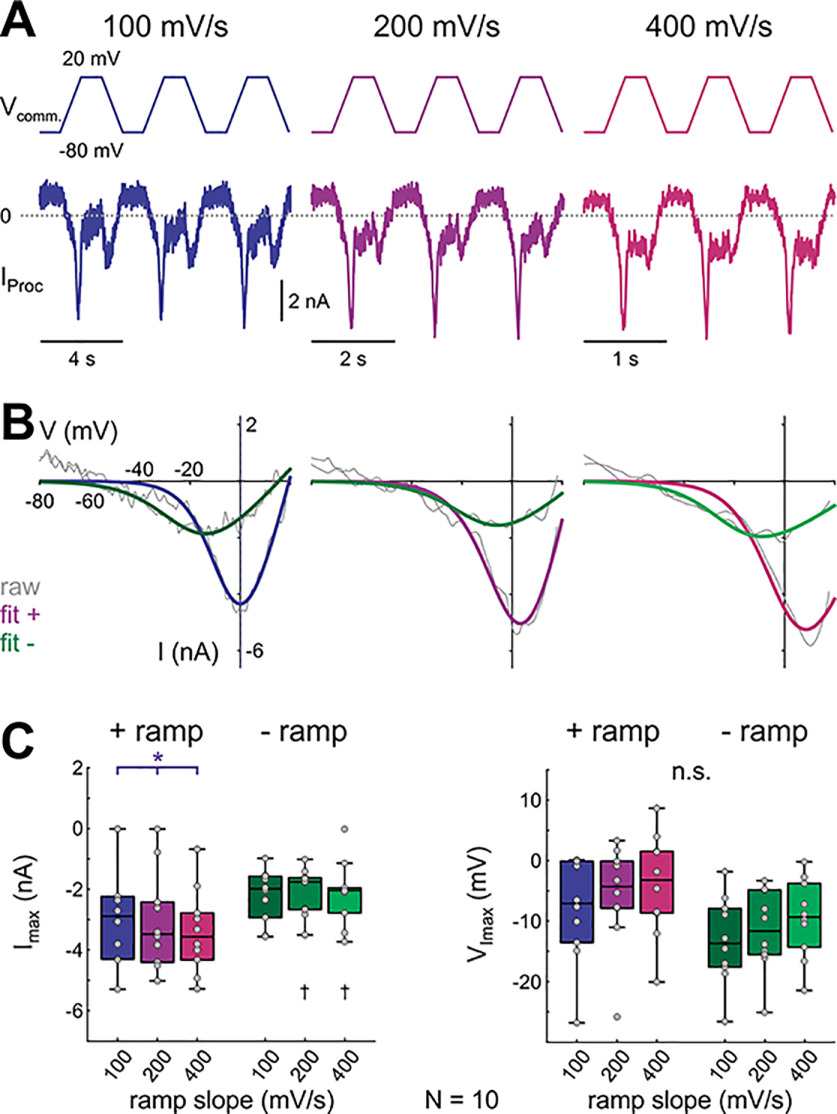
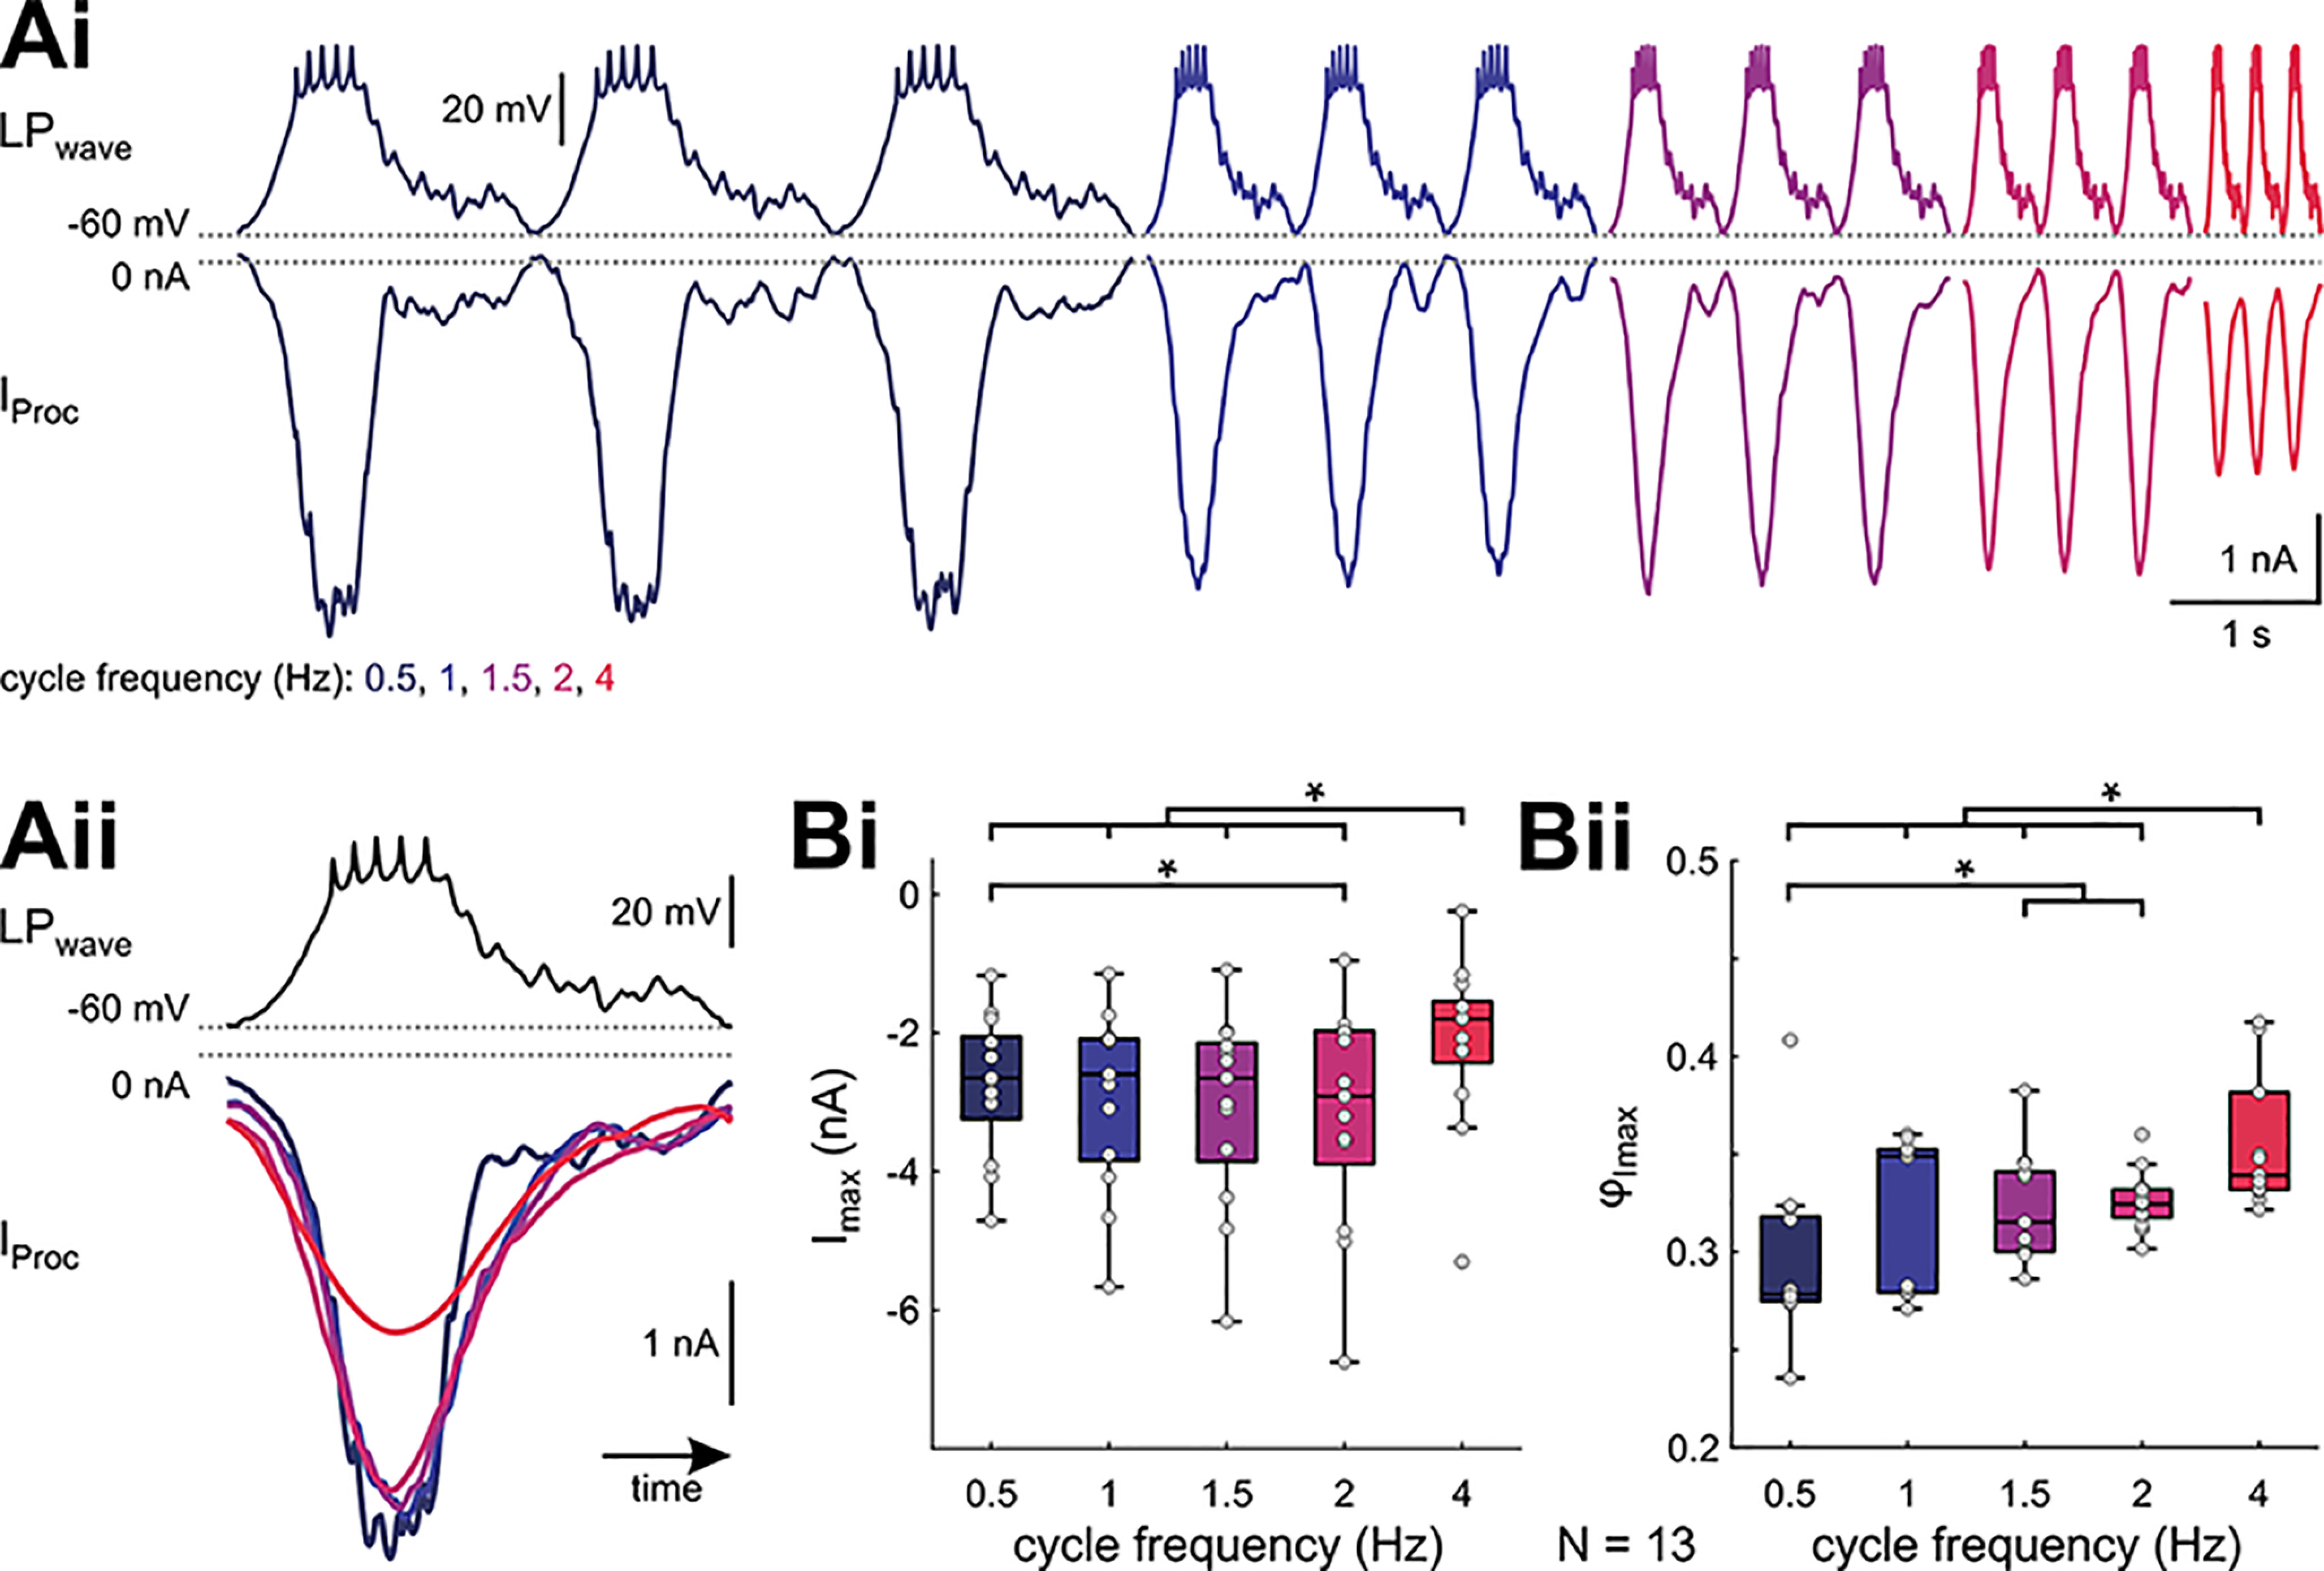
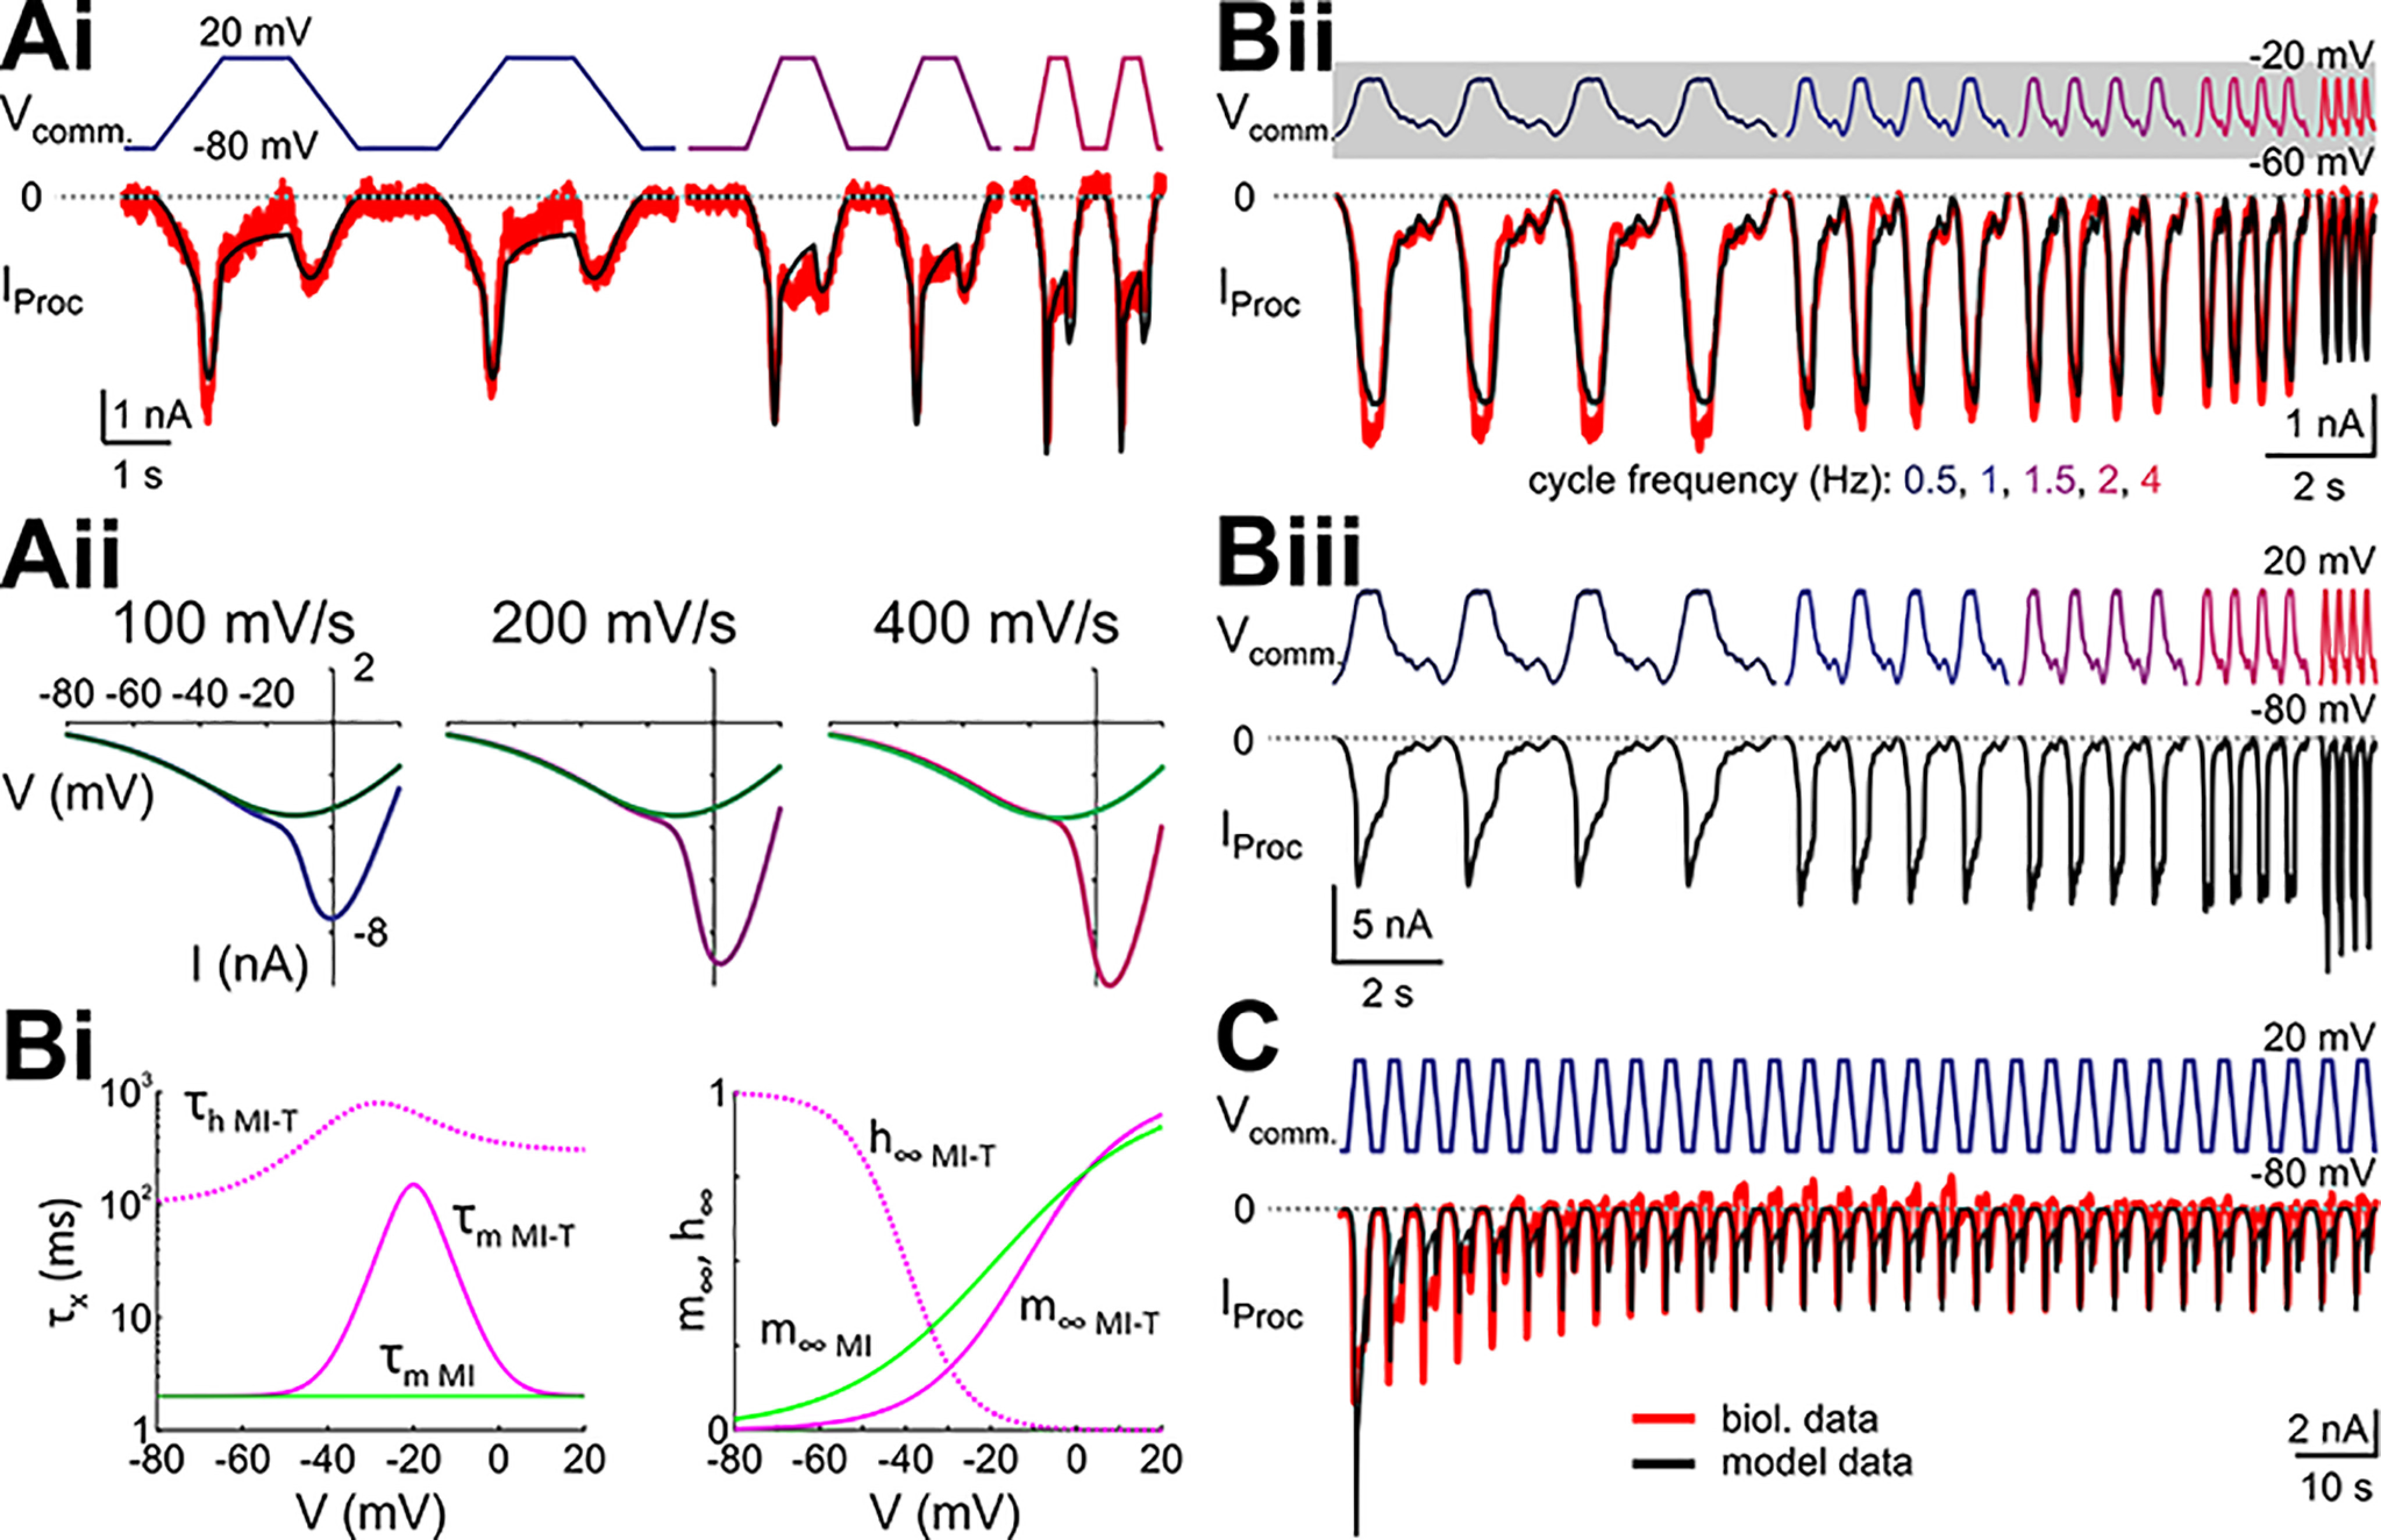
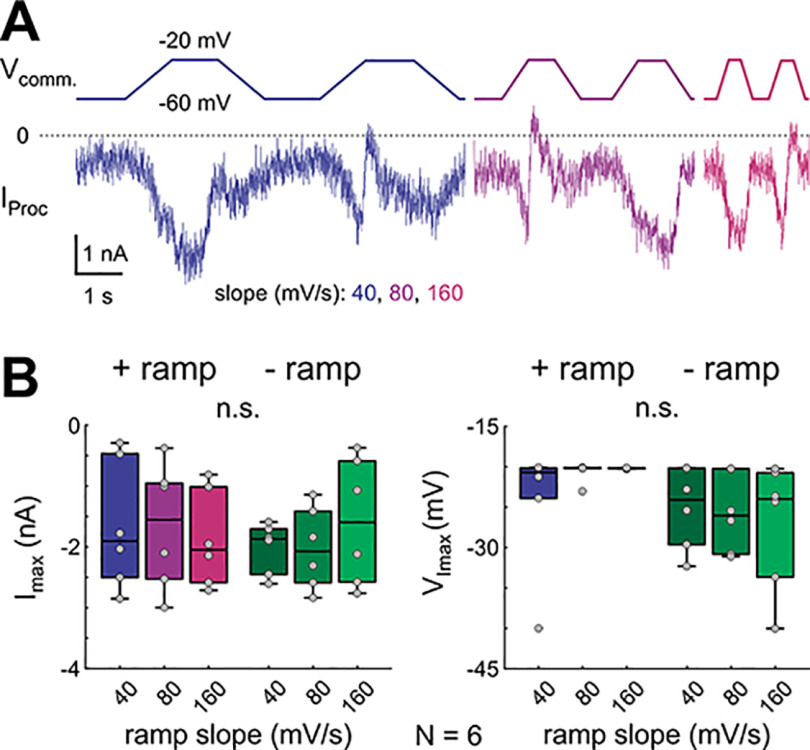
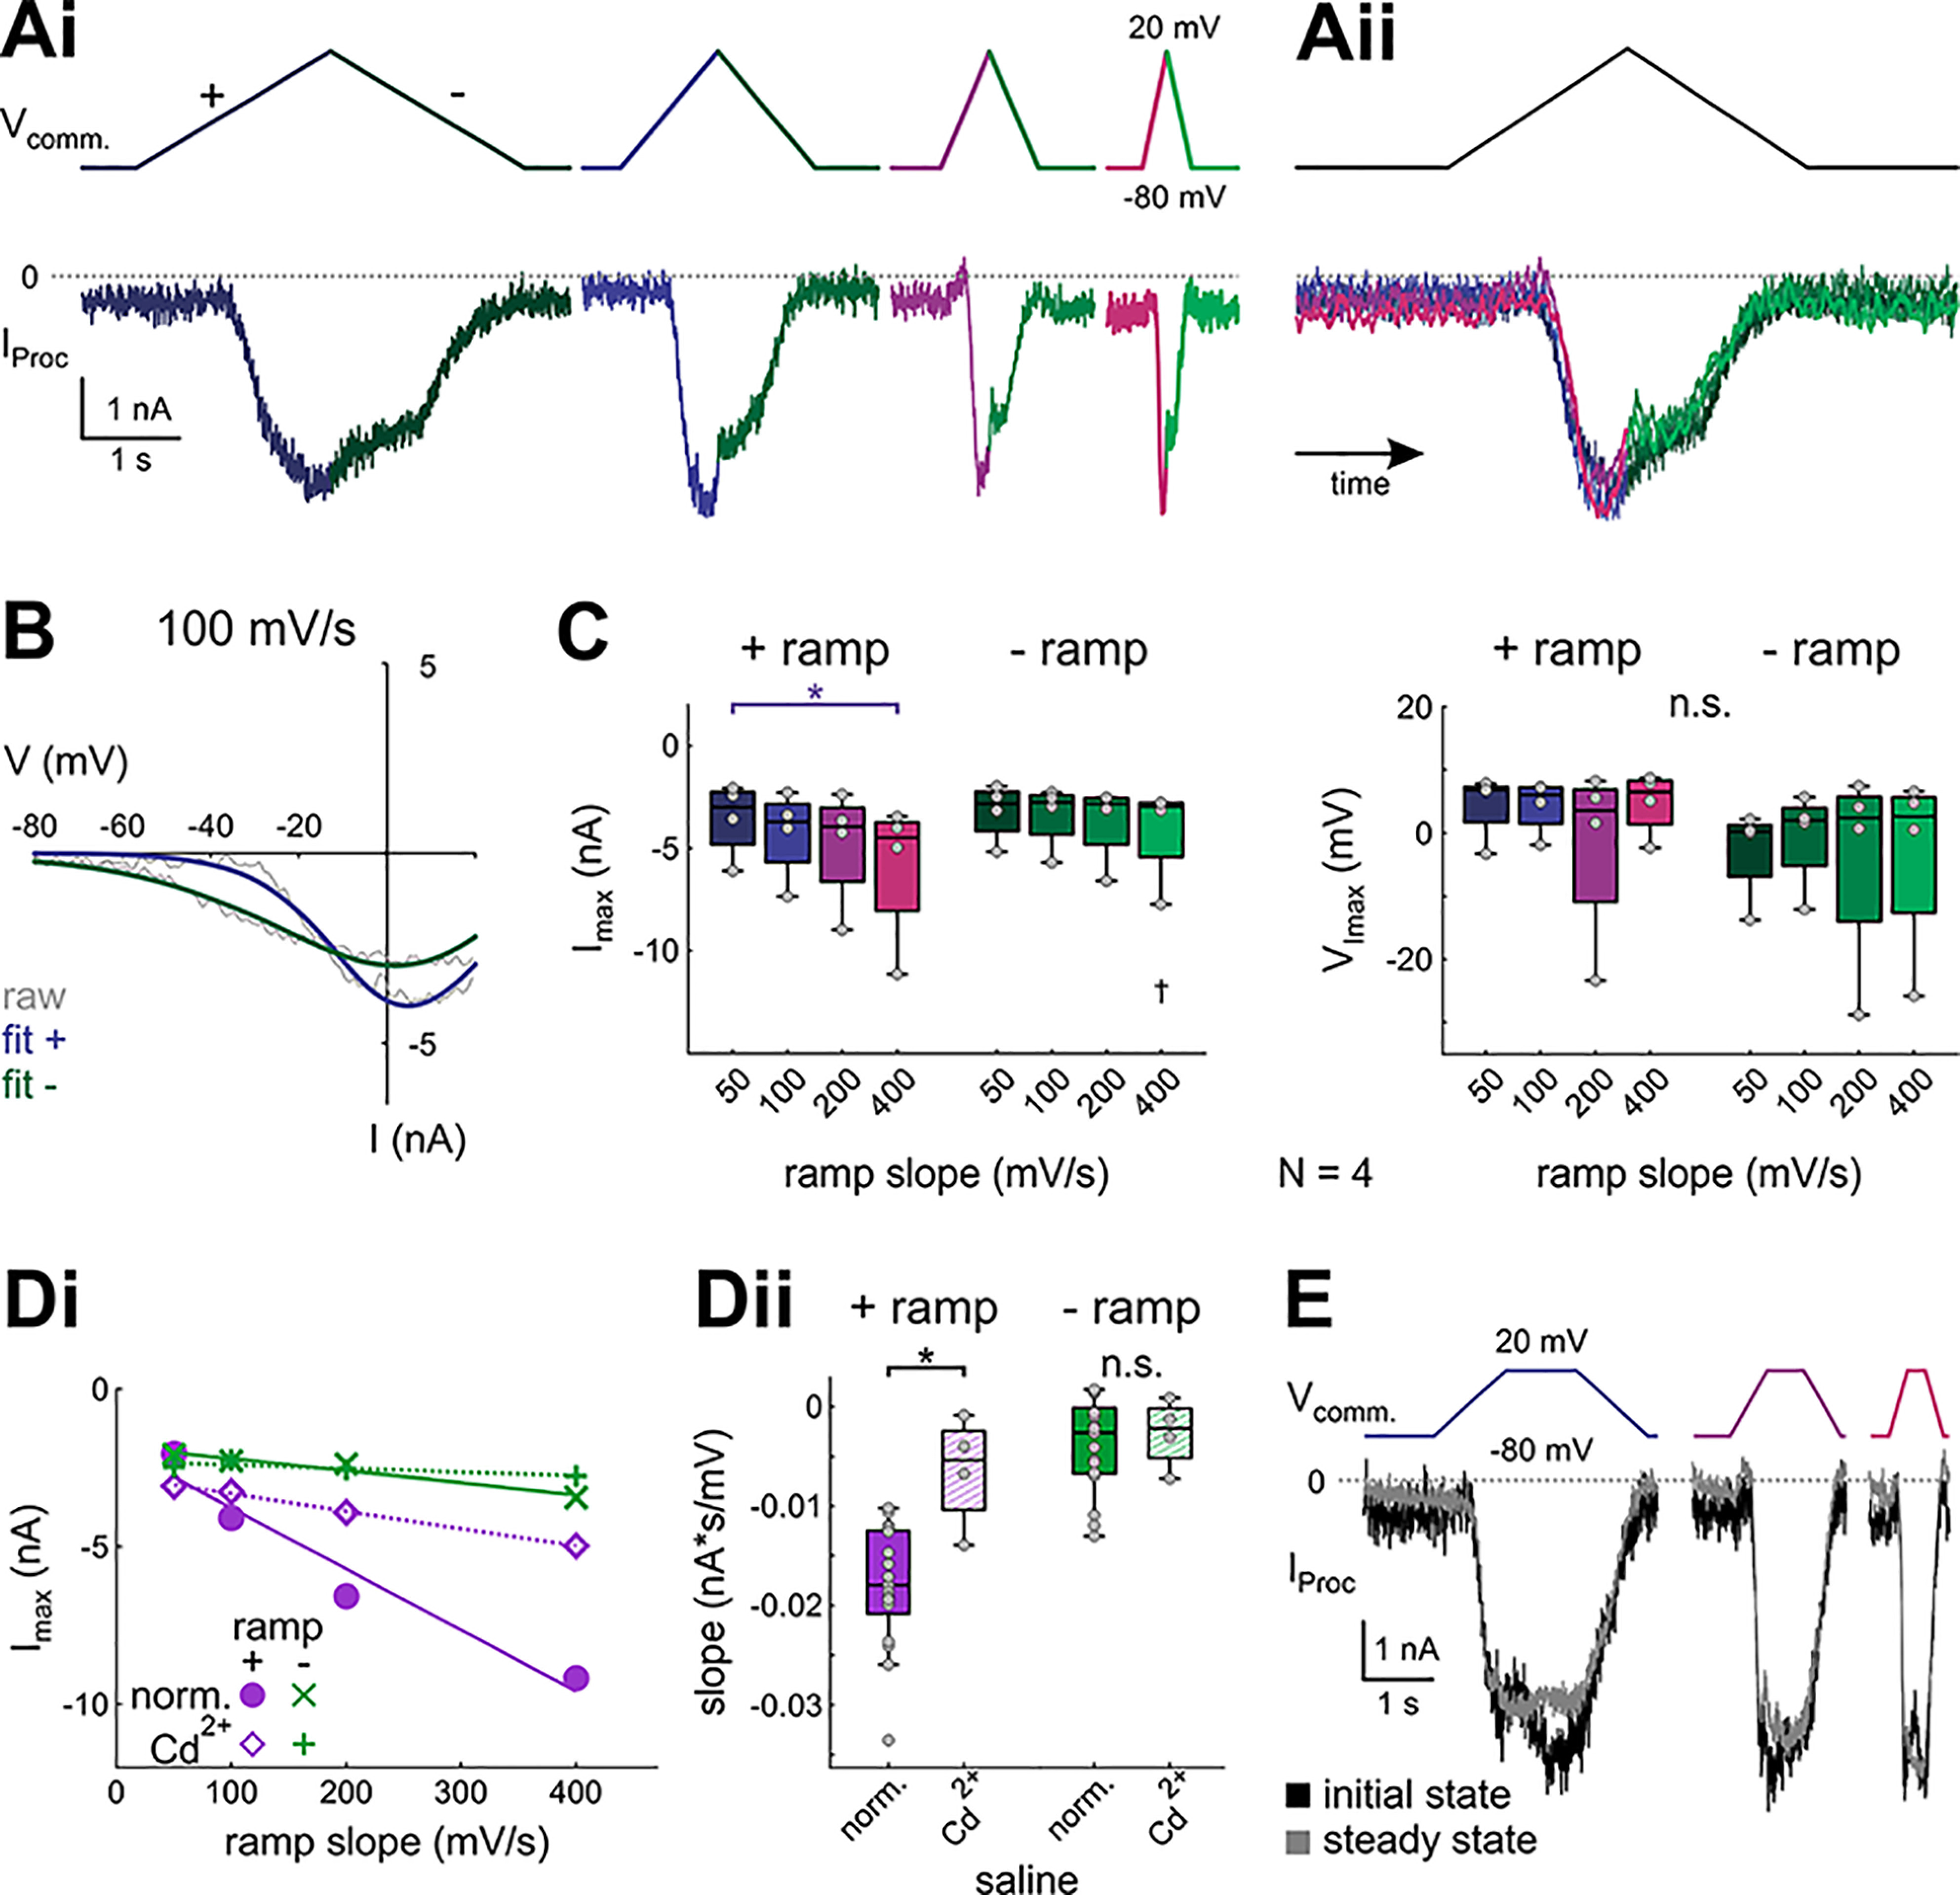
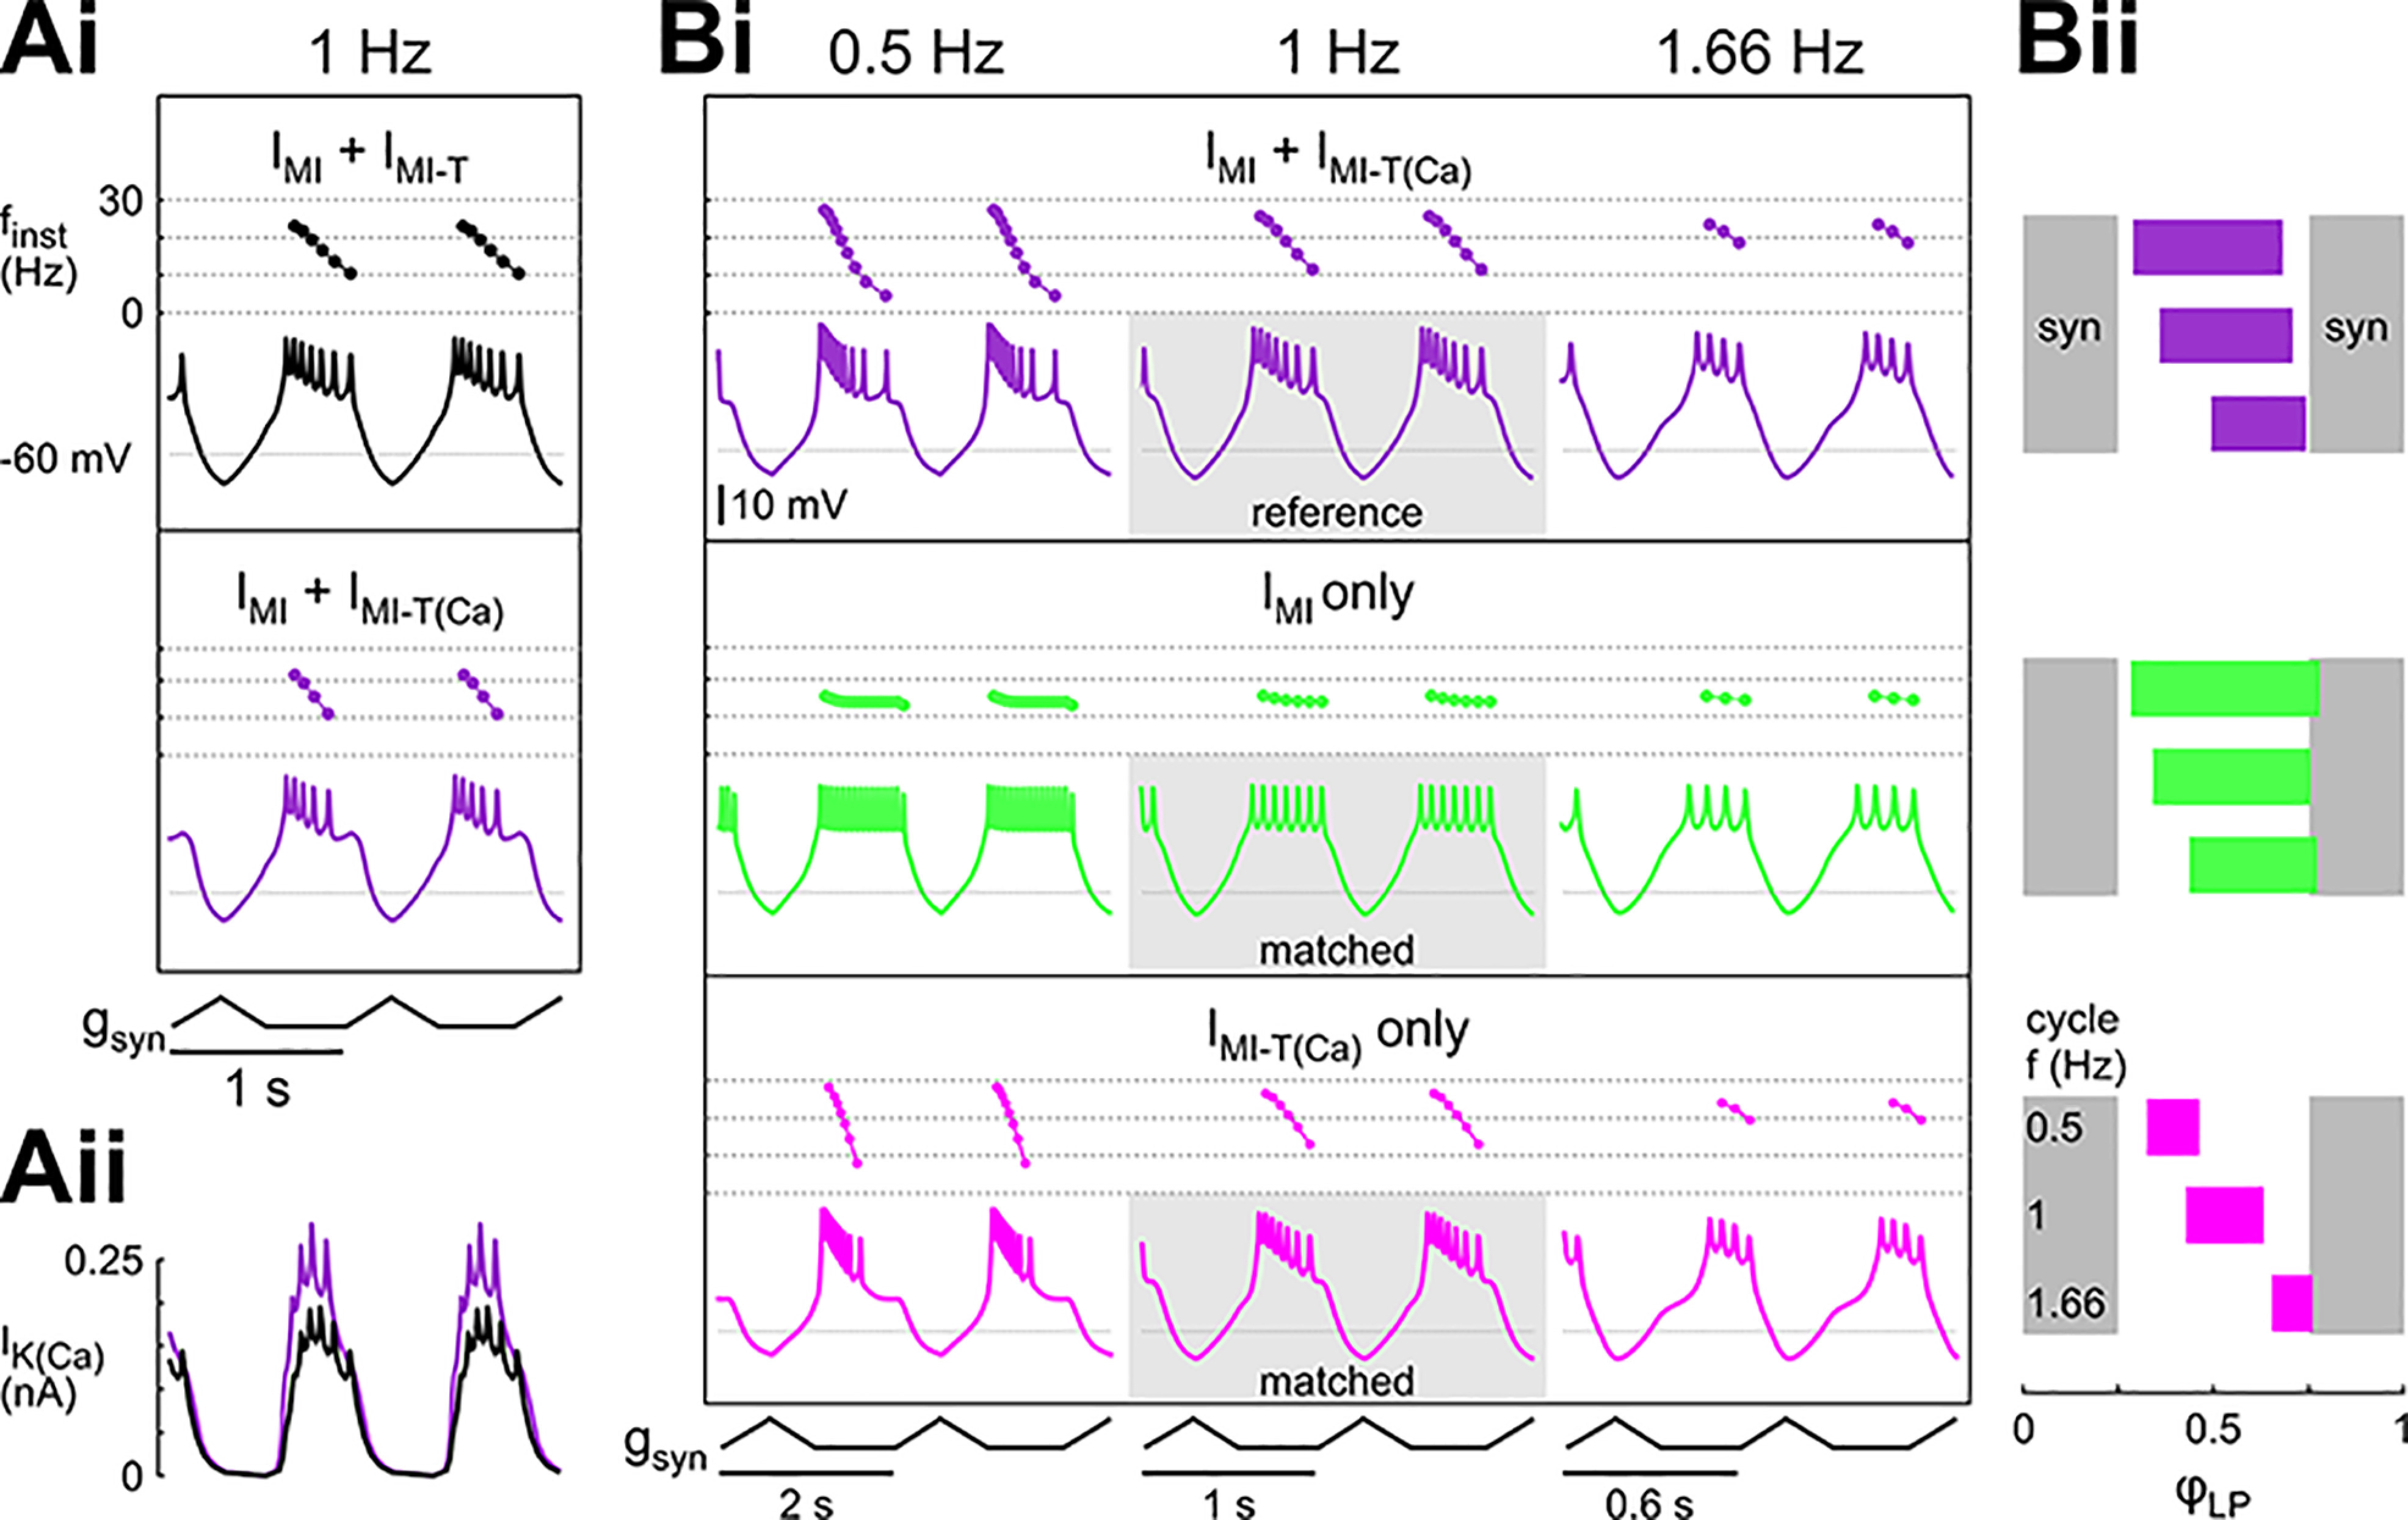
In oscillatory circuits, some actions of neuromodulators depend on the oscillation frequency. However, the mechanisms are poorly understood. We explored this problem by characterizing neuromodulation of the lateral pyloric (LP) neuron of the crab stomatogastric ganglion (STG). Many peptide modulators, including proctolin, activate the same ionic current (IMI) in STG neurons. Because IMI is fast and non-inactivating, its peak level does not depend on the temporal properties of neuronal activity. We found, however, that the amplitude and peak time of the proctolin-activated current in LP is frequency dependent. Because frequency affects the rate of voltage change, we measured these currents with voltage ramps of different slopes and found that proctolin activated two kinetically distinct ionic currents: the known IMI, whose amplitude is independent of ramp slope or direction, and an inactivating current (IMI-T), which was only activated by positive ramps and whose amplitude increased with increasing ramp slope. Using a conductance-based model we found that IMI and IMI-T make distinct contributions to the bursting activity, with IMI increasing the excitability, and IMI-T regulating the burst onset by modifying the postinhibitory rebound in a frequency-dependent manner. The voltage dependence and partial calcium permeability of IMI-T is similar to other characterized neuromodulator-activated currents in this system, suggesting that these are isoforms of the same channel. Our computational model suggests that calcium permeability may allow this current to also activate the large calcium-dependent potassium current in LP, providing an additional mechanism to regulate burst termination. These results demonstrate a mechanism for frequency-dependent actions of neuromodulators.

Keywords: calcium; central pattern generator; modeling; neuromodulation; stomatogastric.


Figures

None
Graphical abstract
Figure 1.
Figure 1.
Voltage-clamp paradigms. A, Extracellular lateral ventricular nerve (lvn) and intracellular LP neuron recording. The lvn carries the axons of several neurons participating in the triphasic pyloric rhythm. The largest action potentials in the lvn recording are from the LP neuron. Different units can be recognized by different amplitudes. The follower neuron LP oscillates in time with the pyloric rhythm because of strong periodic inhibitory input and fires bursts of action potentials on rebound from inhibition. B, Canonical waveform of LP. This prerecorded waveform was used to drive LP’s membrane potential in voltage clamp to mimic a realistic LP neuron activity. In the voltage-clamp experiments, the slow-wave oscillation was scaled so that it ranged from a trough potential of −60 mV to −20 mV. C, LP’s depolarization rate can be approximated with different slopes (colored lines) for different pyloric cycle periods. D, These slopes were used to construct symmetrical ramp or ramp-and-hold stimuli to sample I-V relationships for proctolin-activated currents at different polarization rates, which roughly correspond to different cycle periods (Extended Data Fig. 1-1). The same color-code for slopes is used for all figures with purple colors for positive (+) ramps and green colors for negative (–) ramps.
Figure 2.
Figure 2.
Proctolin-activated currents depend on ramp slope and direction. Ai, Proctolin-activated currents (IProc) evoked by symmetrical ramp stimulations with four different slopes (color-coded for ramp steepness and ramp direction), averaged over the last three (out of five) sweeps from one experiment. Aii, Overlay of the proctolin currents shown in Ai, normalized by time. B, I-V curves for IProc shown in A, separated by ramp slope. Gray curves show raw recordings, colored curves show logistic fits that were used to smoothe the raw data. C, Quantitative analysis of the peak inward current Imax (Cii, left, indicated by dashed horizontal lines in Ci) and voltage at peak inward current VImax (Cii, right, indicated by dashed vertical lines in Ci) for different ramp slopes and ramp directions (N = 17). Dots represent data from individual experiments. Imax and VImax are both sensitive to ramp slope on the + ramp. On the – ramp, Imax and VImax are only significantly different between extreme slope differences (two-way RM ANOVA; Table 1; results in Extended Data Fig. 2-1). Asterisks indicate significant differences between slopes within the same direction, daggers indicate significant differences between directions within the same slope at α = 0.05.
Figure 3.
Figure 3.
Proctolin-activated currents show slow inactivation. A, Proctolin-activated currents (IProc) in response to 30 sweeps of ramp-and-hold stimuli with different slopes (color-coded). The gray dots connected by lines depict the average IProc for each sweep in this experiment. We refer to IProc during the first sweep as initial state, and to the average of the last five sweeps as steady state (gray box). B, First (initial state) and averaged last five (steady state) sweeps from the experiment in A. C, Ratio of IProc between steady state and initial state. The slow inactivation of IProc is greater at 100 mV/s ramps compared with 200 and 400 mV/s ramps (RM ANOVA; Table 1; results in Extended Data Fig. 3-1). Each dot represents an individual experiment. D, Time constants for slow inactivation. Each dot represents an individual experiment. Time constants were not significantly different between slopes (ANOVA on ranks; Table 1; results in Extended Data Fig. 3-2). Asterisks indicate significance at α = 0.05. n.s. indicates no significant changes.
Figure 4.
Figure 4.
Steady-state levels of the proctolin-activated currents elicited by a periodic ramp-and-hold stimulus depend on ramp slope and direction. A, Proctolin-activated currents (IProc) in response to the last three of 30 sweeps of ramp-and-hold stimuli with different slopes (color-coded). Data are from the same experiments as Figure 3A. B, Steady-state I-V curves for different ramp slopes (color-coded) from one experiment (same experiment as in A). Gray lines show raw current recordings, colored lines show logistic fits that were used to smoothe the raw data. C, Quantitative analysis of Imax (left) and VImax (right) for different ramp slopes and ramp directions (N = 10). Dots represent data from individual experiments. Imax is sensitive to ramp slope on the + ramp but not to the – ramp (two-way RM ANOVA; Table 1; results in Extended Data Fig. 4-1). Asterisks indicate significant differences between slopes within the same direction, daggers indicate significant differences between directions within the same slope at α = 0.05. n.s. indicates no significant changes.
Figure 5.
Figure 5.
Slope-sensitivity of proctolin-activated currents is different during ongoing LP activity. Ai, The last three (of 20) sweeps of the proctolin-activated currents IProc in response to voltage clamping with a realistic LP waveform. Shown is one experiment at different cycle frequencies (color-coded). Aii, Overlay of the averages of the last five cycles (same experiment as Ai), normalized to time. B, Imax and phase of ImaxImax) are sensitive to cycle frequency (RM ANOVA; Table 1; results in Extended Data Fig. 5-1). Dots represent data from individual experiments. Asterisks indicate significant differences between frequencies at α = 0.05.
Figure 6.
Figure 6.
A model with only IMI and IMI-T adequately captures the fast and slow inactivations. A, Model parameters for IMI and IMI-T were tuned to capture the steady-state IProc trajectories, i.e., a larger inward current on the positive ramps, and larger inward currents with larger slopes. Ai, Overlay of the biological (red) and model (black) IProc trajectories in response to steady-state ramp-and-hold stimuli. Aii, I-V curves separated by positive (purple) and negative (green) ramps similar to those shown in Ai. I-V curves for the positive ramps were obtained after holding the voltage at –80 mV to remove inactivation, and the negative ramps after holding the voltage at +20 mV to maximize inactivation of the transient current. Bi, Time constants for the activation (solid lines) and inactivation (dashed lines) gates of the model IMI (green) and IMI-T (pink). Bii, Model response to realistic LP waveform stimulations with different cycle frequencies (based on the biological data from the same preparation as in Ai). The gray shading around Vcomm. indicates the voltage range of the ramp and ramp-and-hold stimuli used in Ai. Biii, Model response to the same waveforms as in Bii but with an upscaled amplitude that is similar to the amplitude of the ramp and ramp-and-hold stimuli. C, The slow inactivation of the proctolin-activated current can be mimicked in a computational model by modeling IMI-T as Ca2+ current following the Goldman–Hodgkin–Katz formalism.
Figure 7.
Figure 7.
Decreasing the amplitude of ramps to that of the realistic waveforms removes the slope dependence of IMI-T. A, IProc measured in LP in response to downscaled ramp-and-hold stimuli with an amplitude similar to the realistic LP wave stimulus. B, Quantification of steady state Imax and VImax for the downscaled ramp-and-hold stimuli (N = 6). Dots represent data from individual experiments. There is no significant slope dependence (n.s.; two-way RM ANOVA; Table 1; results in Extended Data Fig. 7-1).
Figure 8.
Figure 8.
Proctolin-activated currents are partially blocked by cadmium. Ai, Proctolin-activated currents in Cd2+ saline evoked by symmetrical ramp stimulations with four different slopes (color-coded), averaged over the last three of five sweeps of one experiment. Aii, Overlay of the proctolin currents shown in Ai, normalized by time. B, Example I-V curves for Iproc shown in A, 100 mV/s. Gray solid lines show original current recordings, colored solid lines show logistic fits. C, Quantitative analysis of Imax (left) and VImax (right) for different ramp slopes and ramp directions (N = 4). Dots represent data from individual experiments. Ramp slope and direction show statistically significant interactions for Imax (two-way RM ANOVA; Table 1; results in Extended Data Fig. 8-1). Asterisks indicate significant differences between slopes within a direction, daggers indicate significant differences between directions within a slope at α = 0.05. n.s. indicates no significant changes. D, Linear fits for Imax. Di, Example showing the fits from a linear regression model to the Imax for different ramp slopes and directions in normal saline and Cd2+ saline. Dii, Slopes of linear fits for Imax in normal saline (filled boxes) and Cd2+ saline (hatched boxes). Cd2+ significantly reduced the slope of Imax for the + ramps (purple), but not the – ramps (green), indicating a reduction of IMI-T in the presence of Cd2+ (two-way ANOVA; Table 1; results in Extended Data Fig. 8-2). E, Example (same preparation as in A) showing the initial (black) and steady-state (gray, average of the last five sweeps) responses to ramp-and-hold stimuli in Cd2+ saline. In all four experiments, IProc was not significantly different between initial and steady state (two-way RM ANOVA; Table 1; results in Extended Data Fig. 8-3).
Figure 9.
Figure 9.
The frequency dependence of IMI-T shifts the burst phases in a model of the LP neuron. LP model with IK and INa in the axon compartment, leak current in both axon and soma/neurite compartment, and IA, Ih, ICa, IK(Ca), IMI, and IMI-T in the soma/neurite compartment. Calcium permeability is indicated by the subscripted addition of (Ca) to IMI-T. Ai, Model voltage waveforms and the corresponding instantaneous spike frequencies (finst) within a burst with IMI and IMI-T where IMI-T is either contributing to the intracellular Ca2+ concentration (purple; IMI-T(Ca)) or not (black). The model received periodic inhibition (gsyn) at 1 Hz. Aii, Levels of IK(Ca) when IMI-T is either contributing to the intracellular Ca2+ concentration (purple) or not (black). The larger IK(Ca) contributes to the earlier burst termination. The model equations and parameters are as described in Materials and Methods. B, Contribution of the different components to the activity phases of the model neuron at different cycle frequencies. Currents were matched so that the model produced the same number of spikes per burst at 1 Hz (gray rectangles in Bi). Bi, Voltage trajectories and instantaneous frequencies within a burst at 0.5, 1, and 1.66 Hz when the model contained IMI and IMI-T(Ca) (purple), when the model contained only IMI but not IMI-T(Ca) (green), and when the model contained only IMI-T(Ca) but not IMI (pink). Bii, Phase plots of the activity at different cycle frequencies. IMI-T(Ca) had a substantially greater effect on phase than IMI (Extended Data Fig. 9-1). Gray bars indicate the duration of the inhibitory synaptic current. In this panel, the model parameters for IMI and IMI-T were adjusted as follows: IMI + IMI-T(Ca): g¯MI=0.227, g¯MIT=2.27; IMI only: g¯MI=0.995, g¯MIT=0; IMI-T(Ca) only: g¯MI=0, g¯MIT=3.63.

References

    1. Amarillo Y, Zagha E, Mato G, Rudy B, Nadal MS (2014) The interplay of seven subthreshold conductances controls the resting membrane potential and the oscillatory behavior of thalamocortical neurons. J Neurophysiol 112:393–410. 10.1152/jn.00647.2013 - DOI - PMC - PubMed
    1. Armstrong CE, Roberts WM (2001) Rapidly inactivating and non-inactivating calcium-activated potassium currents in frog saccular hair cells. J Physiol 536:49–65. 10.1111/j.1469-7793.2001.00049.x - DOI - PMC - PubMed
    1. Baukrowitz T, Yellen G (1995) Modulation of K+ current by frequency and external [K+]: a tale of two inactivation mechanisms. Neuron 15:951–960. 10.1016/0896-6273(95)90185-X - DOI - PubMed
    1. Ben-Ari Y, Cherubini E, Corradetti R, Gaiarsa JL (1989) Giant synaptic potentials in immature rat CA3 hippocampal neurones. J Physiol 416:303–325. 10.1113/jphysiol.1989.sp017762 - DOI - PMC - PubMed
    1. Bose A, Golowasch J, Guan Y, Nadim F (2014) The role of linear and voltage-dependent ionic currents in the generation of slow wave oscillations. J Comput Neurosci 37:229–242. 10.1007/s10827-014-0498-4 - DOI - PMC - PubMed

Publication types

Substances

LinkOut - more resources