. 2021 Sep 30;4(12):e202101224.
doi: 10.26508/lsa.202101224. Print 2021 Dec.

Gut microbiota-derived short-chain fatty acids protect against the progression of endometriosis

Affiliations

Gut microbiota-derived short-chain fatty acids protect against the progression of endometriosis

Sangappa B Chadchan et al. Life Sci Alliance. .

Abstract

Worldwide, ∼196 million are afflicted with endometriosis, a painful disease in which endometrial tissue implants and proliferates on abdominal peritoneal surfaces. Theories on the origin of endometriosis remained inconclusive. Whereas up to 90% of women experience retrograde menstruation, only 10% develop endometriosis, suggesting that factors that alter peritoneal environment might contribute to endometriosis. Herein, we report that whereas some gut bacteria promote endometriosis, others protect against endometriosis by fermenting fiber to produce short-chain fatty acids. Specifically, we found that altered gut microbiota drives endometriotic lesion growth and feces from mice with endometriosis contained less of short-chain fatty acid and n-butyrate than feces from mice without endometriosis. Treatment with n-butyrate reduced growth of both mouse endometriotic lesions and human endometriotic lesions in a pre-clinical mouse model. Mechanistic studies revealed that n-butyrate inhibited human endometriotic cell survival and lesion growth through G-protein-coupled receptors, histone deacetylases, and a GTPase activating protein, RAP1GAP. Our findings will enable future studies aimed at developing diagnostic tests, gut bacteria metabolites and treatment strategies, dietary supplements, n-butyrate analogs, or probiotics for endometriosis.


Conflict of interest statement

The authors declare that they have no conflict of interest.

Figures

Figure S1.
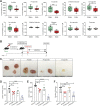
Figure S1.. Gut microbiota promote endometriosis disease progression in mice.
(A) Schematic of experimental timeline and procedures. (B, C, D, E) Ectopic endometriotic lesion (B) representative images, (C) volumes, (D) masses, and (E) number of lesions from the indicated groups 21 d after surgical induction of endometriosis (n = 9–10 mice per group). (F, G) Representative images of ectopic lesions from the indicated treatment groups stained with (F) hematoxylin and eosin (yellow dashed lines demarcate the epithelium), scale bar 200 μm, and (G) anti-Ki-67 antibody, scale bar 500 μm. E, epithelium; S, stroma; G, glands. Data are presented as mean ± SE (n = 9–10), *P < 0.05, **P < 0.01, and ***P < 0.001.
Figure 1.
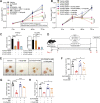
Figure 1.. Gut bacteria are required for endometriotic lesion growth in mice.
(A) Schematic of experimental timeline and procedures. Mice were microbiota depleted (MD) for 7 d, then injected with uterine fragments on Day 0. Mice were orally gavaged with PBS (MD+PBS), feces from mice without endometriosis (MD+NE), or feces from mice with endometriosis (MD+E) on Days 7 and 14. (B, C, D, E) Representative ectopic lesion images, (C) volumes, (D) masses, and (E) number of lesions from the indicated groups, 21 d after injection of endometrial fragments. (F, G) Representative images of ectopic lesions from the indicated treatment groups stained with (F) hematoxylin and eosin (H & E) (yellow dashed lines demarcate the epithelium and (G) anti-Ki-67 antibody). E, epithelium; S, stroma. Data are presented as mean ± SE (n = 5 mice). Scale bar 100 μm, *P < 0.05; **P < 0.01; and ***P < 0.001 ns, nonsignificant.
Figure 2.
Figure 2.. n-butyrate but not acetate or propionate inhibits endometriotic lesion growth in mice.
(A) The absolute concentration of indicated short-chain fatty acids in feces of mice with (Endo) and without (Sham) endometriosis. Data are presented as mean ± SE (n = 9–10 mice). (B) Schematic of experimental timeline and procedures. (C, D, E, F) Representative endometriotic lesion images, (D) volumes, (E) masses, and (F) number of lesions from the indicated groups 21 d after injection of uterine fragments. Data are presented as mean ± SE (n = 5). *P < 0.05, **P < 0.01, ***P < 0.001, ****P < 0.0001, and ns, nonsignificant.
Figure S2.
Figure S2.. Concentrations of short-chain fatty acids in feces of mice.
(A, B) The (A) concentrations and (B) pie chart represent the relative abundances of the indicated short-chain fatty acids in the feces of Sham mice. Data are presented as mean ± SE (n = 9–10 mice).
Figure S3.
Figure S3.. n-butyrate but not acetate or propionate inhibits proliferation and inflammation in the endometriotic lesion of mice.
(A) Representative images of hematoxylin and eosin–stained cross-sectional images of ectopic lesions from the indicated treatment groups (yellow dashed lines demarcate the epithelium). (B, C) Representative images of ectopic lesions stained with (B) anti-Ki-67 antibody and (C) anti-F4/80 antibody from the indicated treatment groups. E, epithelium; G, glands; S, stroma; (n = 5 mice). Scale bar 100 μm.
Figure 3.
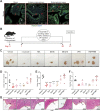
Figure 3.. n-butyrate inhibits human endometriotic lesion growth in mice.
(A, B) Representative MTT cell viability assays of (A) Immortalized Human Endometriotic Epithelial Cells/Luciferase (iHEECs/Luc) and (B) primary Human Endometriotic Stromal Cells (HEnSCs) isolated from human endometriotic lesion biopsies at indicated time points and n-butyrate concentrations. Graphs represent data as mean ± SE from triplicate samples from one experiment (three experiments were conducted in total, n = 3). (C, D) Representative (C) bioluminescence images and (D) lesions from mice of the indicated groups 21 d after induction of endometriosis. (E, F) Quantitation of lesion (E) volumes and (F) masses. (G, H, I) Representative images of ectopic lesions from the indicated treatment groups stained with (G) hematoxylin and eosin (H & E) (yellow dashed lines demarcate the epithelium), scale bar 200 μm (H) anti-Ki-67 antibody and (I) anti-F4/80 antibody. E, epithelium; S, stroma. Data are presented as mean ± SE; (n = 5 mice per group), scale bar 100 μm; **P < 0.01, and ***P < 0.001.
Figure S4.
Figure S4.. Acetate and propionate moderately inhibits the cellular viability of endometriotic cells in vitro.
(A, B) Representative MTT cell viability assays treated with acetate (A) and propionate (B) in Immortalized Human Endometriotic Epithelial Cells/Luciferase (iHEECs/Luc) at indicated time points and concentrations. (C, D) Representative MTT cell viability assays treated with acetate (C) and propionate (D) in primary stromal cells isolated from human endometriotic lesions (HEnSCs) at indicated time points and concentrations. Graphs represent data as mean ± SE from triplicate samples from one experiment (three experiments were conducted in total, n = 3). **P < 0.01 and ***P < 0.001.
Figure 4.
Figure 4.. n-butyrate functions through G-protein–coupled receptors (GPRs) to inhibit endometriotic lesion growth.
(A) MTT cell viability assays of iHEECs/Luc treated with GPR43 antagonist GLPG0974, GPR109A inhibitor mepenzolate bromide, or both combined and treated with 2 mM n-butyrate for indicated time points. (B) MTT cell viability assays of iHEECs/Luc transfected with the indicated siRNAs and treated with 2 mM n-butyrate for indicated time points. (C) Quantitative RT-PCR of FFAR2 and HCAR2 in siRNA-transfected iHEECs/Luc after 48 h. The graphs in (A), (B), and (C) show representative data presented as mean ± SE from triplicate samples from one experiment (three experiments were conducted in total, n = 3). (D) Schematic of experimental timeline and procedures. (E, F, G, H) Representative images of ectopic endometriotic lesions, (F) volumes, (G) masses, and (H) numbers of lesions from the indicated groups 21 d after injection of uterine fragments. Data are presented as mean ± SE (n = 5), *P < 0.05, **P < 0.01, ***P < 0.001, ****P < 0.0001.
Figure S5.
Figure S5.. n-butyrate functions through G-protein–coupled receptors to inhibit the proliferation of endometriotic lesion.
(A, B) Representative images of ectopic lesions stained with (A) hematoxylin and eosin (yellow dashed lines demarcate the epithelium) and (B) anti–Ki-67 antibody from the indicated treatment groups. E, epithelium; S, stroma; (n = 5 mice). Scale bar 100 μm.
Figure S6.
Figure S6.. n-butyrate inhibits HDAC activity and cellular viability in endometriotic epithelial cells.
(A) Western blot detection of acetylated histone H3 (Ac-H3K9), total histone H3 (loading control for Ac-H3K9), HDAC1, HDAC2, HDAC3, and GAPDH (loading control) in iHEECs/Luc treated as indicated for 24 h. (B) Representative MTT cell viability assays of iHEECs/Luc treated with n-butyrate along with indicated HDAC inhibitors for indicated time points. Data are presented as mean ± SE from triplicate samples from one experiment (three experiments were conducted in total, n = 3). ***P < 0.001, and ****P < 0.0001.
Figure 5.
Figure 5.. n-butyrate inhibits HDAC activity, which is required for endometriotic cell growth.
(A) Representative images of eutopic endometrium and ectopic lesions of mice stained with anti-HDAC1 antibody from the indicated groups. E, epithelium; S, stroma. White arrow indicates the HADC1-positive cells. Scale bar 100 μm. (B) Schematic of experimental timeline and procedures. (C, D, E, F) Representative images of endometriotic lesions, (D) volumes, (E) masses, and (F) number of lesions from the indicated treatment groups 21 d after injection of uterine fragments. (G) Representative images of ectopic lesions stained with hematoxylin and eosin (H & E) from the indicated treatment groups (yellow dashed lines demarcate the epithelium). E, epithelium; S, stroma. Scale bar 100 μm. Data are presented as mean ± SE (n = 5), *P < 0.05, **P < 0.01, ***P < 0.001, and ns, nonsignificant.
Figure 6.
Figure 6.. RAP1GAP mediates n-butyrate–driven endometriotic cell growth inhibition.
(A) Heat map of transcripts differentially expressed between vehicle- and n-butyrate–treated iHEECs/Luc with cutoff of FDR < 0.05 and logFC >2.0; n = 3 each group. (B) Relative raw abundance of RAP1GAP, RAP1GAP2, and RAP1GDS transcripts from microarray analysis within a publicly available GEO dataset (GSE6364). Data are presented as mean ± SE (n = 10). (C) Relative abundance of RAP1GAP, RAP1GAP2, and RAP1GDS transcripts in iHEECs/Luc treated with 2 mM n-butyrate for 24 h; n = 3 each group. (D) Relative abundance of active RAP1 (GTP-bound) and total RAP1, in iHEECs/Luc treated with 2 mM n-butyrate for 24 h; n = 4 each group. (E) MTT assay of iHEECs/Luc transfected with control or RAP1GAP siRNA and then treated with 2 mM n-butyrate for indicated times. Data are presented as the mean ± SE from triplicate samples from one experiment (three experiments were conducted in total). The graph on the right depicts quantitative RT-PCR–based confirmation of RAP1GAP knockdown in iHEECs/Luc after 48 h of siRNA transfection. **P < 0.01, ***P < 0.001, ****P < 0.0001, and ns, nonsignificant.
Figure S7.
Figure S7.. n-butyrate treatment alters the transcriptome in endometriotic epithelial cells.
(A) MA plot showing normalization of RNA-seq data of differentially expressed genes between vehicle- and n-butyrate–treated iHEECs/Luc. (B) Volcano plot for all the differentially expressed genes in each comparison with significance cutoff P < 0.05. (C) A graph depicting the 25 most significantly enriched pathways with both up- and down-regulated genes in KEGG analysis; n = 3 per group.
Figure S8.
Figure S8.. n-butyrate alters the RAP1 signaling pathway in the endometriotic epithelial cells.
Effect of n-butyrate treatment on the RAP1 signaling pathway analyzed by KEGG; n = 3 per group.
Figure S9.
Figure S9.. n-butyrate but not acetate or propionate induces RAP1GAP in the endometriotic epithelial cells.
(A, B, C) Relative transcript levels of (A) RAP1GAP, (B) RAP1GAP2 and (C) RAP1GDS in the iHEECs/Luc treated with 2 mM acetate, propionate and n-butyrate for 24 h. Data are presented as the mean ± SE from triplicate samples from one experiment (three experiments were conducted in total, n = 3); ***P < 0.001 and ns, nonsignificant.
Figure S10.
Figure S10.. n-butyrate and MS-275 induces the RAP1GAP in endometriotic epithelial cells.
(A, B, C) Relative transcript levels of (A) RAP1GAP, (B) RAP1GAP2, and (C) RAP1GDS in the iHEECs/Luc treated with either 2 mM n-butyrate or 3 μM MS-275 for 24 h. Data are presented as the mean ± SE from triplicate samples from one experiment (three experiments were conducted in total, n = 3); ***P < 0.001 and ns, nonsignificant. Note: n-butyrate and MS-275 dissolved in distilled H2O and DMSO, respectively.

References

    1. Giudice LC (2010) Clinical practice. Endometriosis. N Engl J Med 362: 2389–2398. 10.1056/NEJMcp1000274 - DOI - PMC - PubMed
    1. Ahn SH, Monsanto SP, Miller C, Singh SS, Thomas R, Tayade C (2015) Pathophysiology and immune dysfunction in endometriosis. Biomed Res Int 2015: 795976. 10.1155/2015/795976 - DOI - PMC - PubMed
    1. Han SJ, O’Malley BW (2014) The dynamics of nuclear receptors and nuclear receptor coregulators in the pathogenesis of endometriosis. Hum Reprod Update 20: 467–484. 10.1093/humupd/dmu002 - DOI - PMC - PubMed
    1. Rizk B, Fischer AS, Lotfy HA, Turki R, Zahed HA, Malik R, Holliday CP, Glass A, Fishel H, Soliman MY, et al. (2014) Recurrence of endometriosis after hysterectomy. Facts Views Vis Obgyn 6: 219–227. - PMC - PubMed
    1. Chadchan SB, Cheng M, Parnell LA, Yin Y, Schriefer A, Mysorekar IU, Kommagani R (2019) Antibiotic therapy with metronidazole reduces endometriosis disease progression in mice: A potential role for gut microbiota. Hum Reprod 34: 1106–1116. 10.1093/humrep/dez041 - DOI - PMC - PubMed

Publication types

MeSH terms