

Automated design of pulse sequences for magnetic resonance fingerprinting using physics-inspired optimization
- PMID: 34593630
- PMCID: PMC8501900
- DOI: 10.1073/pnas.2020516118
Automated design of pulse sequences for magnetic resonance fingerprinting using physics-inspired optimization
Abstract
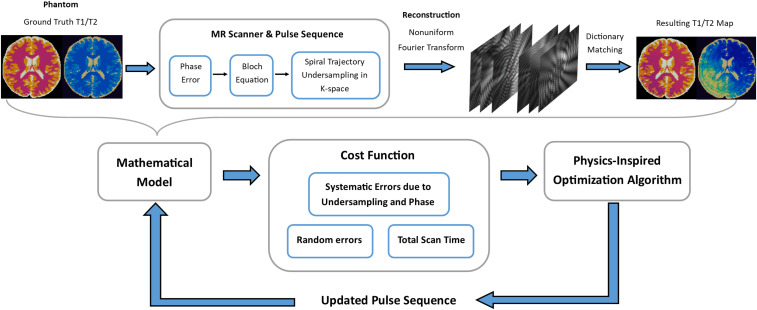
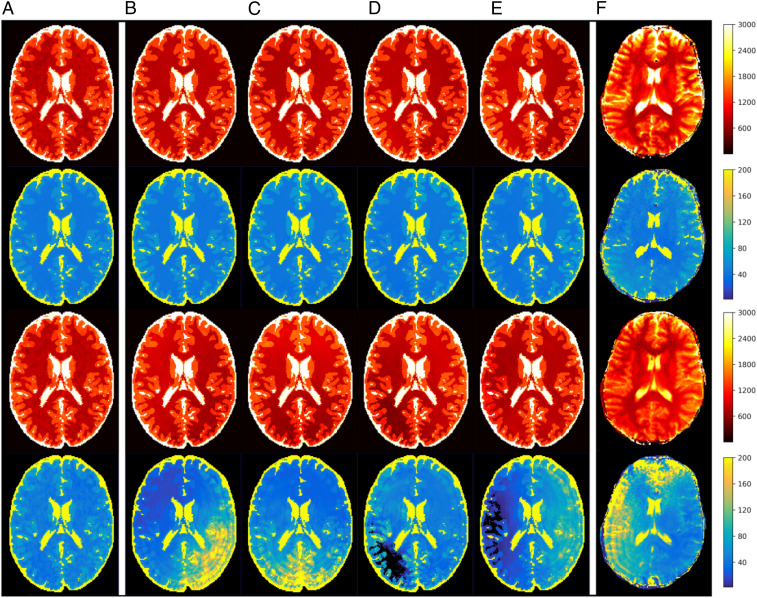
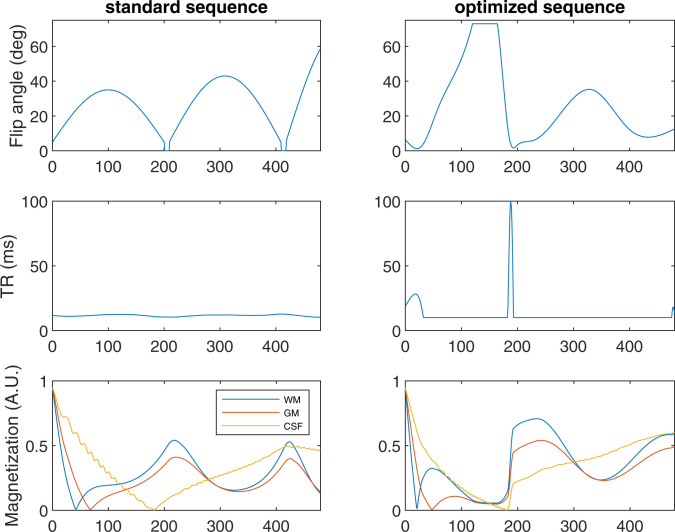
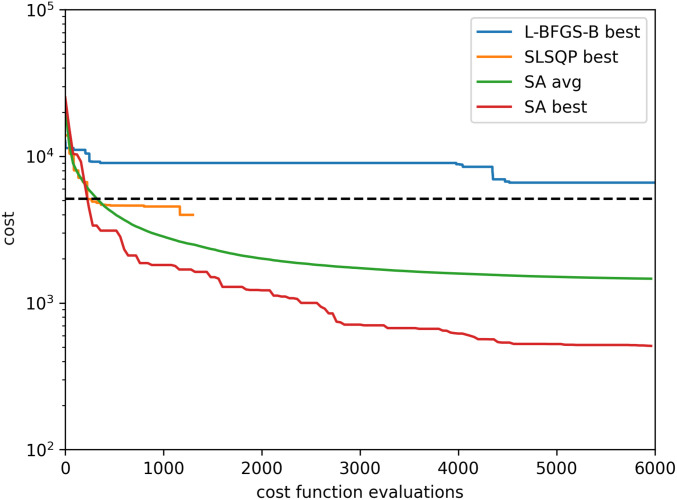
Magnetic resonance fingerprinting (MRF) is a method to extract quantitative tissue properties such as [Formula: see text] and [Formula: see text] relaxation rates from arbitrary pulse sequences using conventional MRI hardware. MRF pulse sequences have thousands of tunable parameters, which can be chosen to maximize precision and minimize scan time. Here, we perform de novo automated design of MRF pulse sequences by applying physics-inspired optimization heuristics. Our experimental data suggest that systematic errors dominate over random errors in MRF scans under clinically relevant conditions of high undersampling. Thus, in contrast to prior optimization efforts, which focused on statistical error models, we use a cost function based on explicit first-principles simulation of systematic errors arising from Fourier undersampling and phase variation. The resulting pulse sequences display features qualitatively different from previously used MRF pulse sequences and achieve fourfold shorter scan time than prior human-designed sequences of equivalent precision in [Formula: see text] and [Formula: see text] Furthermore, the optimization algorithm has discovered the existence of MRF pulse sequences with intrinsic robustness against shading artifacts due to phase variation.
Keywords: magnetic resonance fingerprinting; magnetic resonance imaging; optimization; pulse sequence design.
Conflict of interest statement
Competing interest statement: M.A.G. and D.M. have patents on MRF technology. The other authors declare no competing interests.
Figures
Similar articles
-
A fast MR fingerprinting simulator for direct error estimation and sequence optimization.Magn Reson Imaging. 2023 May;98:105-114. doi: 10.1016/j.mri.2023.01.011. Epub 2023 Jan 18. Magn Reson Imaging. 2023. PMID: 36681312 Free PMC article.
-
Mitigating undersampling errors in MR fingerprinting by sequence optimization.Magn Reson Med. 2023 May;89(5):2076-2087. doi: 10.1002/mrm.29554. Epub 2022 Dec 2. Magn Reson Med. 2023. PMID: 36458688
-
Effect of spiral undersampling patterns on FISP MRF parameter maps.Magn Reson Imaging. 2019 Oct;62:174-180. doi: 10.1016/j.mri.2019.01.011. Epub 2019 Jan 15. Magn Reson Imaging. 2019. PMID: 30654162
-
Magnetic Resonance Fingerprinting of the Pediatric Brain.Magn Reson Imaging Clin N Am. 2021 Nov;29(4):605-616. doi: 10.1016/j.mric.2021.06.010. Magn Reson Imaging Clin N Am. 2021. PMID: 34717848 Free PMC article. Review.
-
Magnetic resonance fingerprinting: an overview.Eur J Nucl Med Mol Imaging. 2021 Dec;48(13):4189-4200. doi: 10.1007/s00259-021-05384-2. Epub 2021 May 26. Eur J Nucl Med Mol Imaging. 2021. PMID: 34037831 Review.
Cited by
-
Accurate MRF-Based 3D Multi-Channel B1 + Mapping in the Human Body at 7 T.NMR Biomed. 2025 Aug;38(8):e70080. doi: 10.1002/nbm.70080. NMR Biomed. 2025. PMID: 40533359 Free PMC article.
-
Efficient pulse sequence design framework for high-dimensional MR fingerprinting scans using systematic error index.Magn Reson Med. 2024 Oct;92(4):1600-1616. doi: 10.1002/mrm.30155. Epub 2024 May 9. Magn Reson Med. 2024. PMID: 38725131
-
Optimized three-dimensional ultrashort echo time: Magnetic resonance fingerprinting for myelin tissue fraction mapping.Hum Brain Mapp. 2023 Apr 15;44(6):2209-2223. doi: 10.1002/hbm.26203. Epub 2023 Jan 11. Hum Brain Mapp. 2023. PMID: 36629336 Free PMC article.
-
Motion Robust MR Fingerprinting Scan to Image Neonates With Prenatal Opioid Exposure.J Magn Reson Imaging. 2024 May;59(5):1758-1768. doi: 10.1002/jmri.28907. Epub 2023 Jul 29. J Magn Reson Imaging. 2024. PMID: 37515516 Free PMC article.
-
Artificial intelligence in cardiac magnetic resonance fingerprinting.Front Cardiovasc Med. 2022 Sep 20;9:1009131. doi: 10.3389/fcvm.2022.1009131. eCollection 2022. Front Cardiovasc Med. 2022. PMID: 36204566 Free PMC article. Review.
References
-
- Haubold J., et al., Non-invasive tumor decoding and phenotyping of cerebral gliomas utilizing multiparametric 18F-FET PET-MRI and MR Fingerprinting. Eur. J. Nucl. Med. Mol. Imaging 47, 1435–1445 (2020). - PubMed
-
- Ma D., et al., Development of high-resolution 3D MR fingerprinting for detection and characterization of epileptic lesions. J. Magn. Reson. Imaging 49, 1333–1346 (2019). - PubMed
Publication types
MeSH terms
Grants and funding
LinkOut - more resources
Full Text Sources
Medical
Miscellaneous
