. 2021 Sep 30;11(1):19485.
doi: 10.1038/s41598-021-98559-8.

First results of undersea muography with the Tokyo-Bay Seafloor Hyper-Kilometric Submarine Deep Detector

Affiliations

First results of undersea muography with the Tokyo-Bay Seafloor Hyper-Kilometric Submarine Deep Detector

Hiroyuki K M Tanaka et al. Sci Rep. .

Erratum in

Abstract

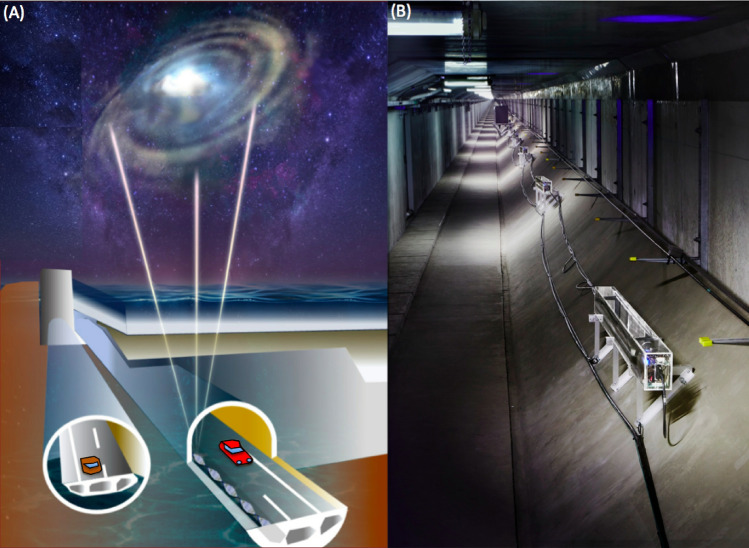
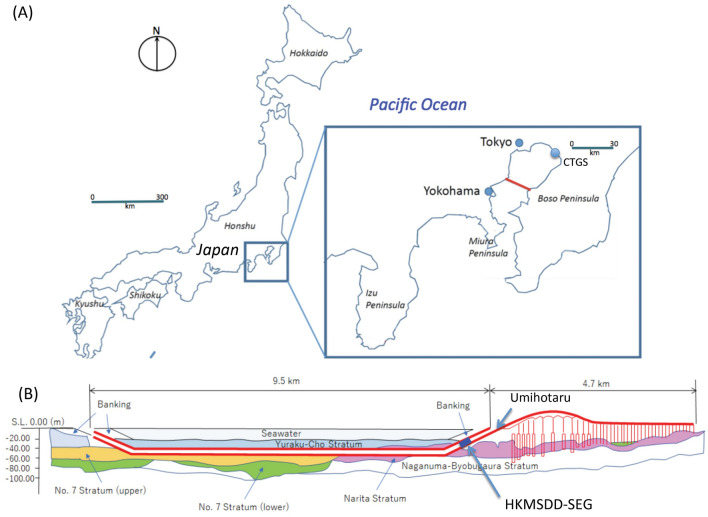
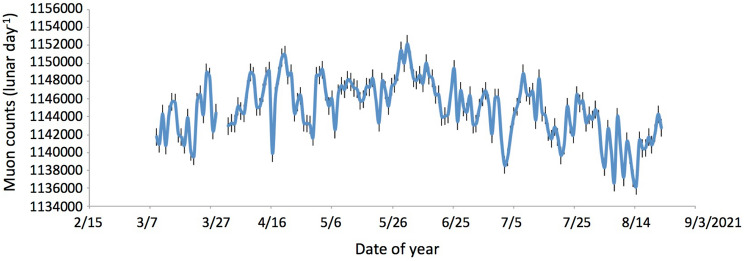
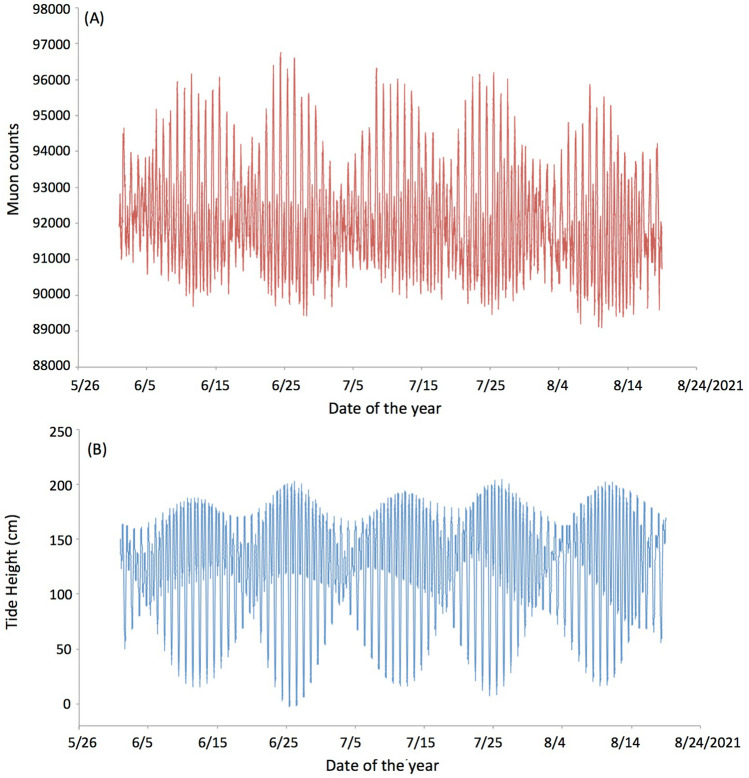
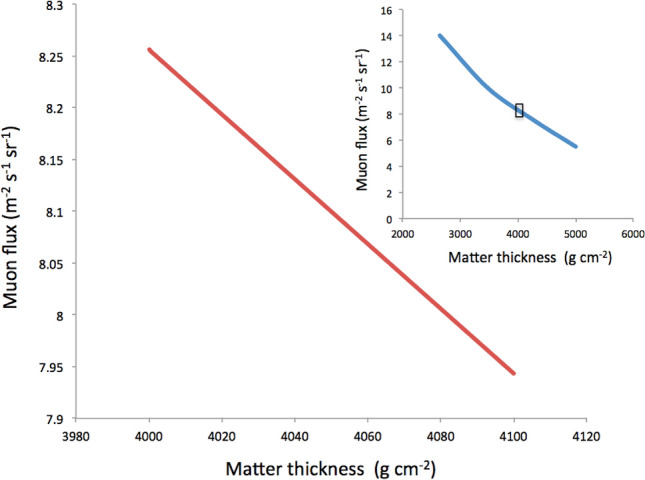
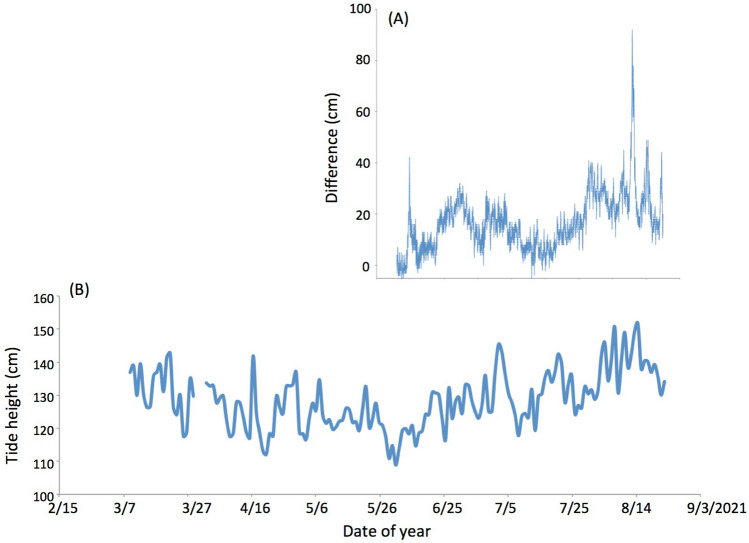
Tidal measurements are of great significance since they may provide us with essential data to apply towards protection of coastal communities and sea traffic. Currently, tide gauge stations and laser altimetry are commonly used for these measurements. On the other hand, muography sensors can be located underneath the seafloor inside an undersea tunnel where electric and telecommunication infrastructures are more readily available. In this work, the world's first under-seafloor particle detector array called the Tokyo-bay Seafloor Hyper-Kilometric Submarine Deep Detector (TS-HKMSDD) was deployed underneath the Tokyo-Bay seafloor for conducting submarine muography. The resultant 80-day consecutive time-sequential muographic data were converted to the tidal levels based on the parameters determined from the first-day astronomical tide height (ATH) data. The standard deviation between ATH and muographic results for the rest of a 79-day measurement period was 12.85 cm. We anticipate that if the length of the TS-HKMSDD is extended from 100 m to a full-scale as large as 9.6 km to provide continuous tidal information along the tunnel, this muography application will become an established standard, demonstrating its effectiveness as practical tide monitor for this heavy traffic waterway in Tokyo and in other important sea traffic areas worldwide.


Conflict of interest statement

The authors declare no competing interests.

Figures

Figure 1
Figure 1
Conceptual view of the Tokyo-bay Seafloor Hyper-Kilometric Submarine Deep Detector (TS-HKMSDD) deployed underneath the Tokyo bay seafloor (A) and the photograph at the actual site (B). HKMT drew this image and holds the copyright. HKMT holds the copyright of the photograph.
Figure 2
Figure 2
Location of the Tokyo Bay Aqua-Line (TBAL) in Japan (red lines) (A) and the cross-sectional view of the tunnel section (Aqua-tunnel) of TBAL (B). The symbols CTGS and HKMSDD-SEG respectively indicate the locations of the Chiba tide gauge station and the HKMSDD segment. The name Umihotaru indicates the service area that marks the transition between the bridge and tunnel part. HKMT drew the map and the image with Microsoft PowerPoint software and holds the copyright.
Figure 3
Figure 3
Configuration of the HKMSDD segment. The schematic of the muographic sensor module (MSM) (A) is shown along with a photograph of the MSM (B). The abbreviations DCU and HVU respectively indicate the discriminator-coincidence unit and the high-voltage power supply unit. The block diagram of the data collection scheme (C) is shown along with a photograph of the Data Acquisition Center (DAC) (D). The network cameras (NW Cameras) are respectively used for monitoring the MSM LEDs and the DAC 7-segment LEDs. The HKMSDD server hosts a closed network. The schematic view of the HKMSDD segment is also shown (E). HKMT holds the copyright of the photographs.
Figure 4
Figure 4
Time-sequential plot of the lunar-daily muon counts. The error bars indicate the statistic errors (1σ) associated with the data points.
Figure 5
Figure 5
Time-sequential plot of the number of muon counts collected every 5 min (A) and the ATH variations (B).
Figure 6
Figure 6
Sea levels converted from the muon counts (A) and their difference from the ATH variations (B).
Figure 7
Figure 7
Muon flux expected at the Hyper-Kilometric Submarine Deep Detector (HKMSDD) segment placed within the region 500–600 m from Umihotaru (SEG1) for various matter thicknesses. The inset shows the larger scale plot. The rectangular box in the inset indicates the plotting region of the main graph.
Figure 8
Figure 8
Difference between the Chiba tide gage station (CTGS) data and ATH (A). The lunar daily averaged muographic tide height variations (B) are plotted together. The time axes are common between these two plots.
Figure 9
Figure 9
Possible future HKMSDD deployment sites: (A) Transbay Tube, San Francisco, CA, (B) Channel Tunnel, UK/France, and (C) Glacier Upsala, Patagonia, Chile. Red lines in (A,B) indicate the undersea tunnels. Black arrows in (A) indicate the direction of the pacific swells. Blue lines in (B) indicate the spring maximum current vectors. The numbers indicate the speed in units of cm/s. Red oval shape symbols in (C) indicate the hypothetical HKMSDD buried under the seafloor. HKMT drew the maps in (A,B) with the Microsoft PowerPoint software and holds the copyright. HKMT drew the image in (C) based on the work by Brinkerhoff et al..

References

    1. Nicholls RJ, et al. Sea-level rise and its possible impacts given a ‘beyond 4 °C world’ in the twenty-first century. Philos. Trans. R. Soc. A. 2011;369:161–181. - PubMed
    1. Dahl KA, Fitzpatrick MF, Spanger-Siegfried E. Sea level rise drives increased tidal flooding frequency at tide gauges along the US East and Gulf Coasts: Projections for 2030 and 2045. PLoS One. 2017;12:e0170949. - PMC - PubMed
    1. Coles S. An Introduction to Statistical Modeling of Extreme Values. Springer; 2001.
    1. International Altimetry Team Altimetry for the future: Building on 25 years of progress. Adv. Sp. Res. 2021;68:319–336.
    1. Liu N, et al. High spatio-temporal resolution deformation time series with the fusion of InSAR and GNSS data using spatio-temporal random effect model. IEEE Trans. Geosci. Remote Sens. 2018;57:1–17. doi: 10.1109/TGRS.2018.2854736. - DOI

Publication types