

Functional and histologic imaging of urinary bladder wall after exposure to psychological stress and protamine sulfate
- PMID: 34593876
- PMCID: PMC8484474
- DOI: 10.1038/s41598-021-98504-9
Functional and histologic imaging of urinary bladder wall after exposure to psychological stress and protamine sulfate
Abstract
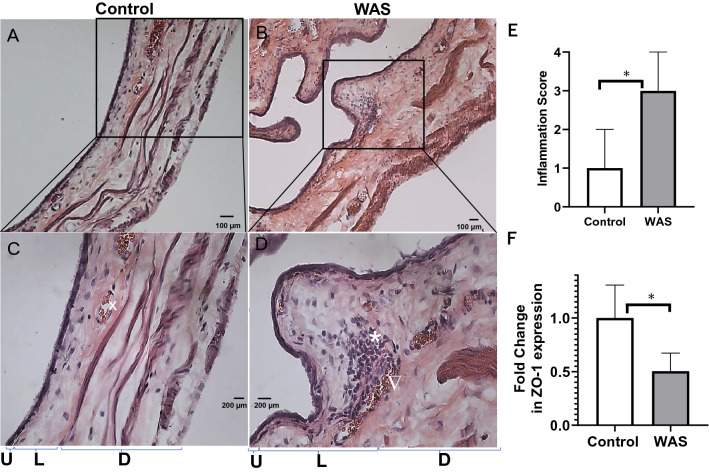
To quantify the urinary bladder wall T1 relaxation time (T1) before and after the instillation contrast mixture in rats previously subjected to water avoidance stress (WAS) and/or acute exposure to protamine sulfate (PS). Female Wistar rats were randomized to receive either sham (control) or 1 h of WAS for ten consecutive days before the evaluation of nocturnal urination pattern in metabolic cages. T1 mapping of urinary bladder wall at 9.4 T was performed pre- and post- instillation of 4 mM Gadobutrol in a mixture with 5 mM Ferumoxytol. Subsequently, either T1 mapping was repeated after brief intravesical PS exposure or the animals were sacrificed for histology and analyzing the mucosal levels of mRNA. Compared to the control group, WAS exposure decreased the single void urine volume and shortened the post-contrast T1 relaxation time of mucosa- used to compute relatively higher ingress of instilled Gadobutrol. Compromised permeability in WAS group was corroborated by the urothelial denudation, edema and ZO-1 downregulation. PS exposure doubled the baseline ingress of Gadobutrol in both groups. These findings confirm that psychological stress compromises the paracellular permeability of bladder mucosa and its non-invasive assay with MRI was validated by PS exposure.
© 2021. The Author(s).
Conflict of interest statement
The authors declare no competing interests, except Jonathan Kaufmann, who is the CEO of Lipella Pharmaceuticals and an inventor of the contrast mixture used in the described study.
Figures


Similar articles
-
Virtual measurements of paracellular permeability and chronic inflammation via color coded pixel-wise T1 mapping.Am J Physiol Renal Physiol. 2020 Sep 1;319(3):F506-F514. doi: 10.1152/ajprenal.00025.2020. Epub 2020 Jul 27. Am J Physiol Renal Physiol. 2020. PMID: 32715761 Free PMC article.
-
Intravesical treatments for painful bladder syndrome/ interstitial cystitis.Cochrane Database Syst Rev. 2007 Oct 17;(4):CD006113. doi: 10.1002/14651858.CD006113.pub2. Cochrane Database Syst Rev. 2007. PMID: 17943887
-
Invasive urodynamic investigations in the management of women with refractory overactive bladder symptoms: FUTURE, a superiority RCT and economic evaluation.Health Technol Assess. 2025 Jul;29(27):1-139. doi: 10.3310/UKYW4923. Health Technol Assess. 2025. PMID: 40620147 Free PMC article. Clinical Trial.
-
Urine is necessary to provoke bladder inflammation in protamine sulfate induced urothelial injury.J Urol. 2008 Oct;180(4):1527-31. doi: 10.1016/j.juro.2008.06.006. Epub 2008 Aug 16. J Urol. 2008. PMID: 18710775
-
Intravesical bacillus Calmette-Guerin versus mitomycin C for Ta and T1 bladder cancer.Cochrane Database Syst Rev. 2003;(3):CD003231. doi: 10.1002/14651858.CD003231. Cochrane Database Syst Rev. 2003. Update in: Cochrane Database Syst Rev. 2015 Nov 07;(11):CD003231. doi: 10.1002/14651858.CD003231.pub2. PMID: 12917955 Updated.
Cited by
-
Treating Lower Urinary Tract Symptoms in Older Adults: Intravesical Options.Drugs Aging. 2023 Mar;40(3):241-261. doi: 10.1007/s40266-023-01009-5. Epub 2023 Mar 6. Drugs Aging. 2023. PMID: 36879156 Free PMC article. Review.
-
Does large volume of distribution of lidocaine masks its systemic uptake from bladder?Am J Clin Exp Urol. 2023 Apr 15;11(2):121-135. eCollection 2023. Am J Clin Exp Urol. 2023. PMID: 37168943 Free PMC article.
-
SWOT and Root Cause Analyses of Antimicrobial Resistance to Oral Antimicrobial Treatment of Cystitis.Antibiotics (Basel). 2024 Apr 4;13(4):328. doi: 10.3390/antibiotics13040328. Antibiotics (Basel). 2024. PMID: 38667004 Free PMC article. Review.
-
Experimental murine models of interstitial cystitis/bladder pain syndrome: A review.Histol Histopathol. 2025 May;40(5):635-644. doi: 10.14670/HH-18-837. Epub 2024 Oct 23. Histol Histopathol. 2025. PMID: 39523811 Review.
-
Unraveling the complexity of bladder-centric chronic pain by intravesical contrast enhanced MRI.Continence (Amst). 2023 Sep;7:101041. doi: 10.1016/j.cont.2023.101041. Epub 2023 Jul 20. Continence (Amst). 2023. PMID: 40575723 Free PMC article.
References
Publication types
MeSH terms
Substances
Grants and funding
LinkOut - more resources
Full Text Sources
Medical
