. 2021 Sep 30;11(1):19412.
doi: 10.1038/s41598-021-99025-1.

Dopaminergic dysfunction in the 3xTg-AD mice model of Alzheimer's disease

Affiliations

Dopaminergic dysfunction in the 3xTg-AD mice model of Alzheimer's disease

Yesica Gloria et al. Sci Rep. .

Abstract

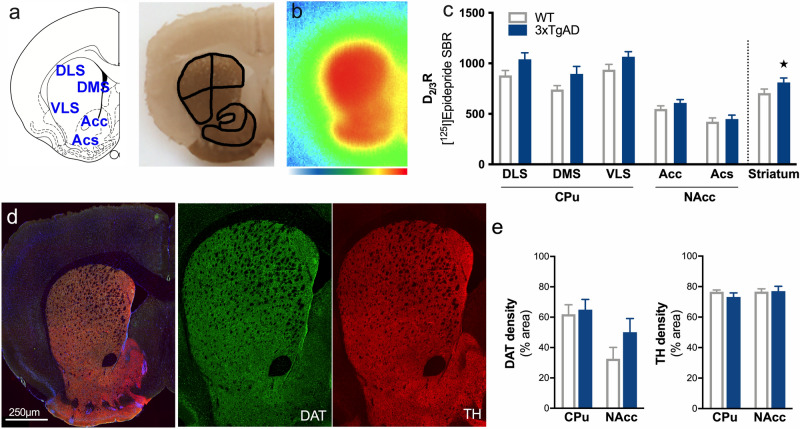
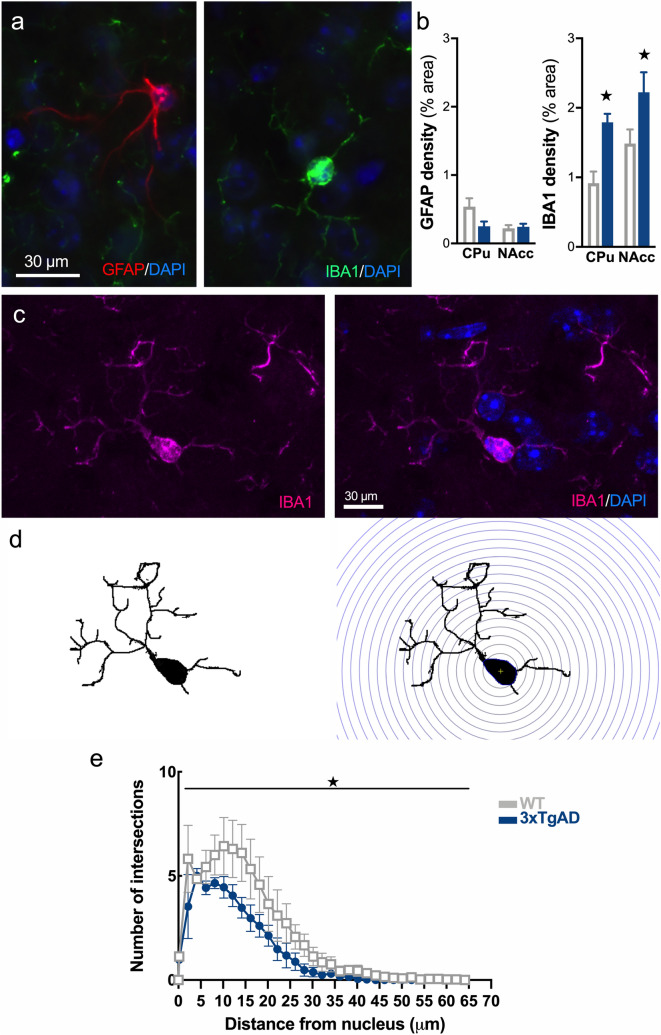
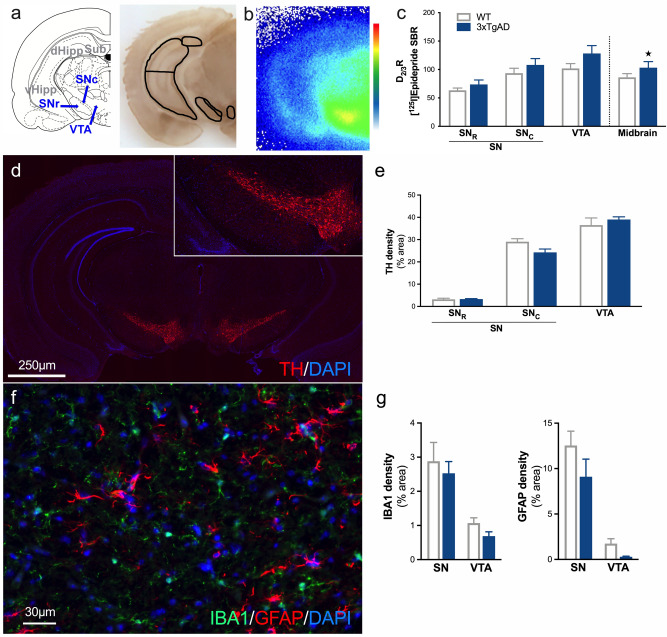
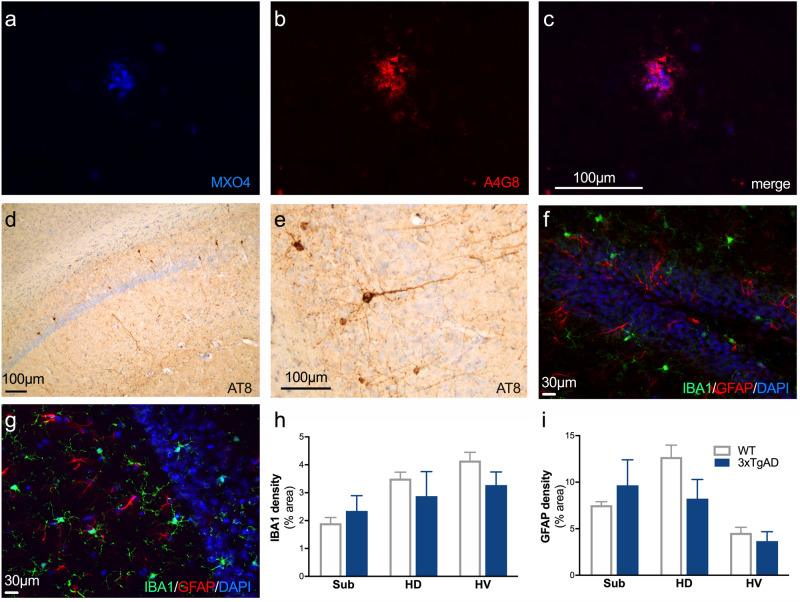
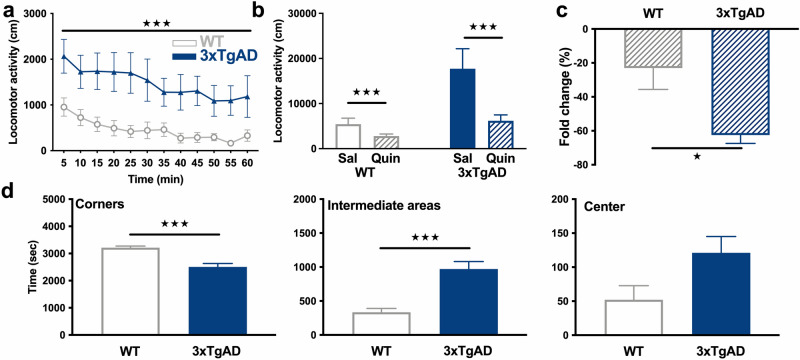
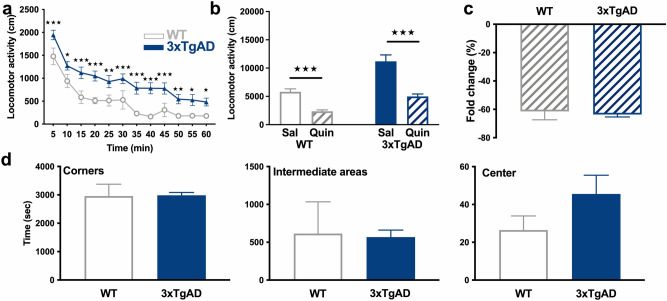
Alzheimer's disease (AD) is characterized by amyloid (Aβ) protein aggregation and neurofibrillary tangles accumulation, accompanied by neuroinflammation. With all the therapeutic attempts targeting these biomarkers having been unsuccessful, the understanding of early mechanisms involved in the pathology is of paramount importance. Dopaminergic system involvement in AD has been suggested, particularly through the appearance of dopaminergic dysfunction-related neuropsychiatric symptoms and an overall worsening of cognitive and behavioral symptoms. In this study, we reported an early dopaminergic dysfunction in a mouse model presenting both amyloid and Tau pathology. 3xTg-AD mice showed an increase of postsynaptic D2/3R receptors density in the striatum and D2/3-autoreceptors in SN/VTA cell bodies. Functionally, a reduction of anxiety-like behavior, an increase in locomotor activity and D2R hyper-sensitivity to quinpirole stimulation have been observed. In addition, microglial cells in the striatum showed an early inflammatory response, suggesting its participation in dopaminergic alterations. These events are observed at an age when tau accumulation and Aβ deposits in the hippocampus are low. Thus, our results suggest that early dopaminergic dysfunction could have consequences in behavior and cognitive function, and may shed light on future therapeutic pathways of AD.


Conflict of interest statement

The authors declare no competing interests.

Figures

Figure 1
Figure 1
Increases in postsynaptic D2/3R in the striatum of 3xTg-AD mice. (a) Schematic representation of different areas of the striatum which have been drawn manually according to the acetylcholinesterase staining anatomy. (b) example of in situ labeling with [125I]Epidepride. Color scale refers to activity in the autoradiograms (from 0 to 500 MBq/mg). (c) Assessment of D2/3R density by [125I]Epidepride specific binding ratio (SBR) quantification. (d) Example of staining in the striatum for DAPI (blue), DAT (green) and TH (red). Left: merge image and right: images for DAT and TH. (e) Quantification of the area occupied by DAT and TH staining. ★: p < 0.05.
Figure 2
Figure 2
Early microglial reactivity in the striatum of 3xTg-AD mice. (a) Example of immunofluorescence for DAPI (blue), GFAP (red) and IBA1 (green) in the striatum. (b) Quantification of the area occupied by GFAP and IBA1 staining. (c) Representative example of IBA1+ microglial cells (magenta) and DAPI (blue) showing soma co-staining. (d) Procedure for isolating a microglial cell and applying the Sholl filter in concentric circles from the center of the soma to the end of ramifications. (e) Quantification of intersection number in WT (grey, open circles) and 3xTg-AD (blue, triangles) mice. ★: p < 0.05.
Figure 3
Figure 3
Increases in presynaptic D2/3R, without inflammation modulation, in the midbrain of 3xTg-AD mice. (a) Schematic representation of different areas of the midbrain and hippocampus which have been drawn manually according to the acetylcholinesterase staining anatomy. (b) Example of in situ labeling with [125I]Epidepride. Color scale refers to activity in the autoradiograms (from 0 to 500 MBq/mg). (c) Assessment of the D2/3R density by [125I]Epidepride specific binding ratio (SBR) quantification. (d) Example of staining at the level of the midbrain for DAPI (blue) and TH (red). (e) Quantification of the area occupied by TH staining. (f) Example of immunofluorescence for DAPI (blue), IBA1 (green) and GFAP (red) in the substantia nigra. (g) Quantification of the area occupied by IBA1 and GFAP staining. ★: p < 0.05.
Figure 4
Figure 4
Sparse Aβ deposits restricted to the subiculum and low Tau levels in the hippocampus of 3xTg-AD mice. (a–c) A weak positive labeling of amyloid plaques with MXO4 (blue, a) and A4G8 (red, b) is observed and restricted to the subiculum. (c) Merge image of A and B. (d) A weak positive labeling for AT8 is observed only at the level of the hippocampus. (e) Example of positive AT8 cells showing positive cell bodies and neurites. (f,g) Example of immunofluorescence for DAPI (blue), IBA1 (green) and GFAP (red) in dentate gyrus (f) and dorsal hippocampus (g). (h,i) Quantification of the area occupied by IBA1 (h) and GFAP (i) staining in hippocampal subdivisions.
Figure 5
Figure 5
Behavioral alterations in 12-month-old 3xTg-AD mice. (a) Locomotor activity of WT (grey, open circles) and 3xTg-AD (blue, triangles) mice at baseline in 5 min blocks. (b) Total distance traveled, in response to saline (Sal) and quinpirole (Quin), a D2R agonist, in WT and 3xTg-AD mice. (c) Fold change in locomotion induced by quinpirole as compared to saline. (d) From left to right, time spent in corners, intermediate areas and central square of the open field during the baseline test in WT and 3xTg-AD mice. ★: p < 0.05, ★★: p < 0.01, ★★★: p < 0.001.
Figure 6
Figure 6
No dopaminergic-related behavioral alterations in 4-month-old 3xTg-AD mice. (a) Locomotor activity of WT (grey, open circles) and 3xTg-AD (blue, triangles) mice at baseline in 5 min blocks. (b) Total distance traveled, in response to saline (Sal) and quinpirole (Quin) in WT and 3xTg-AD mice. (c) Fold change in locomotion induced by quinpirole as compared to saline. (d) From left to right, time spent in corners, intermediate areas and central square of the open field during the baseline test in WT and 3xTg-AD mice. ★★★: p < 0.001.

References

    1. Ceyzériat K, et al. Learning from the past: A review of clinical trials targeting amyloid, tau and neuroinflammation in Alzheimer's disease. Curr. Alzheimer Res. 2020;17:112–125. doi: 10.2174/1567205017666200304085513. - DOI - PubMed
    1. D'Amelio M, Puglisi-Allegra S, Mercuri N. The role of dopaminergic midbrain in Alzheimer's disease: Translating basic science into clinical practice. Pharmacol. Res. 2018;130:414–419. doi: 10.1016/j.phrs.2018.01.016. - DOI - PubMed
    1. Cohen AD, et al. Early striatal amyloid deposition distinguishes Down syndrome and autosomal dominant Alzheimer's disease from late-onset amyloid deposition. Alzheimers Dement. 2018;14:743–750. doi: 10.1016/j.jalz.2018.01.002. - DOI - PMC - PubMed
    1. Hanseeuw BJ, et al. Striatal amyloid is associated with tauopathy and memory decline in familial Alzheimer's disease. Alzheimers Res. Ther. 2019;11:17. doi: 10.1186/s13195-019-0468-1. - DOI - PMC - PubMed
    1. Joyce JN, Murray AM, Hurtig HI, Gottlieb GL, Trojanowski JQ. Loss of dopamine D2 receptors in Alzheimer's disease with parkinsonism but not Parkinson's or Alzheimer's disease. Neuropsychopharmacology. 1998;19:472–480. doi: 10.1016/S0893-133X(98)00044-X. - DOI - PubMed

Publication types