. 2021 Sep 30;4(1):1143.
doi: 10.1038/s42003-021-02672-3.

Neuronal let-7b-5p acts through the Hippo-YAP pathway in neonatal encephalopathy

Affiliations

Neuronal let-7b-5p acts through the Hippo-YAP pathway in neonatal encephalopathy

Vennila Ponnusamy et al. Commun Biol. .

Abstract

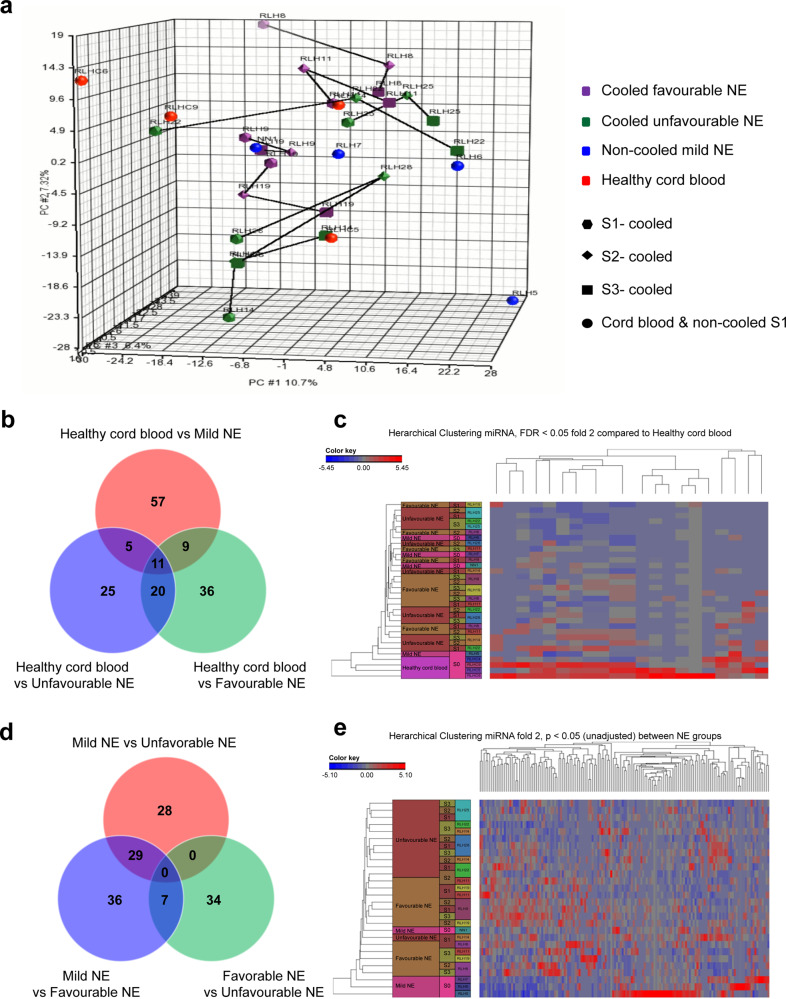
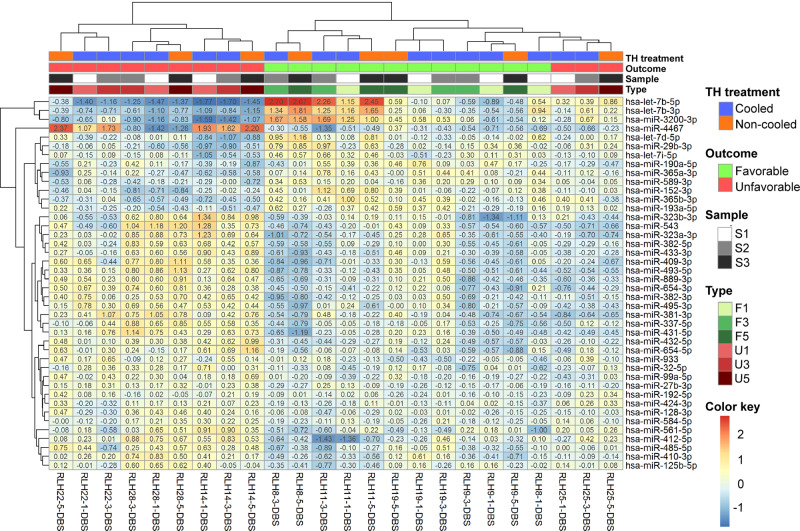
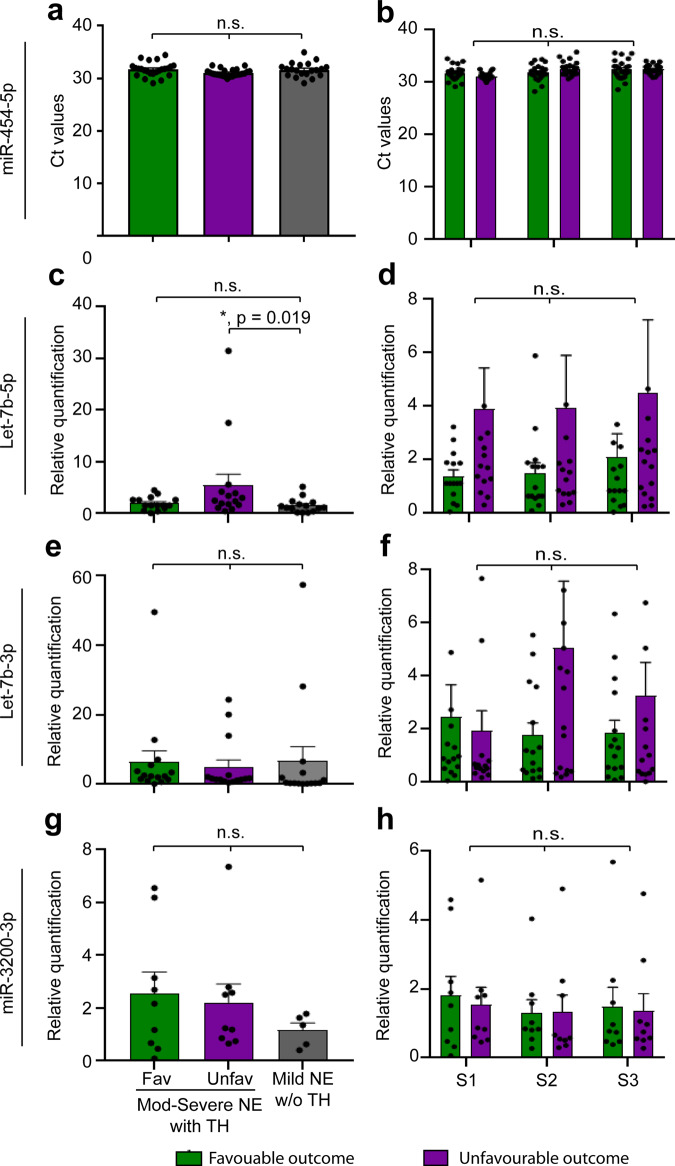
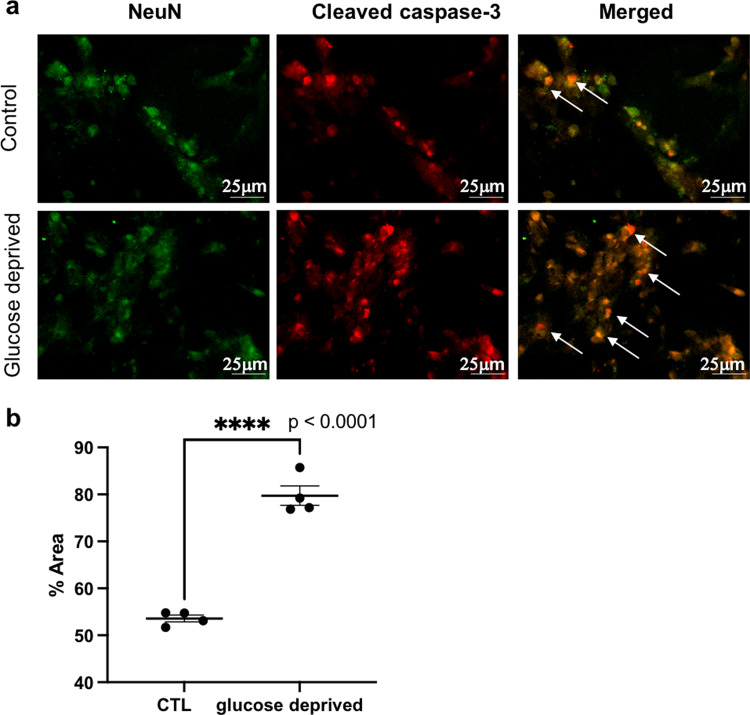
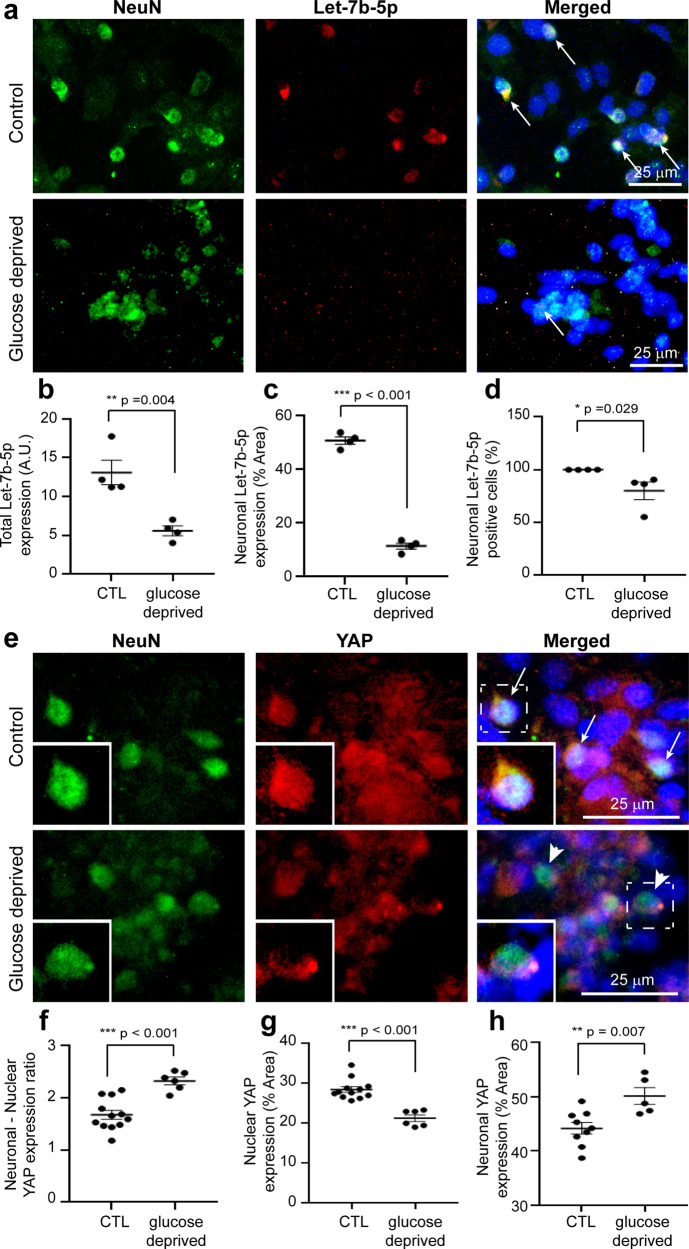
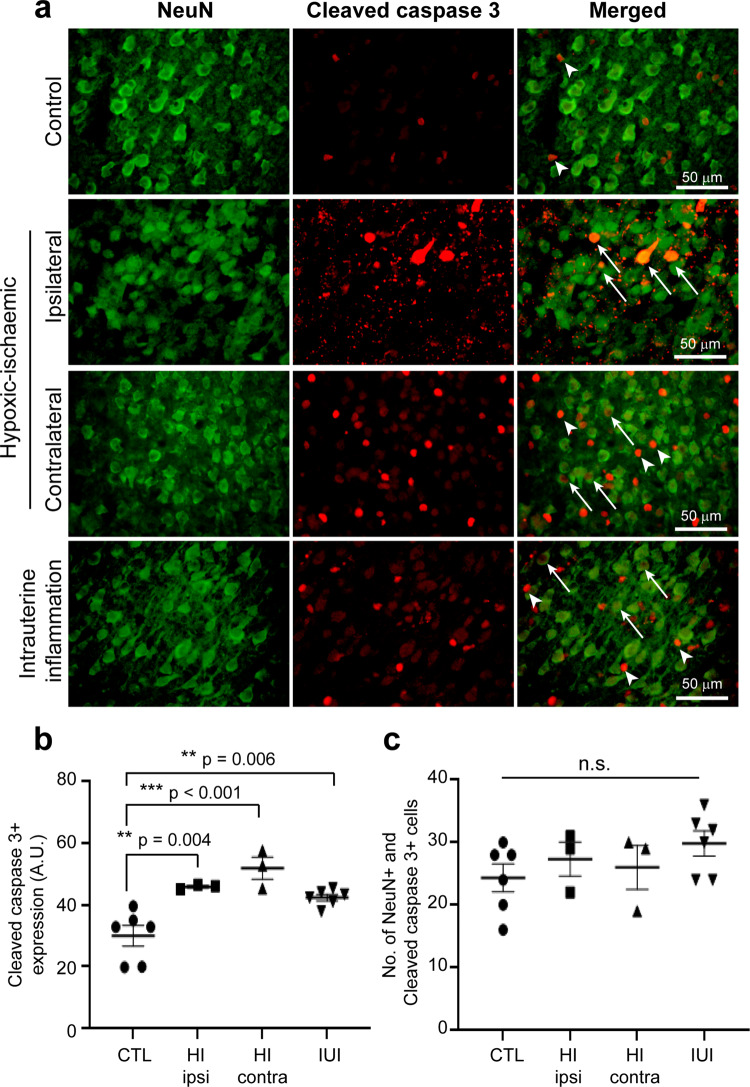
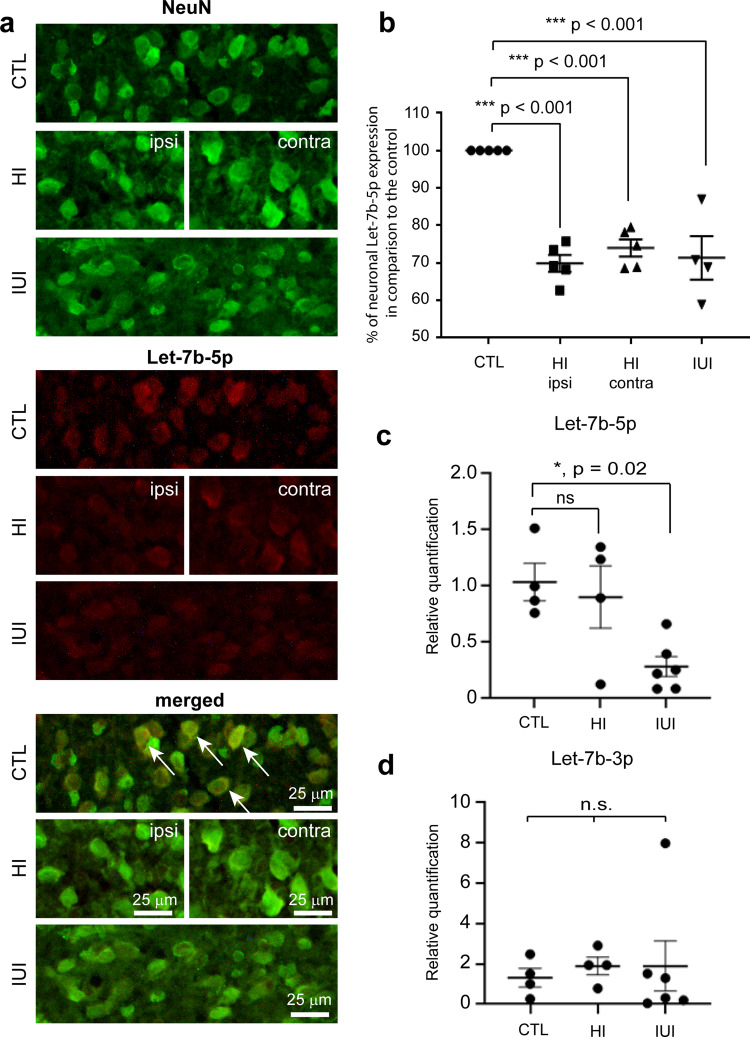
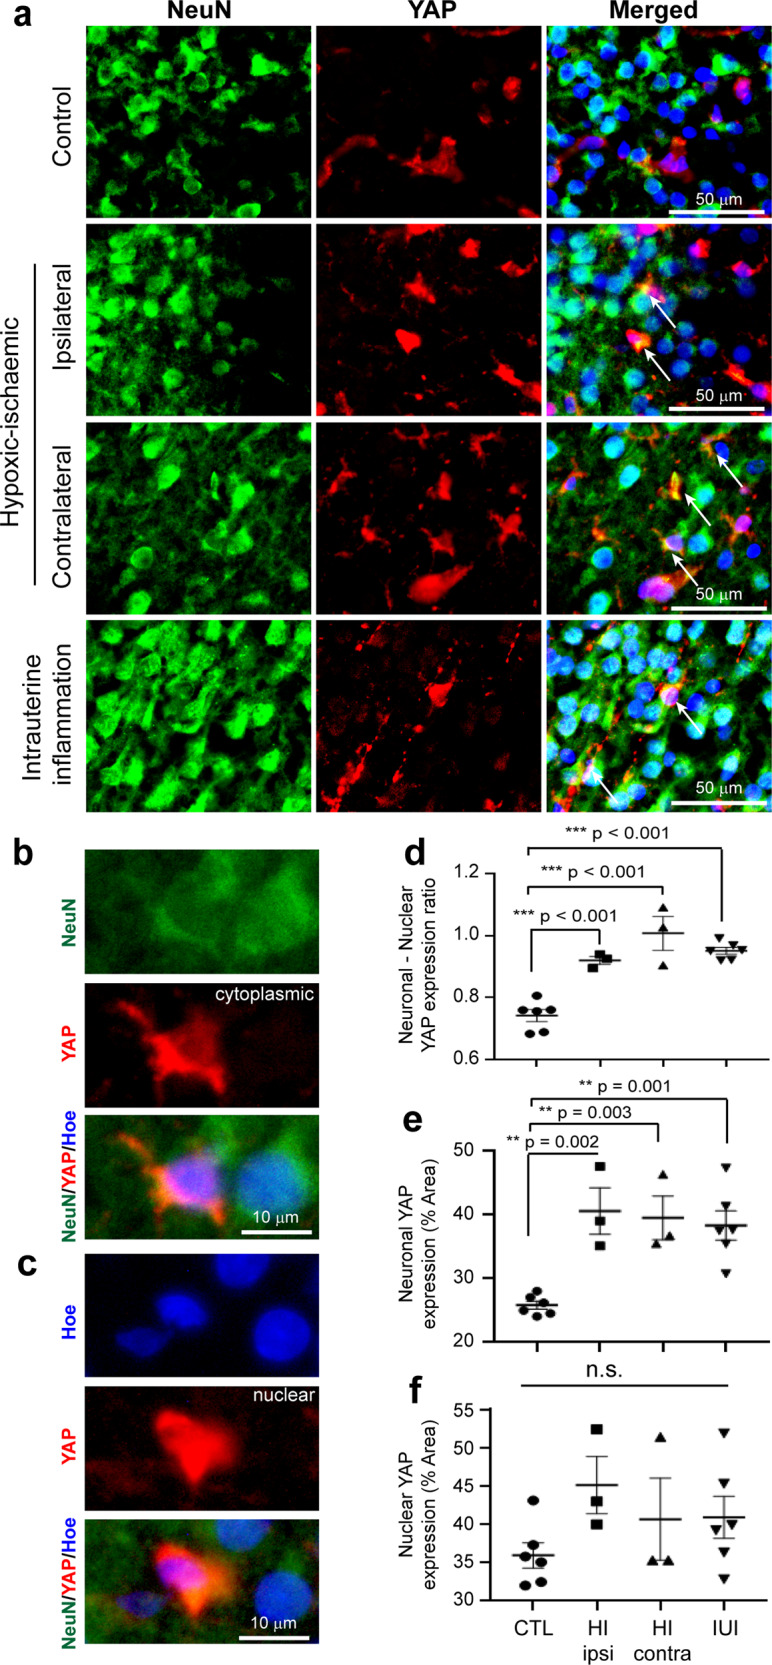
Despite increasing knowledge on microRNAs, their role in the pathogenesis of neonatal encephalopathy remains to be elucidated. Herein, we identify let-7b-5p as a significant microRNA in neonates with moderate to severe encephalopathy from dried blood spots using next generation sequencing. Validation studies using Reverse Transcription and quantitative Polymerase Chain Reaction on 45 neonates showed that let-7b-5p expression was increased on day 1 in neonates with moderate to severe encephalopathy with unfavourable outcome when compared to those with mild encephalopathy. Mechanistic studies performed on glucose deprived cell cultures and the cerebral cortex of two animal models of perinatal brain injury, namely hypoxic-ischaemic and intrauterine inflammation models confirm that let-7b-5p is associated with the apoptotic Hippo pathway. Significant reduction in neuronal let-7b-5p expression corresponded with activated Hippo pathway, with increased neuronal/nuclear ratio of Yes Associated Protein (YAP) and increased neuronal cleaved caspase-3 expression in both animal models. Similar results were noted for let-7b-5p and YAP expression in glucose-deprived cell cultures. Reduced nuclear YAP with decreased intracellular let-7b-5p correlated with neuronal apoptosis in conditions of metabolic stress. This finding of the Hippo-YAP association with let-7b needs validation in larger cohorts to further our knowledge on let-7b-5p as a biomarker for neonatal encephalopathy.


Conflict of interest statement

The authors declare no competing interests.

Figures

Fig. 1
Fig. 1. Identification of candidate miRNA through miRNA next-generation sequencing.
a PCA plot of all neonates examined with miRNA NGS according to their groups (Group 1A: moderate to severe NE with TH and favourable outcome (purple hexagon; S1, purple diamond; S2, purple square; S3), Group 1B: moderate to severe NE with TH and unfavourable outcome (green hexagon; S1, green diamond; S2, green square; S3), Group 2: mild NE without TH (blue circle), and Group 3: umbilical cord blood of healthy neonates (red circles). b Venn diagram showing the number of significant differential expression of miRNA between all three groups with umbilical cord blood. c Heatmap of all neonates in miRNA NGS with 17 significant miRNAs. d Venn diagram showing the differential expression of miRNA between all three groups excluding umbilical cord blood. e Heatmap of all neonates in miRNA NGS excluding umbilical cord blood showing no significant miRNAs.
Fig. 2
Fig. 2. Hierarchical clustering analysis of all the differentially expressed miRNAs by outcome.
Hierarchical clustering analysis using the R program showing let-7b in the forms of 3p and 5p strands to be the most significantly changed miRNA in the moderate to severe NE neonates with TH treatment based on outcome. F1, F3 and F5 represent favourable outcome on days 1, 3 and 5 respectively; while U1, U3 and U5 represent unfavourable outcome on days 1, 3 and 5 respectively.
Fig. 3
Fig. 3. Expression of control and candidate miRNAs in neonates with encephalopathy.
a, c, e and g show the expression of miR-454-5p, let-7b-5p, let-7b-3p and miR-3200-3p respectively in all groups at S1 samples. Similarly graphs b, d, f and h show the temporal expression of miR-454-5p, let-7b-5p, let-7b-3p and miR-3200-3p, respectively, at various time points (S1, S2 and S3 samples) in neonates with moderate to severe NE with TH and favourable and unfavourable outcome. Green bars represent favourable outcome, while purple bars represent unfavourable outcome. Neonates with mild NE not receiving TH were denoted in grey bars. Relative quantification denotes 2-ΔΔCt of the candidate miRNAs in comparison to endogenous control miRNA, miR-454-5p. Column graphs showing mean with error bars representing SEM. ns, not significant; * denote p < 0.05 using Kruskal–Wallis test for nonparametric data. Each group consists of n = 15 neonates. NE neonatal encephalopathy, TH therapeutic hypothermia, Fav favourable outcome, Unfav unfavourable outcome.
Fig. 4
Fig. 4. Neuronal apoptosis in normal and glucose-deprived neuronal cells in vitro.
a Images of NeuN positive neuronal cells (green) with cleaved caspase-3 (red) and coexpression is shown (yellow) in the control and glucose-deprived group. Arrows indicate coexpression. b Graph shows the significant increase in neuronal cleaved caspase-3 expression after glucose-derivation compared to the control group. Error bars represent mean with SEM. n = 4. **** denote significant p < 0.0001 using unpaired t test. Scale bar = 25 μm. CTL control.
Fig. 5
Fig. 5. Neuronal expression of let-7b-5p and YAP in normal and glucose-deprived neuronal cells in vitro.
a Images of NeuN positive neuronal cells (green) with let-7b-5p (red) and coexpression is shown (yellow) in the control and glucose-deprived group. Arrows indicate coexpression. b–d Graphs showing significant decrease in total let-7b-5p (b), neuronal let-7b-5p (c) and the percentage of neuronal let-7b-5p (d) after glucose-derivation compared to the control group. e Images of NeuN positive neuronal cells (green) with YAP (red) and coexpression is shown (yellow) in the control (arrows indicate cytoplasm expression) and glucose-deprived group (arrowheads indicate nuclear expression). f–h Graphs showing significant increase in neuronal/nuclear ratio (f), a significant decrease in nuclear YAP expression (g) and a significant increase in neuronal YAP expression (h) after glucose-derivation compared to the control group. Error bars represent mean with SEM. n = 4–12. *, **, *** denote significant p < 0.05, p < 0.01, p < 0.001, respectively, using unpaired t test. Scale bar = 25 μm. CTL control.
Fig. 6
Fig. 6. Neuronal apoptosis in the cerebral cortex of the rat neonatal encephalopathy models.
a Images of neuronal cells (NeuN positive, green) that can undergo apoptosis (cleaved caspase-3 positive, red) and coexpression is shown (yellow) in the cerebral cortex of control (arrowheads indicate non-neuronal apoptotic staining), hypoxic-ischaemic in the ipsilateral (arrows indicate neuronal apoptotic staining) and contralateral region (arrows indicate neuronal apoptotic staining), and intrauterine inflammation model (arrows and arrowheads indicate neuronal and non-neuronal apoptotic staining, respectively). b, c Graphs (b) show the statistical significance in cleaved caspase-3 apoptosis and (c) show no statistical significance in neuronal cell counts co-expressing cleaved caspase-3. Error bars represent mean with SEM (n = 3–6 per group). ns not significant; ** and *** denote significant p < 0.01 and p < 0.001, respectively, using ANOVA with Dunnett’s multiple comparisons test. Scale bar = 50 μm. CTL control, HI hypoxic-ischaemic, ipsi ispsilateral side, contra contralateral side, IUI intrauterine inflammation.
Fig. 7
Fig. 7. Expression of let-7b-5p in the cerebral cortex in all animal models.
a Images of NeuN positive neuronal cells (green) with let-7b-5p expression (red) and coexpression is shown (yellow) in the cerebral cortex of control (arrows indicate coexpression), hypoxic-ischaemic in the ipsilateral and contralateral region and intrauterine inflammation model. b Graph showing the statistical significance between the neonatal encephalopathy models vs. control groups (n = 4–6 per group). cd Relative expression (2-ΔΔCt) of let-7b-5p (c) and let-7b-3p (d) in peripheral blood in the form of DBS from the rat animal models. Error bars represent mean with SEM. ns not significant, * and *** denote significant p < 0.05 and p < 0.001, respectively using ANOVA with Dunnett’s multiple comparisons test. Scale bar = 25 μm. CTL control, HI hypoxic-ischaemic, ipsi ispsilateral side, contra contralateral side, IUI intrauterine inflammation.
Fig. 8
Fig. 8. Neuronal expression of YAP in the cerebral cortex of the rat neonatal encephalopathy models.
a Images of NeuN positive neuronal cells (green) with YAP (red) and coexpression is shown (yellow) in the cerebral cortex of control, hypoxic-ischaemic in the ipsilateral (arrows indicate YAP positive neurones) and contralateral region (arrows indicate YAP positive neurones), and intrauterine inflammation model (arrows indicate YAP positive neurones). b Neuronal cytoplasmic YAP positive immunostaining is determined by strong coexpression of NeuN and YAP. c Nuclear YAP positive immunostaining is determined by strong coexpression of YAP with Hoechst staining in the nucleus. d–f Graphs showing a significant increase in the neuronal/nuclear ratio (d), significant increase in neuronal (e), but no changes in nuclear (f) YAP expression. Error bars represent mean with SEM. n = 3–6 per group. ns not significant; ** and *** denote significant p < 0.01 and p < 0.001, respectively, using ANOVA with Dunnett’s multiple comparisons test. Scale bar = 50 μm for (a) and 10 μm for (b, c). CTL control, HI hypoxic-ischaemic, ipsi ispsilateral side, contra contralateral side, IUI intrauterine inflammation.

References

    1. Lee ACC, et al. Intrapartum-related neonatal encephalopathy incidence and impairment at regional and global levels for 2010 with trends from 1990. Pediatr. Res. 2013;74:50–72. doi: 10.1038/pr.2013.206. - DOI - PMC - PubMed
    1. Edwards AD, et al. Neurological outcomes at 18 months of age after moderate hypothermia for perinatal hypoxic ischaemic encephalopathy: synthesis and meta-analysis of trial data. BMJ. 2010;340:c363. doi: 10.1136/bmj.c363. - DOI - PMC - PubMed
    1. Jacobs, S. E. et al. Cooling for newborns with hypoxic ischaemic encephalopathy. Cochrane Database Syst. Rev. 2013, Cd00331, (2013). - PMC - PubMed
    1. Ponnusamy V, Yip P. The role of microRNAs in newborn brain development and hypoxic ischaemic encephalopathy. Neuropharmacology. 2019;149:55–65. doi: 10.1016/j.neuropharm.2018.11.041. - DOI - PubMed
    1. Cheng G. Circulating miRNAs: Roles in cancer diagnosis, prognosis and therapy. Adv. Drug Deliv. Rev. 2015;81C:75–93. doi: 10.1016/j.addr.2014.09.001. - DOI - PubMed

Publication types