. 2021 Oct;18(10):1181-1191.
doi: 10.1038/s41592-021-01274-5. Epub 2021 Sep 30.

Systematic investigation of cytokine signaling activity at the tissue and single-cell levels

Affiliations

Systematic investigation of cytokine signaling activity at the tissue and single-cell levels

Peng Jiang et al. Nat Methods. 2021 Oct.

Abstract

Cytokines are critical for intercellular communication in human health and disease, but the investigation of cytokine signaling activity has remained challenging due to the short half-lives of cytokines and the complexity/redundancy of cytokine functions. To address these challenges, we developed the Cytokine Signaling Analyzer (CytoSig; https://cytosig.ccr.cancer.gov/ ), providing both a database of target genes modulated by cytokines and a predictive model of cytokine signaling cascades from transcriptomic profiles. We collected 20,591 transcriptome profiles for human cytokine, chemokine and growth factor responses. This atlas of transcriptional patterns induced by cytokines enabled the reliable prediction of signaling activities in distinct cell populations in infectious diseases, chronic inflammation and cancer using bulk and single-cell transcriptomic data. CytoSig revealed previously unidentified roles of many cytokines, such as BMP6 as an anti-inflammatory factor, and identified candidate therapeutic targets in human inflammatory diseases, such as CXCL8 for severe coronavirus disease 2019.


Figures

Extended Data Fig. 1
Extended Data Fig. 1. Curation of Human Cytokine Response Data
a, The histogram of experimental cell-type models among collected treatment profiles. For each cell-type model, we counted the number of differential expression profiles upon cytokine treatment in that model as the Profile Count. b, The count of treatment response profiles for top-20 most frequently used cell models. c, The histogram of treatment durations among collected treatment profiles. For each duration, we counted the number of differential expression profiles upon cytokine treatment with that duration as the Profile Count. d, The count of treatment response profiles for top-20 most frequently used durations. e, The histogram of experimental doses among collected treatment profiles. For each dose, we counted the number of differential expression profiles upon cytokine treatment with that dose as the Profile Count. f, The count of treatment response profiles for top-20 most frequently used doses. g, The association between cytokine response profiles’ quality and treatment duration. We evaluated the quality for each treatment response profile as the correlation of expression levels between target gene scores and its ligand or receptor. Each dot represents one cytokine response profile with its treatment duration on the X-axis and median correlation across all TCGA or GTEx cohorts on the Y-axis. Activin A has high quality data with long treatment durations, while EGF has high quality data with transient treatment duration. h, The composite profile quality depends on the number of independent experiments merged. Four cytokines have more than 100 response profiles passing quality filters. We evaluated the quality of composite profiles after down-sampling the number of independent experiments merged. The quality metric is the correlation of expression between target genes and its ligand (blue) or receptor (yellow). The dots and error bars represent the median and standard deviation from 100 randomizations. Black triangle dots represent the down-sampling point that achieves 90% of the highest correlation. i, Similarities among IFNG response signatures from diverse cell models. An average response signature was computed for each cell model. Then, average response signatures were hierarchically clustered based on Pearson correlations.
Extended Data Fig. 2
Extended Data Fig. 2. Target Genes in Response to Cytokine Treatments
a, Differential expression of target cytokines (x-axis) regulated by IL4 or BMP6 (y-axis). The thick line represents the median value. The bottom and top of the boxes are the 25th and 75th percentiles (interquartile range). The whiskers encompass 1.5 times the interquartile range. The difference between group values and zero among treatment profiles that passed quality controls was tested using the two-sided Wilcoxon signed-rank test, with p-values and sample counts labeled. b, Gene set enrichment among cytokine response targets. The normalized enrichment score from the gene set enrichment analysis (GSEA) represents the overall enrichment of pathway members among target genes from each cytokine’s composite signature. c, Normalized enrichment scores from panel b among pairs of hallmark categories and cytokines. d, Gating strategy of flow analysis. The forward scatter height (FSC-H) and side scatter height (SSC-H) are used for dead cell and cell debris removal. FSC-H width and SSC-H width are used to gate the single cells. We include unstained cells to define the gate threshold that separates positive populations and negative control cells.
Extended Data Fig. 3
Extended Data Fig. 3. Co-regulation between Cytokines on Target Genes
a, Target co-regulation between TNFA and other anti-inflammatory cytokines. b, Target co-regulation between IFNG and other cytokines.
Extended Data Fig. 4
Extended Data Fig. 4. BMP6 represses CXCL8 and CCL2 induced by IL1B
a, Representative plots of CXCL8 and CCL2 protein levels upon BMP6 and IL1B cotreatments in A549 cells. We utilized flow cytometry to measure CXCL8 and CCL2 intracellular protein levels after 12-hour treatments with IL1B, IL1B+BMP6, and media control. The X-axis shows the signal intensity measured by flow cytometry. The Y-axis shows the A549 fraction distribution with modal normalization, scaling the maximum Y-axis value to 100%. The percentage of cells with signal intensity above the gate threshold (vertical line, panel c) is indicated. b, Summary plots of CXCL8 and CCL2 protein levels upon BMP6 and IL1B treatments. In three cell-culture replicates, A549 and H1299 cells were treated either simultaneously or sequentially with combinations of BMP6 and IL1B. The mean fraction of cells with an intensity above the gate thresholds (defined in panel c) is plotted with standard deviations as error bars (n = 3 cell-culture replicates per condition). The two-sided Wilcoxon rank-sum test p-values were computed to compare groups. c, Gating strategy of flow analysis. The forward scatter height (FSC-H) and side scatter height (SSC-H) are used for dead cell and cell debris removal. FSC-H width and SSC-H width are used to gate the single cells. We include unstained cells to define the gate threshold that separates positive populations and negative control cells. d, CXCL8 and CCL2 soluble protein levels by ELISA in A549 cells. A549 cells were treated with BMP6 and IL1B in combinations for 24 hours. The mean soluble cytokine levels were measured by ELISA with standard error of the mean as error bars (n = 3 independent experiments).
Extended Data Fig. 5
Extended Data Fig. 5. CytoSig model selection
a, Prediction performance measured as the cross-validation (CV) R2 in TCGA cohorts. For each algorithm, median 5-fold CV R2 metrics across all TCGA datasets were shown at different penalty values with standard error of the mean (SEM) as error bands. The horizontal line indicates 70% of the optimal CV R2 of ridge regression. The vertical line marks the lambda value of 10,000, the penalty used in the CytoSig model. b, Prediction performance measured as the cross-validation (CV) R2 metrics in GTEx cohorts, shown as panel a. c, Inference performance measured as the correlation between model coefficients and cytokine expression in TCGA cohorts. For each algorithm, we computed the median correlation values between model coefficients and cytokine ligand or receptor expression at different penalty values, with SEM as error bands. The vertical line marks the Lambda value of 10000, which is the penalty reaching 80% of the optimal correlation. XG Boost with tree learner cannot be evaluated for inference performance because its tree structure cannot provide coefficients as cytokine response. d, Inference performance measured as the correlation between model coefficients and cytokine expression in GTEx cohorts, shown as panel c.
Extended Data Fig. 6
Extended Data Fig. 6. CytoSig Predicts Cytokine Activities in Tumors and Cancer Therapy Response
a, Receiver Operating Characteristic (ROC) curve of IFNG activity prediction. For each dataset from the ICGC, the ROC curve presents false-positive rates against true-positive rates at different IFNG activity thresholds. b, Area under the ROC Curve (AUC) as the prediction accuracy. We computed the ROC curves for all cytokines following the procedure in panel e. Each bar represents the median AUC among all ICGC cohorts, with standard errors of the mean as error bars (n=9 independent datasets). The AUC baseline is 0.5, representing a random prediction. We applied the one-sided Wilcoxon signed-rank test to evaluate whether AUC values are higher than 0.5 for each signal, and converted p-values to false discovery rates (FDR) through the Benjamini-Hochberg correction. c, IFNG activity predicts overall survival upon Atezolizumab treatment in urothelial carcinoma. The Kaplan-Meier plot presents patient fractions (Y-axis) with different overall survival (X-axis) among pre-treatment tumors with high and low IFNG activities predicted by CytoSig. The activity cutoff is selected through maximizing the difference between high and low groups. The p-value was from the two-sided Wald test using continuous values without cutoffs. d, Signaling activity computed by CytoSig better predicts clinical outcome than other metrics. We compared three approaches to compute cytokine activities, including expression levels of ligand, receptors, and CytoSig predictions. For IFNG activity, we also utilized a geneset signature developed by Merck to predict checkpoint blockade response, as well as the PDL1 expression. The association between activity and survival outcome was computed as the Wald test z-score in Cox-PH regression.
Extended Data Fig. 7
Extended Data Fig. 7. CytoSig Reliably Predicts Cytokine Activity in Single Cells
a, Result for a liver cancer cohort (n=11 cell types per boxplot). The thick line represents the median value. The bottom and top of the boxes are the 25th and 75th percentiles (interquartile range). The whiskers encompass 1.5 times the interquartile range. b, Result for a COVID-19 peripheral blood cohort (n=15 cell types per boxplot). The boxplot is defined as panel a.
Extended Data Fig. 8
Extended Data Fig. 8. Differential signaling activities from COVID-19 samples
The heatmap presents cytokines whose predicted signaling activities are significantly different among severe, mild, healthy individuals in a COVID-19 peripheral blood cohort (false discovery rate < 0.05).
Extended Data Fig. 9
Extended Data Fig. 9. Gene expression of cytokines with differential signaling activities from COVID-19 samples
IL1B and IL10 gene expression in diverse cell types. The violin plots present the expression of IL1B and IL10 in patient groups, with distributions smoothed by a kernel density estimator.
Extended Data Fig. 10
Extended Data Fig. 10. Potential Therapeutic Targets to Overcome COVID-19 Induced Tissue Damage
a, Target genes of cytokines with elevated activities among severe patients. Arrow-headed edges indicate up-regulation, and flat-headed edges indicate down-regulation. For each cell type, red square nodes represent cytokines with high activity scores among severe patients, and blue diamonds represent anti-inflammatory signals with low activities. The network only includes targets whose expression values are significantly higher compared between severe and mild patients, and between disease and healthy controls. b, Example of gene expression in different patient groups. The violin plots present gene expression distributions in patient groups, smoothed by a kernel density estimator. Examples from lavage macrophages are in the left, and peripheral blood neutrophils are in the right. Y axis indicated values from individual cells.
Fig. 1:
Fig. 1:. Curation of Human Cytokine Response Data
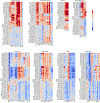
a, The Framework for Data Curation (FDC). The FDC can automatically process RNA-Seq and MicroArray transcriptomic data from public repositories. Then, with FDC’s natural language processing functions, curators read the metadata of each sample to annotate experimental conditions, including cytokine treatment, cell model, dose, and duration. The output is differential log2-fold change (logFC) upon treatment. b, Two Uses of the CytoSig framework: 1, Query a gene name to view upstream cytokine regulators or downstream target genes (if the query is a cytokine); 2, Predict cytokine signaling activities through transcriptomic profiles using a linear regression model. (Input: the input transcriptomic profile of the sample as the response variable in regression; Signature: The average response signature of cytokines as explanatory covariates; Activity: the regression coefficients reflecting signaling activities.) c, Count of treatment response profiles with biological replicates for different molecule types. d, Example correlation between the expression of IL10 target genes and its ligand or receptor. Each dot represents a TCGA lung adenocarcinoma sample (n=513). The X-axis shows the expression of IL10 or receptor (IL10RA + IL10RB). The Y-axis presents the expression scores of IL10 targets from a monocyte treatment experiment. Pearson correlation (r) indicates the human physiological relevance of the current data. e, Distribution of target score correlations. Correlations were computed using all cytokine response profiles and TCGA or GTEx expression matrices. Distributions of correlations are shown by violin plots, smoothed by a kernel density estimator, for both real and randomized data through gene label permutations. The p-value, calculated with the one-sided Wilcoxon signed-rank test, represents the statistical significance of correlations being higher than zero. (n = 112 ligands and n = 111 receptors). f, Similarity of signaling response profiles. We created a composite signature for each cytokine that consisted of the median logFC across all experiments and then calculated pairwise correlations between composite signatures for the hierarchical clustering. Red branches highlight the clusters of similar cytokines discussed in the manuscript.
Fig. 2:
Fig. 2:. Cross-Regulation Hierarchies within Cytokines
a, Differential expression of target cytokines (x-axis) in response to primary cytokines (y-axis). Each dot represents a treatment profile. Blue solid points are profiles that pass quality controls, with numbers labeled on the top of box-plots. The thick line represents the median value. The bottom and top of the boxes are the 25th and 75th percentiles (interquartile range). The whiskers encompass 1.5 times the interquartile range. The p-value, testing whether group values are different from zero, was calculated through the two-sided Wilcoxon signed-rank test. b, Inter-cytokine regulation hierarchy. Between each pair of regulators (X-axis) and targets (Y-axis), the log2-fold change (logFC) values are the medians among profiles that passed our quality controls. The plot only includes regulators and targets with at least one logFC larger than two. The upper heatmap includes target ligands, and the lower part includes target receptors with ligands in brackets. The NFKB and interferon transcriptional groups are labeled with boxes. c, Differential logFC values of GZMA, GZMB, and PRF1 upon TGFB1 treatment, shown by violin plots, smoothed by a kernel density estimator. Each dot represents an independent profile. The p-value, testing whether the T-cell group values are different from zero, was calculated through the two-sided Wilcoxon signed-rank test (n = 11 independent treatment profiles for each gene). d, Perforin intracellular levels measured by flow cytometry upon TGFB1 treatments in human primary CD8 T cells. The X-axis shows the signal intensity. The Y-axis shows the T-cell fraction with modal normalization, scaling the maximum Y-axis to 100%. Vertical line indicates percentage of T cells with signal intensity above the gate threshold (defined in Extended Data Fig. 2d). e, Granzyme and Perforin protein levels upon TGF-beta treatments in human and mouse CD8 T cells. The mean percentage of T cells with an intensity above the gate threshold is shown, with standard deviations as error bars (n = 3 cell-culture replicates per condition). The two-sided Wilcoxon rank-sum test was used to compare groups.
Fig. 3:
Fig. 3:. Antagonizing Interactions between Cytokines on Target Genes
a, Co-regulation between IL1B and other cytokines on target genes. Each dot represents a target gene. The X and Y axes show the median log2-fold change (logFC). Blue (co-enhance) represents targets with significant positive values on both axes (false discovery rate < 0.05). Green (co-repress) represents targets with significant negative values on both axes. Orange (antagonize) represents targets with a significant positive score from one signal and a negative one from the other. Selected antagonized targets are labeled. b, Fractions of cytokine co-regulation type. For each cytokine pair and their targets, we counted the fractions of significant co-regulation in the three categories illustrated in panel a. c, Antagonistic relationships among cytokines on target genes. Each flat-end edge indicates that the first cytokine represses targets of the second one. The edge width is proportional to the number of antagonized targets. The node pie chart represents the in and out degrees. d, Antagonizing regulatory relationships between cytokines and anti-inflammatory signals. The heatmap presents the number of target genes induced by a cytokine (row) but repressed by an anti-inflammatory signal (column). The similarities are shown with the hierarchical clustering trees with Pearson correlation as the distance metric.
Fig. 4:
Fig. 4:. CytoSig Predicts Cytokine Activities in Human Diseases
a, IL1B activities in blood predict anti-IL1B therapy response in arthritis. Each dot represents a blood sample. The X-axis shows patients with similar therapy responses. The Y-axis shows the IL1B activities predicted by CytoSig at an early time point, shown by violin plots smoothed by a kernel density estimator. Spearman correlation between clinical response in patient groups and the median IL1B activity with a two-sided t-test p-value is indicated. b, IFN1 activity in blood correlates with antibody titer upon IFNA vaccine in systemic lupus. Each dot represents a blood sample. The X-axis presents the titer of IFNA antibody post immunization. The Y-axis presents the IFN1 differential activity predicted by CytoSig. Spearman correlation between X and Y axes with a two-sided t-test p-value is indicated (n=36). c, Predicted activity change upon anti-cytokine therapies. Each dot represents an anti-cytokine therapy study in inflammatory diseases, with targets on the X-axis. Grey labels represent mouse model studies for cytokines without clinical data. The Y-axis presents the average differential activity between post- and pre-treatments. The accuracy is computed as the fraction of cytokines with median activity reduction smaller than one, with p-value from the two-sided Wilcoxon signed-rank test. d, TGFB activity changes upon neutralizing antibody treatments. The first antibody inhibits all TGFB isoforms (123, 7 mice) and the second antibody inhibits only TGFB1 and 2 (12, 6 mice). The anti-TGFB3 profile (123/12) was the differential profile between the pan-TGFB and the TGFB1,2 specific groups. The TGFB1 and TGFB3 activities predicted by CytoSig were shown by bar plots, with two-sided p-values from the permutation test with 10,000 randomizations. e, VEGF activities in pre-treatment tumors predict anti-VEGF therapy response, in Sunitinib and Bevacizumab clinical studies. The Kaplan-Meier plot presents patient fractions (Y-axis) with survival length (X-axis, progression-free or overall) among pre-treatment tumors with high and low VEGFA activities predicted by CytoSig. The activity cutoff is selected through maximizing the difference between high and low groups. The p-value was from the one-sided Wald test using continuous values without cutoffs.
Fig. 5:
Fig. 5:. CytoSig Predicts Cytokine Activity in Single-Cell RNASeq Data
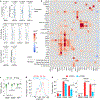
a, Single-cell signaling activities for STAT1-group cytokines among CD8 T cells using data from a COVID-19 study. For each single-cell (dot), the X-axis shows the STAT1 transcription factor (TF) activities. The Y-axis presents the average signaling activities among interferons and IL27. The color brightness indicates the local dot density. The p-value was calculated through the two-sided Wilcoxon rank-sum test, comparing cytokine activities of single cells with positive (n=1323) and negative (n=117) STAT1 activities. b, Receiver operating characteristic (ROC) curves for CD8 T cell effector cytokines. The ROC curve presents false positive rates against true positive rates of TF activity prediction at different cytokine activity thresholds using the data in panel a. The diagonal line represents random expectation. c, Accuracy of single-cell cytokine activities prediction. The area under the ROC curve (AUC) for each cell type was computed for each TF and its cytokine families, using the COVID-19 single-cell dataset analyzed in panel a and b. Each dot represents a cell type (n=12 cell types per boxplot). The thick line represents the median value. The bottom and top of the boxes are the 25th and 75th percentiles (interquartile range). The whiskers encompass 1.5 times the interquartile range. d, Accuracy of single-cell cytokine activities prediction among many single-cell datasets. Each dot presents the median AUC among all cell types (Y-axis) in a single cell dataset. The results were shown for all cytokine and TF combinations using box plots as panel c (n=10 cytokine-TF combinations per boxplot).
Fig. 6:
Fig. 6:. Signaling Features underlying the COVID-19 Symptom Difference
a, Sample source sites. We analyzed single-cell RNASeq datasets from the broncho-alveolar lavage and peripheral blood samples from COVID-19 patients. b, IL10 activities in Macrophage from lavage. Each dot presents a single cell from the COVID-19 study with t-SNE (t-distributed stochastic neighbor embedding) coordinates computed as the original publication. The color represents the predicted IL10 activity. The circles highlight the cluster of macrophages. c, Enrichment of IL10 activities among severe patients in lavage macrophage. The violin plots present IL10 activity distributions in different patient groups, smoothed by a kernel density estimator. The color legend is available at the bottom of panel b. The two-sided Wilcoxon rank-sum p-value is computed to compare severe (n=6 patients) and mild (n=3 patients) group activities. d, IFN1 activities in CD8 T cells from blood. The IFN1 activities in CD8+ T cells (circles) are shown as panel b, with UMAP (Uniform Manifold Approximation and Projection) coordinates from the original publication. e, Depletion of IFN1 activities among severe patients in peripheral blood CD8 T cells. The two-sided Wilcoxon rank-sum p-value is computed to compare severe (n=14 patients) and mild (n=13 patients) group activities within each cell type. f, Differential signaling activities in macrophage from lavage. The heatmap presents cytokines whose predicted signaling activities are significantly different between severe, mild, healthy individuals. g, Summary of signaling activities in COVID-19. The heatmap includes cell types with significant differences in signaling activities among severe, mild, and healthy individuals. Each cell shows the median value across all individuals in each group. Only cytokines with at least three significant values in at least three cell types are included.

References

    1. Lin J-X & Leonard WJ Fine-Tuning Cytokine Signals. Annu. Rev. Immunol 37, 295–324 (2019). - PMC - PubMed
    1. Zhang Y, Guan X-Y & Jiang P Cytokine and Chemokine Signals of T-Cell Exclusion in Tumors. Front. Immunol 11, (2020). - PMC - PubMed
    1. Ozaki K & Leonard WJ Cytokine and cytokine receptor pleiotropy and redundancy. J. Biol. Chem 277, 29355–29358 (2002). - PubMed
    1. Stenken JA & Poschenrieder AJ Bioanalytical chemistry of cytokines – A review. Analytica Chimica Acta vol. 853 95–115 (2015). - PMC - PubMed
    1. Rusinova I et al. Interferome v2.0: an updated database of annotated interferon-regulated genes. Nucleic Acids Res. 41, D1040–6 (2013). - PMC - PubMed

Publication types