. 2021 Oct;18(10):1253-1258.
doi: 10.1038/s41592-021-01257-6. Epub 2021 Sep 30.

High-resolution structural and functional deep brain imaging using adaptive optics three-photon microscopy

Affiliations

High-resolution structural and functional deep brain imaging using adaptive optics three-photon microscopy

Lina Streich et al. Nat Methods. 2021 Oct.

Abstract

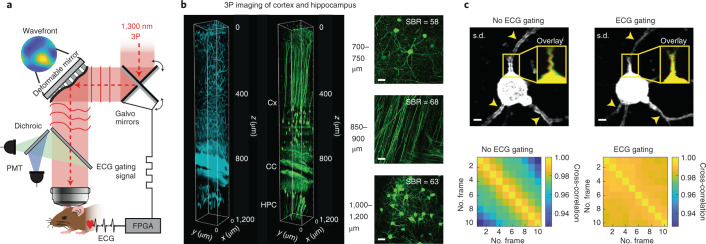
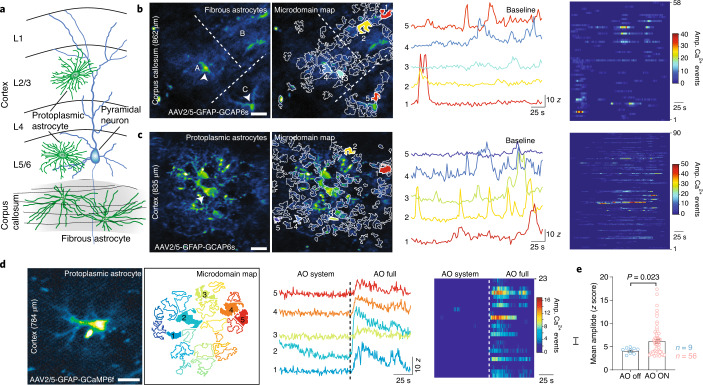
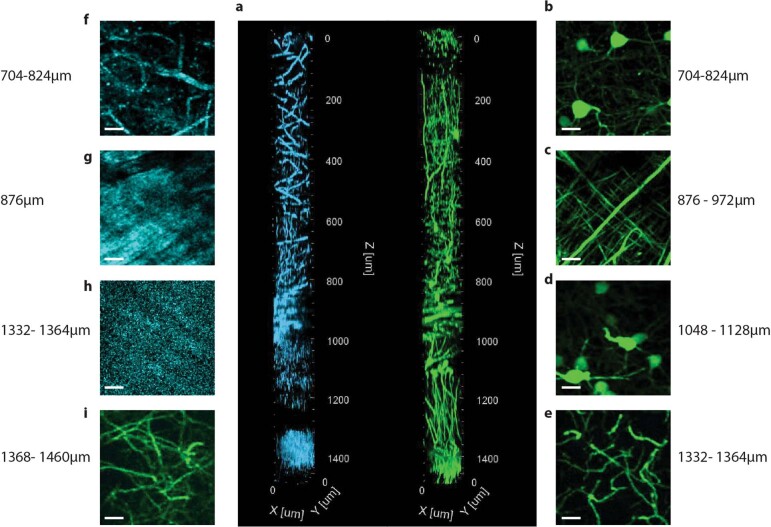
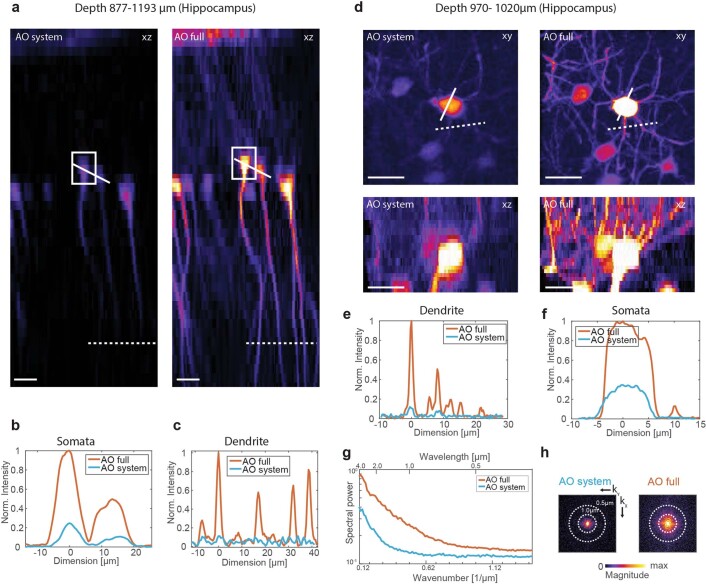
Multiphoton microscopy has become a powerful tool with which to visualize the morphology and function of neural cells and circuits in the intact mammalian brain. However, tissue scattering, optical aberrations and motion artifacts degrade the imaging performance at depth. Here we describe a minimally invasive intravital imaging methodology based on three-photon excitation, indirect adaptive optics (AO) and active electrocardiogram gating to advance deep-tissue imaging. Our modal-based, sensorless AO approach is robust to low signal-to-noise ratios as commonly encountered in deep scattering tissues such as the mouse brain, and permits AO correction over large axial fields of view. We demonstrate near-diffraction-limited imaging of deep cortical spines and (sub)cortical dendrites up to a depth of 1.4 mm (the edge of the mouse CA1 hippocampus). In addition, we show applications to deep-layer calcium imaging of astrocytes, including fibrous astrocytes that reside in the highly scattering corpus callosum.


Conflict of interest statement

The authors declare no competing interests.

Figures

Fig. 1
Fig. 1. Schematic principle of ECG-gated AO 3PM.
a, Illustration of the motion-corrected AO 3P microscope. Aberration correction is performed via a modal-based indirect wavefront sensing approach. Intravital motion artifacts are reduced with a real-time ECG-gated image acquisition scheme that synchronizes the Galvo scanners to the cardiac cycle of the mouse. b, 3PM at 1,300 nm excitation wavelength in EGFP–Thy1(M) mouse visual cortex and hippocampus. Left, 3D reconstruction of a 3P image stack of third-harmonic signal (cyan) and GFP-labeled neurons (green). Right, maximum intensity projection images at various depths in the cortex (Cx; top), corpus callosum (CC; middle) and CA1 region of the hippocampus (HPC; bottom). SBRs at different depths are displayed in the respective images. Scale bar, 20 μm. c, Comparison of intraframe motion artifacts for ECG-gated and nongated image acquisition at 701 μm depth. Standard deviation (s.d.) projection images of consecutively acquired frames with (top, right) and without (top, left) ECG gating. Arrows indicate high frame-to-frame variability resulting in artifacts without ECG gating. Yellow box shows overlay of two consecutively acquired frames (red and green). Bottom, pairwise two-dimensional cross-correlation between individual frames without (bottom, left) and with (bottom, right) ECG synchronization. Representative datasets obtained from n = 4 mice. Source data
Fig. 2
Fig. 2. AO enables high-resolution 3P deep brain imaging.
Indirect modal-based AO correction and ECG-gated 3PM at 1,300 nm excitation. a,c,e, Representative images showing dendrites and spines in (a) layer VI and (c,e) hippocampus of the in vivo mouse brain (EGFP–Thy1(M)) through a cranial window. Images were recorded with two different conditions: AO system (wavefront correction of system aberrations) and AO full (wavefront correction of system and brain tissue aberrations). Maximum intensity projection images with system and full aberration correction at layer VI in cortex (a) as well as hippocampus (c,e) (scale bar, 20 μm; on zoomed regions, 2 µm). White boxes in a indicate magnified views of spines. The white cross in a,c,e shows orthogonal view along dendrite. Respective wavefront maps for aberration correction are displayed in the top and bottom corners. Aberration measurement location for e was identical to c. b, Intensity profile along spines (right; white dotted line) and across dendrite (left; white cross), respectively, in cortical layer VI (a). Norm., normalized. d, Intensity profile along neuron somata (white dotted line in c) and across dendrite (white dotted line in e). f, Lateral resolution analysis of AO correction improvement. Spectral power map as a function of spatial frequency (wavenumber) at (left) layer VI of cortex (a) and (right) hippocampus (e). Middle, average radial profile of spectral power maps for maximum intensity images. g, Axial resolution analysis. Effective PSF of microscope inferred from beads in solution and compared to in vivo measurements performed on dendrites, with system and full AO at a depth of 653 μm (cortex), 822 μm (cortex), and 1,000 and 1,327 μm (hippocampus). For AO at 1,327 µm, the AO measurement was performed at 1,000 µm depth. The effective illumination NA was reduced at a greater depth to increase objective transmission. h, Spatial analysis of lateral (green) and axial (blue) intensity enhancement (AO on/AO off) with respect to distance from location of AO measurement in cortex (left) and hippocampus (right). Median values are shown as dots and top 75th and bottom 25th percentile as shadows. Dotted lines show exponential fits. The red box indicates the area where the intensity enhancement (AO on/AO off) <1. Same data as Extended Data Figs. 6 and 7 for Z35. i, Analysis of wavefront distortion (peak-to-valley (PV) and root-mean-square error (r.m.s.e.)) displayed on DM for aberration correction in cortex (C) and hippocampus (HPC) and pooled from Extended Data Fig. 8. Only datasets with <100 μm lateral off-set between cortex and hippocampus in the same animal were included in the analysis. Representative datasets obtained from several imaging sessions in n = 7 mice. Source data
Fig. 3
Fig. 3. 3P-AO enables structural and functional imaging of astrocytes in vivo.
a, Illustration of protoplasmic and fibrous astrocytes that reside in the gray and white matter, respectively. b, White matter astrocytic Ca2+-imaging. Left, median intensity time-series projection image (pseudocolored) of three fibrous astrocytes (A, B, C) in the corpus callosum (at a depth of 862 µm). Arrowheads show soma of astrocytes. Map of all active microdomains at baseline overlaid on median intensity projected image of astrocyte. Center, intensity versus time traces for five microdomains (corresponding to colors in left panel), showing characteristics of Ca2+ transients. Right, raster plots displaying duration and intensity of Ca2+ transients of all microdomains. c, Gray matter astrocytic Ca2+ imaging. Left, median intensity time-series projection image (pseudocolored) of two protoplasmic astrocytes in the layer 6 of the visual cortex (at a depth of 835 µm). Map of all active microdomains at baseline overlaid on median intensity projected image of astrocyte. Center, intensity versus time traces for five microdomains (corresponding to colors in the left panel), showing characteristics of Ca2+ transients. Right, raster plots displaying duration and intensity of Ca2+ transients of all microdomains. d, AO-enhanced astrocytic Ca2+-imaging. Left, median intensity time-series projection image (pseudocolored) of protoplasmic astrocyte in the cortex (at 784 µm deep). Map of active microdomains at baseline. Center, intensity versus time traces for five microdomains (corresponding to colors in left panel), showing characteristics of Ca2+ transients without AO (AO off) and full AO (AO on) correction. Right, raster plots displaying duration and intensity of Ca2+ transients without AO and full AO correction. e, Graph showing mean amplitude (Z score/SNR) for microdomain Ca2+ transients without AO and full AO correction; P value based on a nonparametric Kolmogorov–Smirnov unpaired two-sided t-test. Error bars denote s.e.m. Representative datasets shown from n = 3 mice, and n = 5 L5/6 protoplasmic cells (c), n = 4 fibrous cells (b) and n = 3 cells with AO (d). Scale bar in bd, 20 µm. Source data
Extended Data Fig. 1
Extended Data Fig. 1. Schematic experimental set-up.
Femto-second laser pulses at 1300 nm are generated by a NOPA system pumped by a fiber-based amplified laser. Laser pulse duration is maintained at the sample plane with a custom-build single-prism pulse compressor. The deformable mirror, X and Y galvo mirrors, and the wavefront sensor are conjugated to the objective pupil plane with 4-f relay lens pairs. Fluorescence signals are collected by large-aperture optics and detected by large-area PMTs. Physiological parameters of the mouse (ECG, breath rate, etc.) are processed in real-time by an FPGA which in turn gates the image acquisition of the microscope.
Extended Data Fig. 2
Extended Data Fig. 2. Power attenuation and estimated focal energies at depth with 1300 nm excitation of brain tissue including cortex, corpus callosum (white matter) and hippocampus.
a, THG signal attenuation vs depth in the mouse brain with fits displaying attenuation length (EAL) in the cortex (red, EAL = 275μm), white matter (yellow, EAL = 101μm) and hippocampus (purple, EAL = 250μm). The brightest 0.5% of pixels of each THG image slice were averaged. The cube root of the resulting average was scaled by the surface power, and the entire curve was normalized by the maximum. b, Estimated theoretical focal energy (2nJ straight line and 1nJ dotted line) for a given surface power P0 based on attenuation length determined in (a) (P(z) = P0*exp(-z/EAL). Experimental power values used for Extended Data Fig. 3 are plotted as blue dots. Heating threshold taken from Ref. . Source data
Extended Data Fig. 3
Extended Data Fig. 3. Three-photon adaptive optics microscopy at 1300 nm excitation of intact Thy1-GFP mouse brain down to the edge of the CA1 stratum lacunosum at ~1.45 mm depth.
a, 3D reconstruction of three-photon image stack of THG signal (cyan) and GFP-labelled neurons (green). Image stack was acquired with AO correction based on AO measurements at three different depths (system 0 µm, cortex 600 µm, hippocampus 1000 µm), and utilized AO system correction for 0-500μm depth, AO Z35 (cortex) for 500-900μm depth, and AO Z35 (hippocampus) for 900-1450um depth. Lateral FOV 126×126 μm. b-i, Maximum intensity projection images of GFP (green) and THS (cyan) at various depths. b,f, Layer V/VI cortex where pyramidal cell bodies are imaged. c,g, At ~876-972μm depth the fibres of the corpus callosum (white matter) are visible. d, The CA1 pyramidal cell somata are visualized at ~1048-1128μm depth in the stratum pyramidale. e,h,i, At depth >1332μm the edge of the CA1 stratum lacunosum moleculare is reached, and the THS signal indicates denser tissue which suggests reaching the edge of the outer molecular layer or envelope of the hippocampal sulcus (h). Depth values correspond to axial motor position. Taking the refractive index difference between the coverslip/immersion media and various brain tissue into account, the actual imaging depth is ~5-10% larger. Representative result of (n=3) experiments.
Extended Data Fig. 4
Extended Data Fig. 4. Image quality improvement for in-vivo imaging with aberration correction in Hippocampus.
Images were recorded in Thy1-EGFP(M) mice with two different conditions. AO system: wavefront correction of system aberrations; AO full: wavefront correction of system and brain tissue aberrations including Z35 modes (excluding piston, tip and tilt) for correction. Additionally, cardiac gated image acquisition was performed for both AO system and AO full condition. a, Maximum intensity projection images of orthogonal view (xz) for the two different conditions at 877-1193μm depth. AO measurement was performed on somata indicated by white box. After aberration correction and intensity enhancement was achieved over the entire FOV, illustrated by intensity line plots across somata (b) and dendrites (c) indicated in (a) by straight and dotted white line, respectively. d, Maximum intensity projection images (top) and orthogonal view (bottom) for system and full AO correction at 970-1020μm depth. (e) and (f) display lateral intensity plot along dendrites and somata, respectively, indicated in (d) by white dotted and white straight line, respectively. h, Spectral power map as a function of spatial frequency (wavenumber) and (g) average radial profile of spectral power maps for maximum intensity images in (d). Scale bar 20μm. Representative result of (n=3) and (n=8) experiments in (a-b), respectively. Source data
Extended Data Fig. 5
Extended Data Fig. 5. Characterization of initial SBR condition on AO measurement performance in-vivo at ~600μm in Thy1-GFP mouse at 1300 nm excitation.
a, Initial image quality of neuron somata used for AO measurement under three different SBR conditions calculated on raw images (Right). For calculation of the image quality metric the raw images were (Left) median filtered (7x7pixel kernel) and thresholded so that only the somata signal (indicated by white dotted circle) was used for analysis. b, Intensity ratio (AO on/AO off) versus iteration number for the three different initial SBR conditions. Source data
Extended Data Fig. 6
Extended Data Fig. 6. Spatial AO enhancement analysis for local aberration correction in-vivo in Thy1-GFP mouse cortex.
Aberration measurement was performed for four different conditions referred to: system aberration correction (AO system) and full aberration correction inside cortex including Zernike modes up to order 21, (Z21), 35 (Z35) and 60 (Z60), excluding piston, tip and tilt mode. The AO intensity enhancement (AO on/AO off) was then analysed with respect to the distance (lateral and axial) from the point of correction (somata where AO measurement was performed) to estimate the AO isoplanatic patch size (FOV over which the intensity enhancement (AO on/AO off > 1). In total 6 datasets were analysed (total 311 neurons, from 6 image trials in 3 mice). Corresponding aberrations and depth of AO measurements are displayed in Extended Data Fig. 8. a, Lateral (Top, xy) and orthogonal (Bottom, xz) view of maximum intensity projection image of example data-set at 383-683μm depth across 360×360μm lateral FOV acquired without (AO off) and full (AO on Z35) aberration correction. Scale bar 20μm. b, Instance segmentation of neuron somata in (a). c, Relative position of centroids of all segmented somata (311 neurons) pooled from 6 datasets with respect to point of correction (x=0, y=0, z=0). d, Spatial projection of somata (all 6 data-sets) with respect to lateral (Rxy) and axial (Rz) distance from point of correction (Rxy =0, Rz =0). Colour coding represents Intensity enhancement (AO on/ AO off) where red colour is >1, and green <1. e, Lateral and axial data from (c) grouped into distance increments of 50 µm. For lateral analysis only somata with Rz < 50 µm and accordingly for the axial analysis only somata with Rxy< 50 µm where analyzed. Boxplot shows median value as red line. Boundaries of box represent upper 75th and lower 25th percentile, whiskers correspond to +/–2.7σ and 99.3 percent coverage. The region where intensity enhancement (AO on/AO off) is <1 is indicated by red box. Analysis shows that the isoplanatic patch (AO on/AO off > 1) is larger in the axial compared to the lateral dimension. Summary plot for Z35 is included in Fig. 2h. Source data
Extended Data Fig. 7
Extended Data Fig. 7. Spatial AO enhancement analysis for local aberration correction in-vivo in Thy1-GFP mouse hippocampus.
Aberration measurement was performed for four different conditions referred to: system aberration correction (‘AO system’) and full AO aberration correction inside cortex including Zernike modes up to order 21, (Z21), 35 (Z35) and 60 (Z60), excluding piston, tip and tilt mode. The AO intensity enhancement (AO on/AO off) was then analysed with respect to the distance (lateral and axial) from the point of correction (somata where AO measurement was performed) to estimate the AO isoplanatic patch size (FOV over which the intensity enhancement (AO on/AO off > 1). In total 6 datasets were analysed (total 396 neurons, from 6 image trials in 3 mice). Corresponding aberrations and depth of AO measurements are displayed in Extended Data Fig. 8. a, Lateral (Top, xy) and orthogonal (Bottom, xz) view of maximum intensity projection image of example dataset at 1086-1206μm depth across 360×360μm lateral FOV acquired without (AO off) and full (AO on Z35) aberration correction. Scale bar 20μm. b, Instance segmentation of neuron somata in (a). c, Relative position of centroids of all segmented somata (396 neurons) pooled from 6 datasets with respect to point of correction (x=0, y=0, z=0). d, Spatial projection of somata (all 6 datasets) with respect to lateral (Rxy) and axial (Rz) distance from point of correction (Rxy =0, Rz =0). Colour coding represents intensity enhancement (AO on/ AO off) where red colour is >1, and green <1. e, Lateral and axial data from (c) grouped into distance increments of 50 µm. For lateral analysis only somata with Rz < 50 µm and accordingly for the axial analysis only somata with Rxy< 50 µm where analyzed. Boxplot shows median value as red line. Boundaries of box represent upper 75th and lower 25th percentile, whiskers correspond to +/–2.7σ and 99.3 percent coverage. The region where intensity enhancement (AO on/AO off) is <1 is indicated by red box. Analysis shows that the isoplanatic patch (AO on/AO off > 1) is larger in the axial compared to the lateral dimension. Summary plot for Z35 is included in Fig. 2h. Source data
Extended Data Fig. 8
Extended Data Fig. 8. Zernike polynomials used for aberration correction at various depth in cortex and hippocampus.
a, All modulated Zernike modes 4-61. b, Zernike modes grouped by aberrations class: spherical, coma, astigmatism and trefoil. Same data set as Extended Data Figs. 6&7. Source data
Extended Data Fig. 9
Extended Data Fig. 9. Bleaching levels for different excitation powers and estimated focal energies of imaging conditions utilized in-vivo using Thy1-GFP mouse at 630 μm depth.
a, Fluorescence signal level versus number of imaged frames for different surface power levels. The corresponding estimated focal energies were estimated based on attenuation length (EAL = 275μm, Extended Data Fig. 2). b, Images acquired with (Left) 3.55 mW and (Right) 2.1 mW surface power, as utilized during typical high-resolution imaging and AO measurements, respectively, corresponding to yellow and blue bleaching curves in (a). From (a) both imaging conditions show negligible bleaching effects and are below <1nJ pulse energy, thus well within the previously established safe pulse energy regime. Scale bar 20μm. Representative result of (n=3) experiments. Source data

References

    1. Helmchen F, Denk W. Deep tissue two-photon microscopy. Nat. Methods. 2005;2:932–940. doi: 10.1038/nmeth818. - DOI - PubMed
    1. Ji N, Freeman J, Smith SL. Technologies for imaging neural activity in large volumes. Nat. Neurosci. 2016;19:1154–1164. doi: 10.1038/nn.4358. - DOI - PMC - PubMed
    1. Theer P, Denk W. On the fundamental imaging-depth limit in two-photon microscopy. J. Opt. Soc. Am. A. 2006;23:3139–3149. doi: 10.1364/JOSAA.23.003139. - DOI - PubMed
    1. Horton NG, et al. In vivo three-photon microscopy of subcortical structures within an intact mouse brain. Nat. Photonics. 2013;7:205–209. doi: 10.1038/nphoton.2012.336. - DOI - PMC - PubMed
    1. Ouzounov DG, et al. In vivo three-photon imaging of activity of GCaMP6-labeled neurons deep in intact mouse brain. Nat. Methods. 2017;14:388–390. doi: 10.1038/nmeth.4183. - DOI - PMC - PubMed

Publication types

Substances