Clinical Trial
. 2021 Nov;27(11):2002-2011.
doi: 10.1038/s41591-021-01542-z. Epub 2021 Sep 30.

Immune responses to two and three doses of the BNT162b2 mRNA vaccine in adults with solid tumors

Affiliations
Clinical Trial

Immune responses to two and three doses of the BNT162b2 mRNA vaccine in adults with solid tumors

Rachna T Shroff et al. Nat Med. 2021 Nov.

Abstract

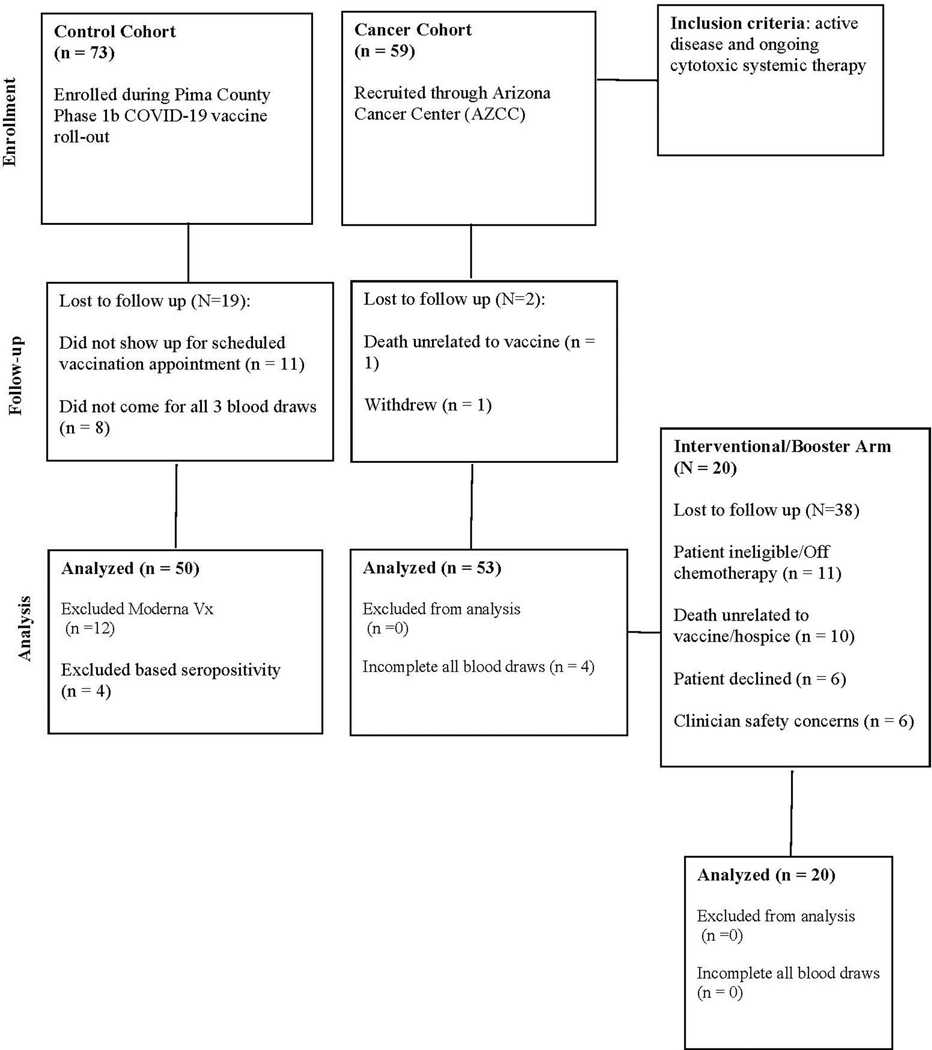
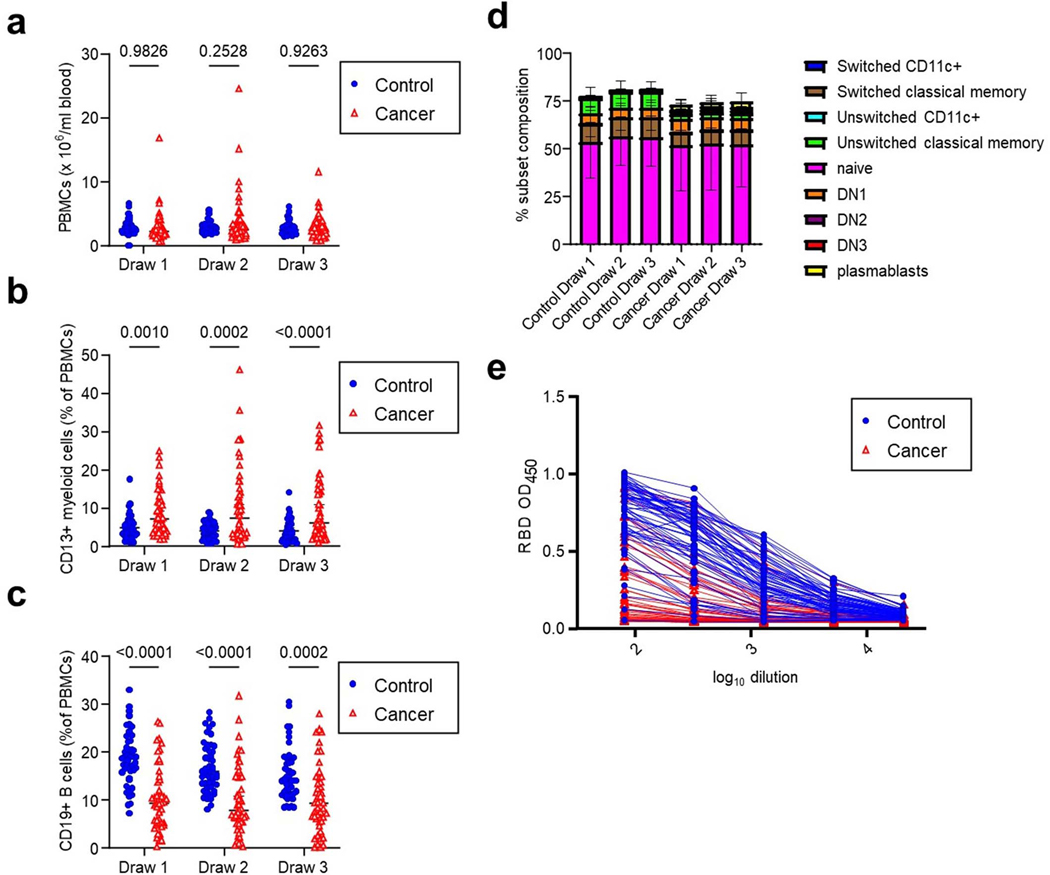
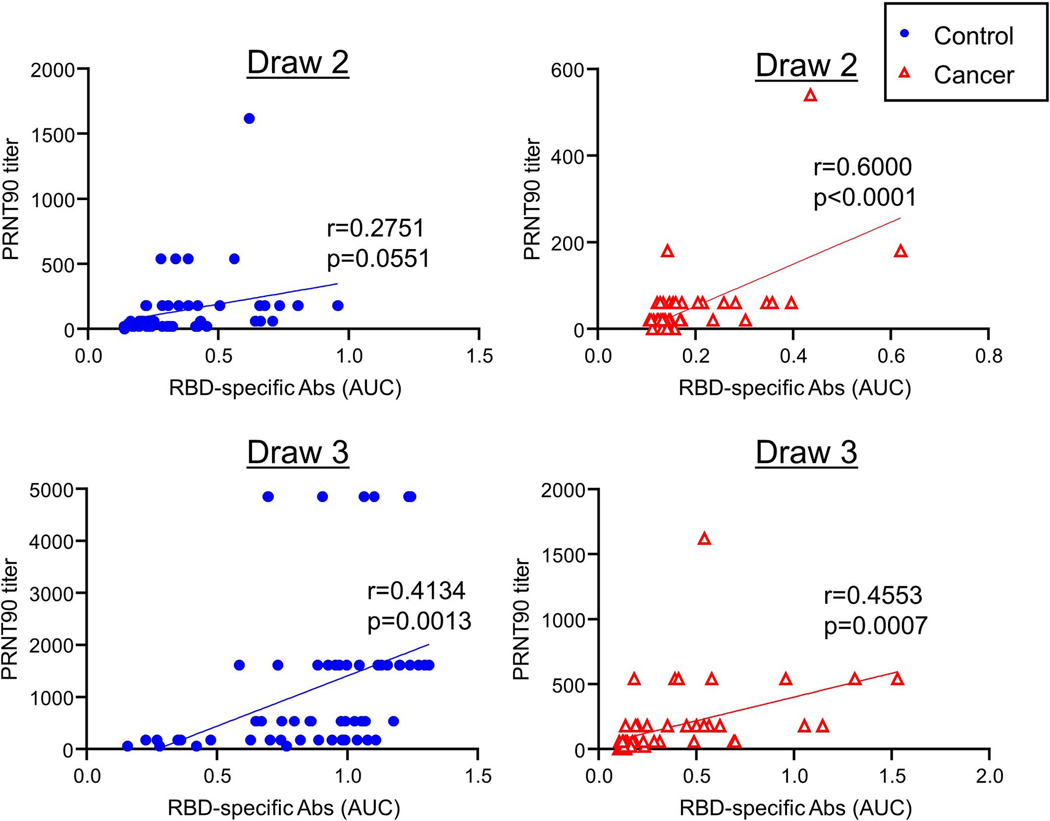
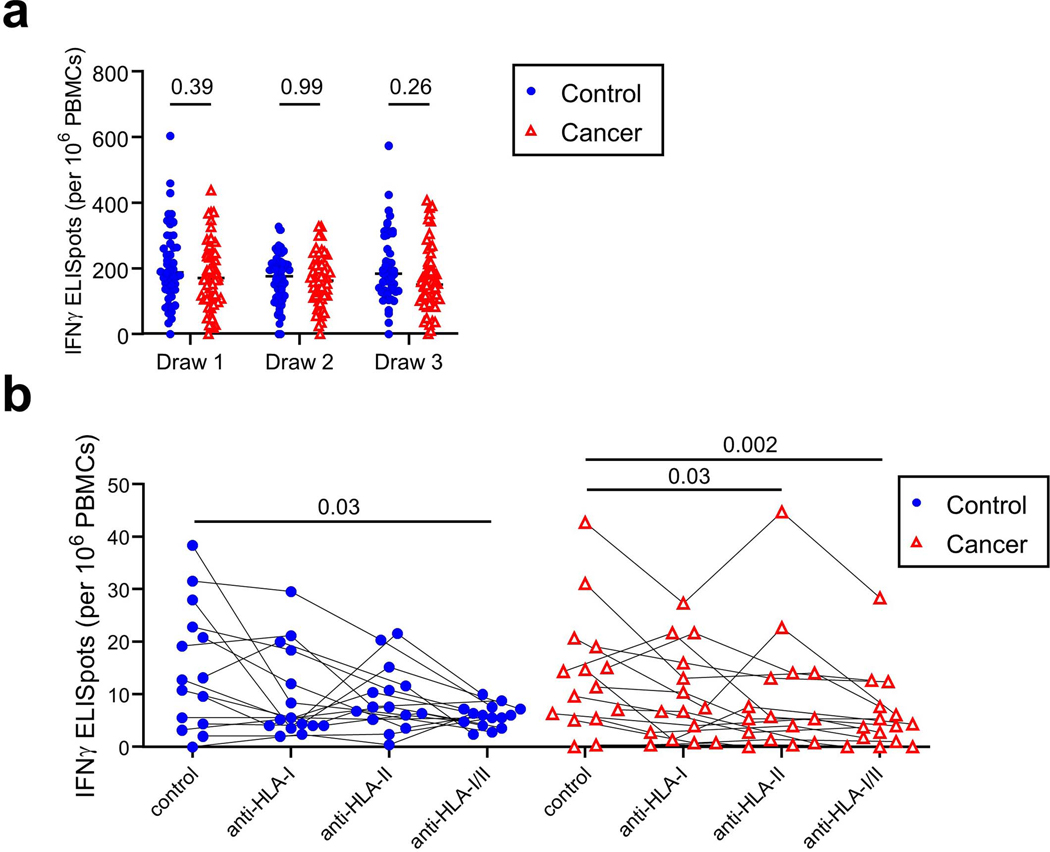
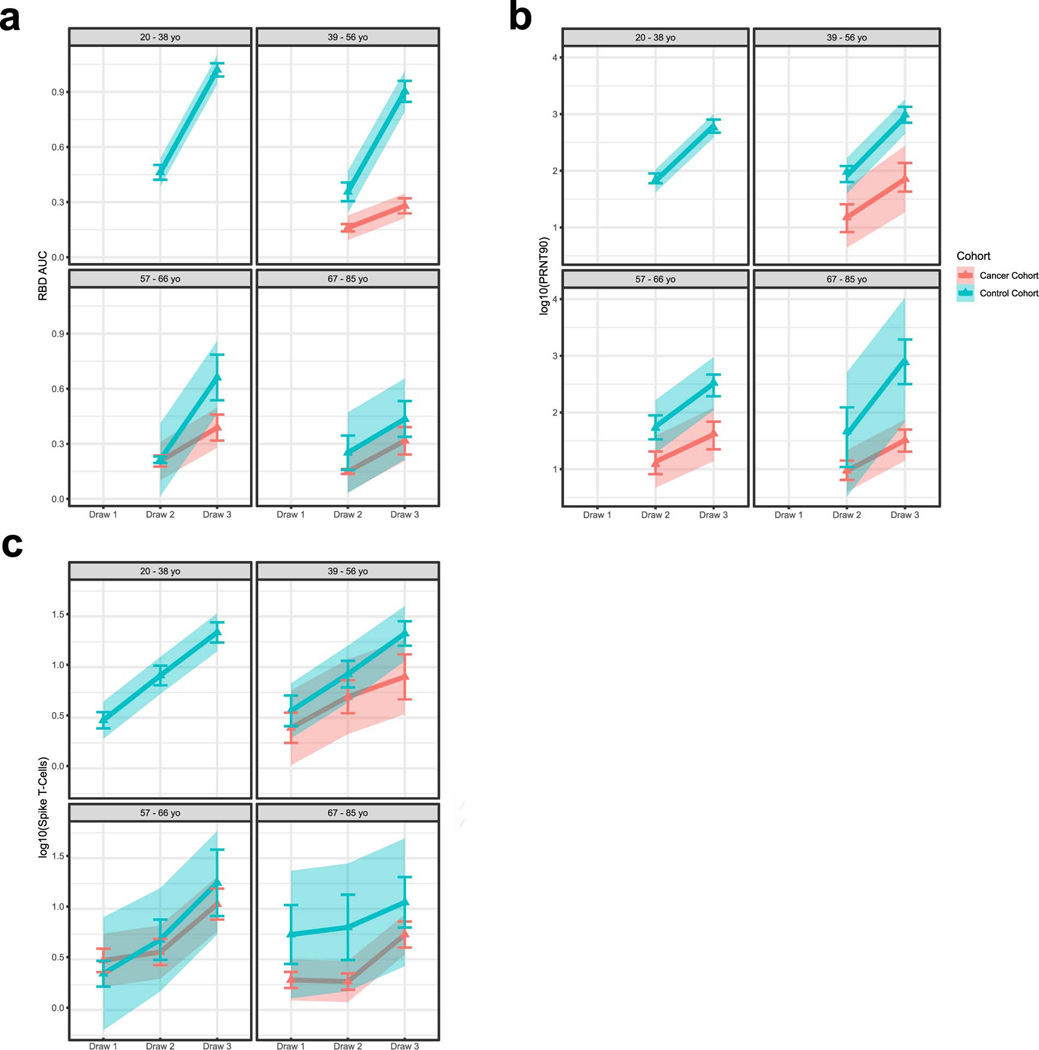
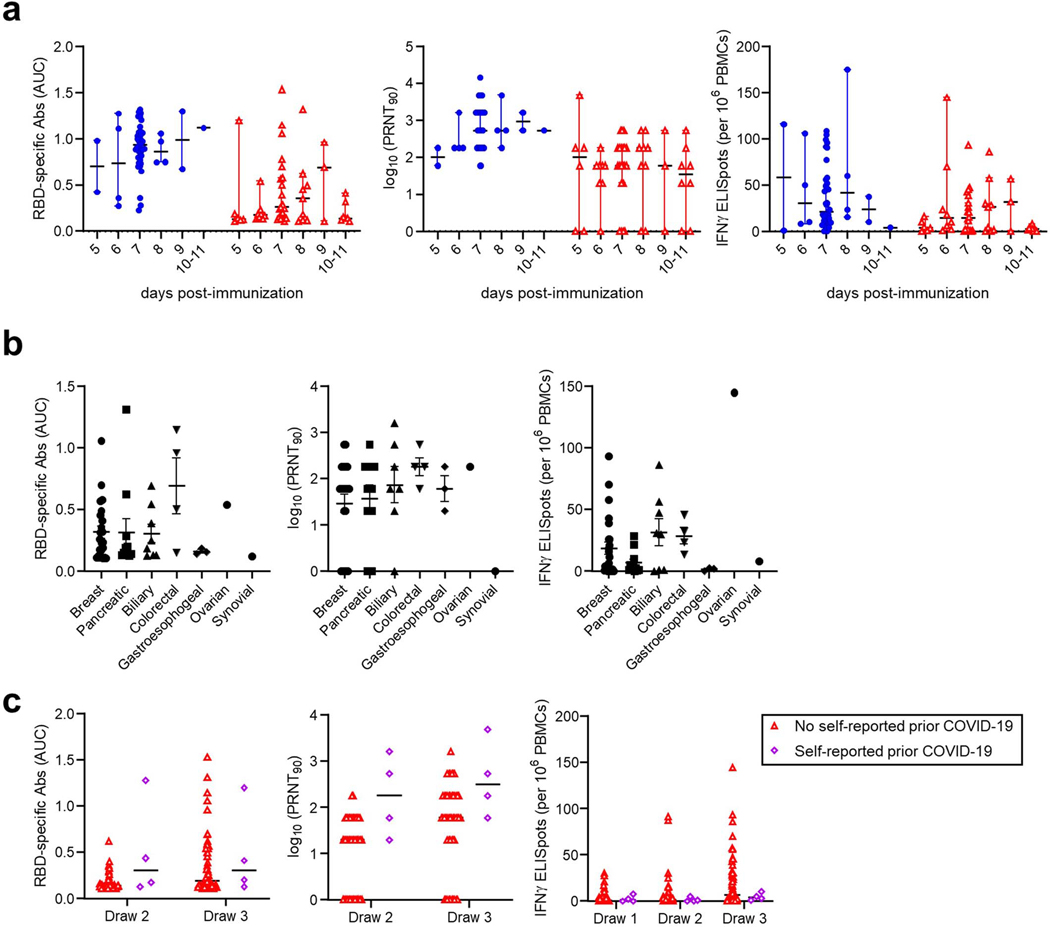
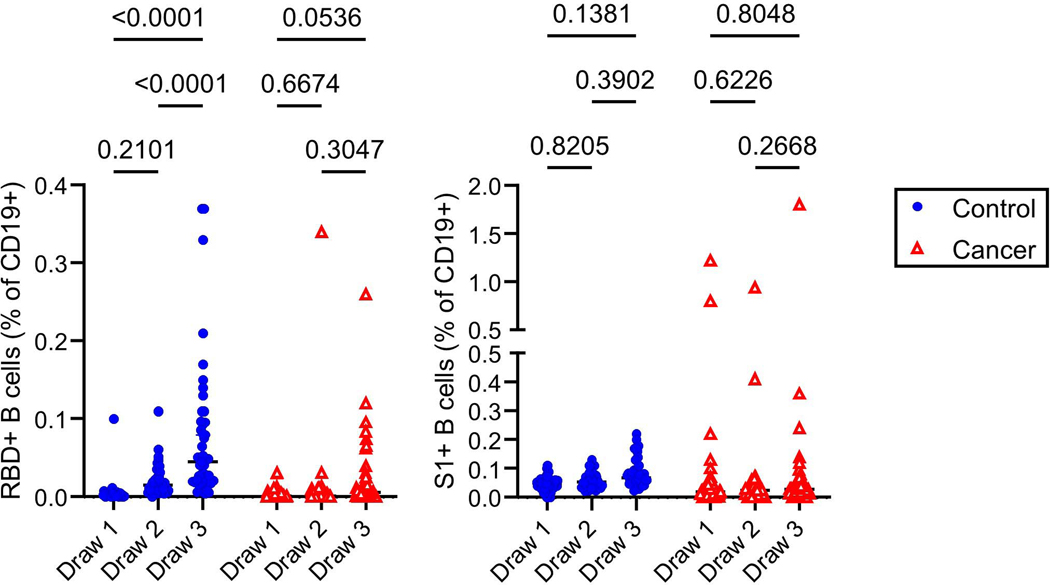
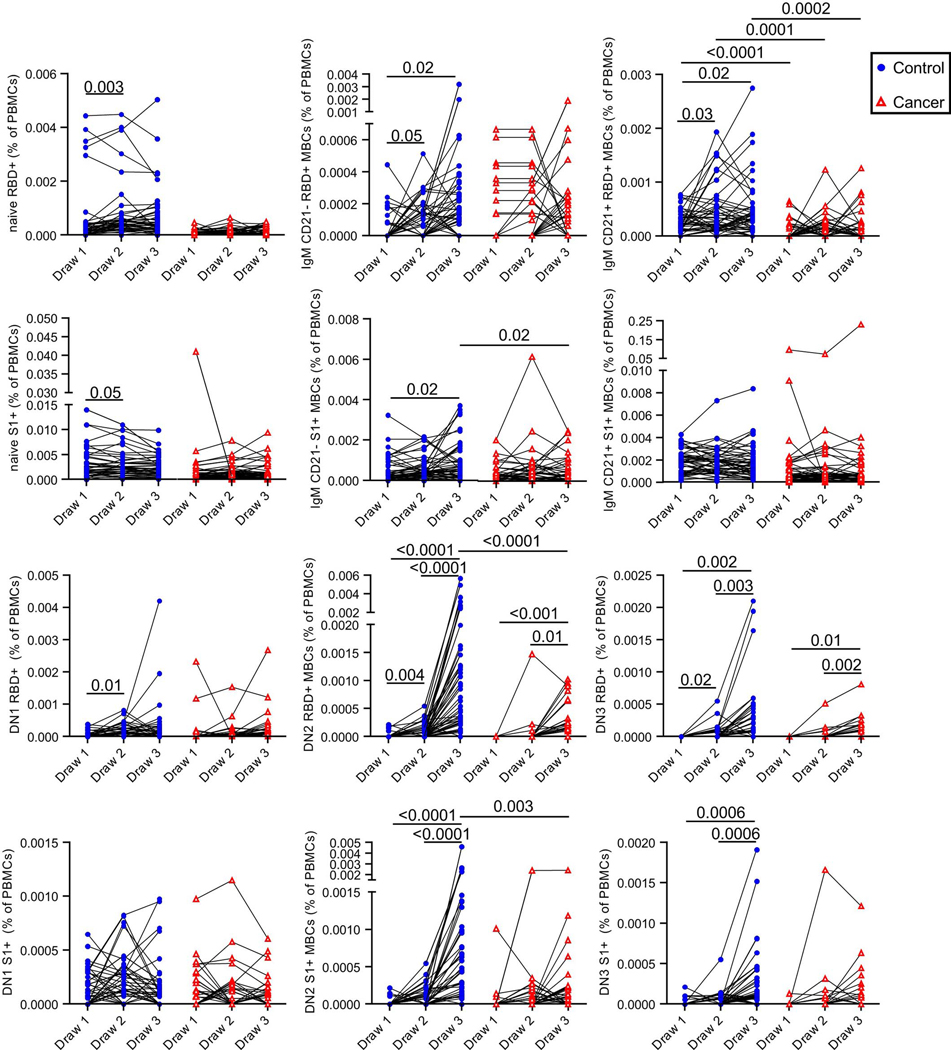
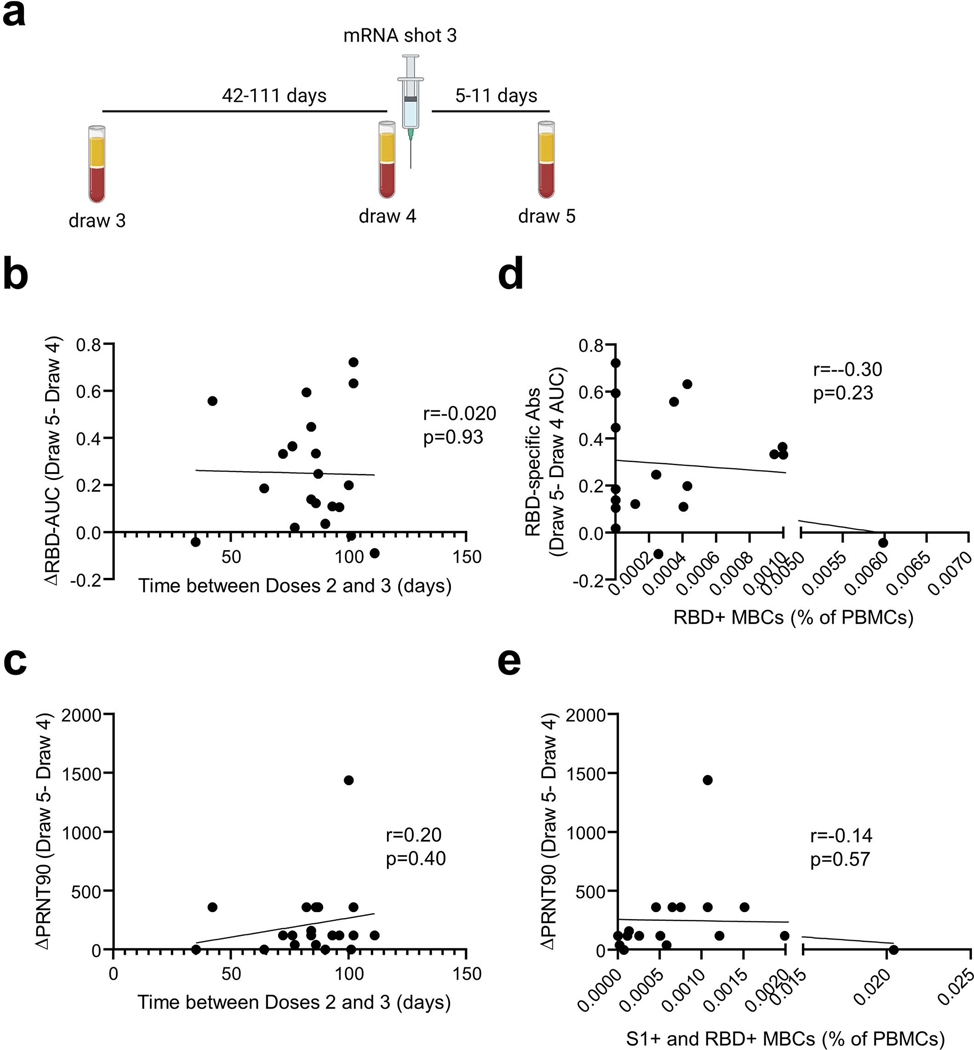
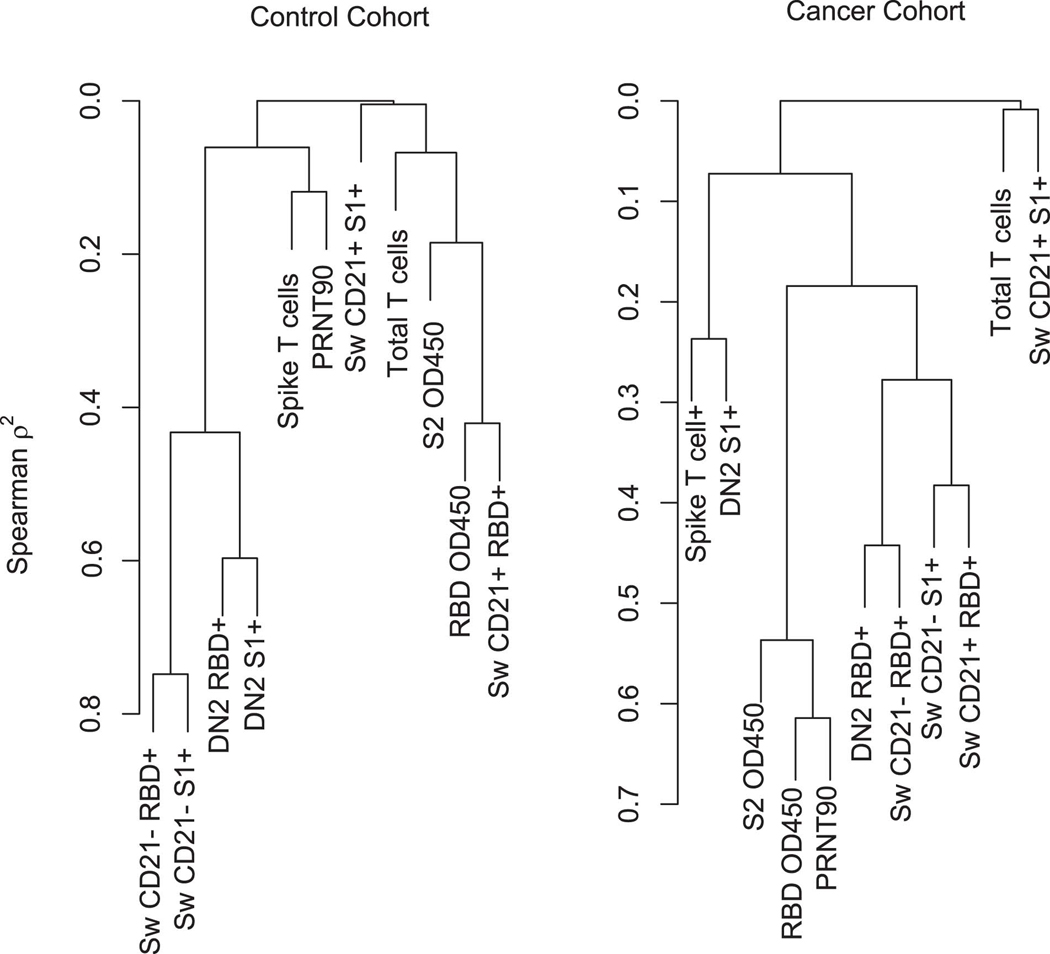
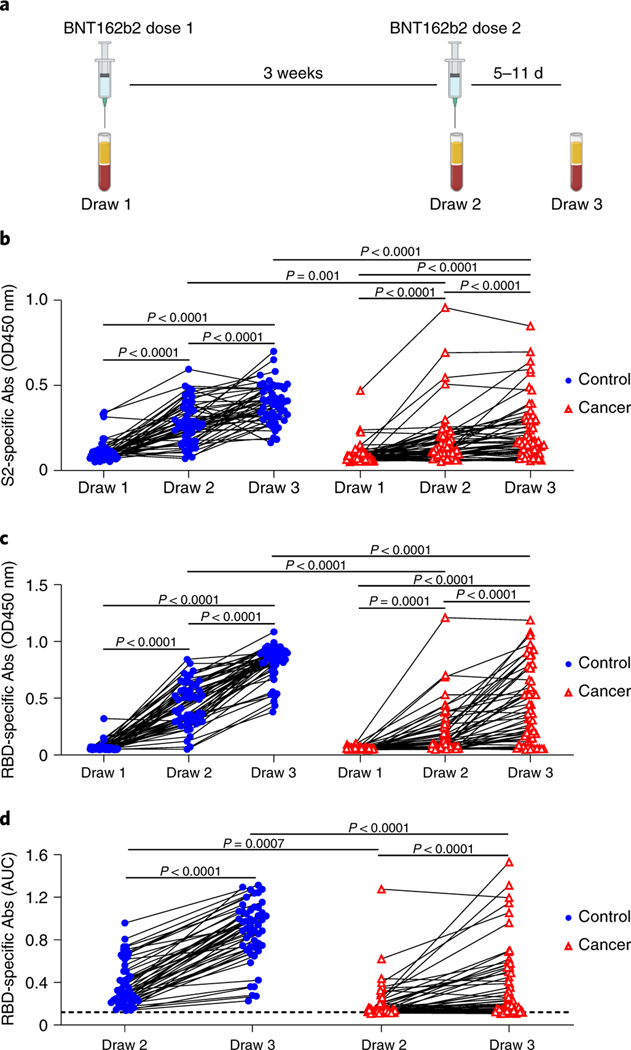
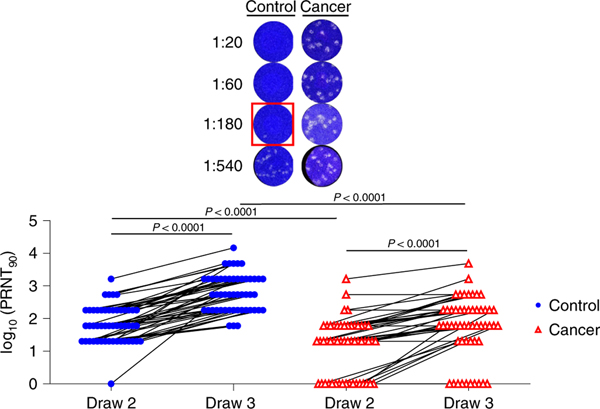
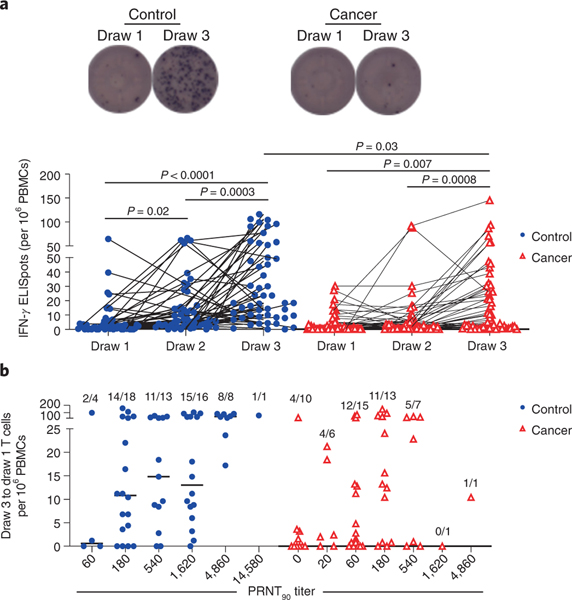
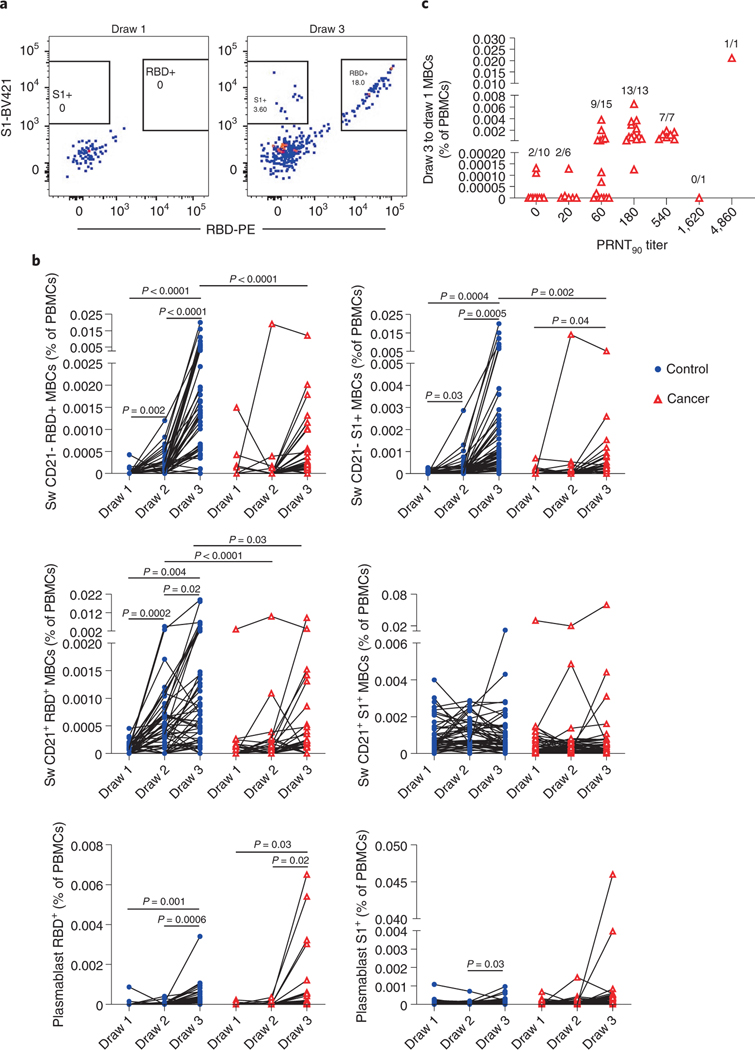
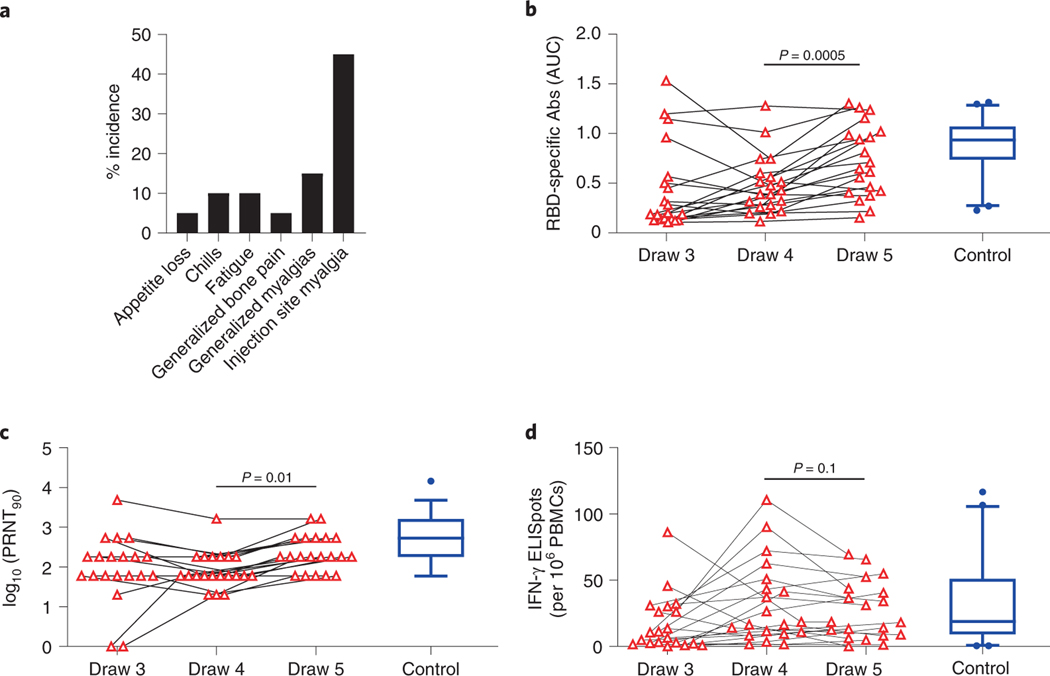
Vaccines against severe acute respiratory syndrome coronavirus 2 (SARS-CoV-2) have shown high efficacy, but immunocompromised participants were excluded from controlled clinical trials. In this study, we compared immune responses to the BNT162b2 mRNA Coronavirus Disease 2019 vaccine in patients with solid tumors (n = 53) who were on active cytotoxic anti-cancer therapy to a control cohort of participants without cancer (n = 50). Neutralizing antibodies were detected in 67% of patients with cancer after the first immunization, followed by a threefold increase in median titers after the second dose. Similar patterns were observed for spike protein-specific serum antibodies and T cells, but the magnitude of each of these responses was diminished relative to the control cohort. In most patients with cancer, we detected spike receptor-binding domain and other S1-specific memory B cell subsets as potential predictors of anamnestic responses to additional immunizations. We therefore initiated a phase 1 trial for 20 cancer cohort participants of a third vaccine dose of BNT162b2 ( NCT04936997 ); primary outcomes were immune responses, with a secondary outcome of safety. At 1 week after a third immunization, 16 participants demonstrated a median threefold increase in neutralizing antibody responses, but no improvement was observed in T cell responses. Adverse events were mild. These results suggest that a third dose of BNT162b2 is safe, improves humoral immunity against SARS-CoV-2 and could be immunologically beneficial for patients with cancer on active chemotherapy.


Conflict of interest statement

Competing interests:

The remaining authors declare no competing interests and no authors are employees of relevant companies.

Figures

Extended Data Fig. 1
Extended Data Fig. 1. Consort Diagram.
Observational and Interventional (Booster) Studies.
Extended Data Fig. 2
Extended Data Fig. 2. Cellular and serological characterization of blood samples from control and cancer cohorts.
a, PBMC frequencies of blood samples at each timepoint. Two-sided p-values from t-test statistics were calculated for pairwise differences using 2-way ANOVA. Post-hoc testing for multiple comparisons between draws was performed using Sidak’s correction. Comparisons were made between cohorts matched for draw number. All data points represent biological replicates (n=50 for control cohort; n=53 for cancer cohort). b, CD19+ B cell frequencies of blood samples at each timepoint. Two-sided p-values from t-test statistics were calculated for pairwise differences using 2-way ANOVA. Post-hoc testing for multiple comparisons between draws was performed using Sidak’s correction. Comparisons were made between cohorts matched for draw number. All data points represent biological replicates (n=50 for control cohort; n=53 for cancer cohort). c, CD13+ myeloid cell frequencies of blood samples at each blood draw. Two-sided p-values from t-test statistics were calculated for pairwise differences using 2-way ANOVA. Post-hoc testing for multiple comparisons between draws was performed using Sidak’s correction. Comparisons were made between cohorts matched for draw number. All data points represent biological replicates (n=50 for control cohort; n=53 for cancer cohort). d, B cell subset frequencies at each draw, descriptive statistics include mean ± SEM for n = 50 control and n = 53 cancer cohort participants for each subtype. e, Raw ELISA data for quantification of RBD titers shown in Figure 1d. A serum concentration beginning at 1:80 was serially diluted and area under the curve (AUC) values calculated. Lines connect the same individual at each dilution. Data from the third blood draw are shown for both the control and cancer cohort. Each individual curve represents a biological replicate (n=50 for control cohort; n=53 for cancer cohort).
Extended Data Fig. 3
Extended Data Fig. 3. Correlation between RBD-binding antibodies and virus-neutralization.
RBD titers were plotted against PRNT levels for control and cancer cohorts at draws 2 and 3. Pearson correlation analyses were performed. All data points represent biological replicates (n=50 for control cohort; n=53 for cancer cohort).
Extended Data Fig. 4
Extended Data Fig. 4. T cell activation in control and cancer cohorts.
a, PBMCs were cultured for 24 h in the presence of an activating anti-CD3 antibody. IFN𝛾-producing cells were quantified by ELISPOT. Two-sided p-values from t-test statistics were calculated for pairwise differences using 2-way ANOVA. Post-hoc testing for multiple comparisons between draws was performed using Sidak’s correction. Comparisons were made between cohorts matched for draw number. All data points represent biological replicates (n=50 for control cohort; n=53 for cancer cohort). b, Spike-specific T cell activation was quantified in the presence or absence of anti-HLA-I and/or anti-HLA-II blocking antibodies. Two-sided p-values from t-test statistics were calculated using 1-way ANOVA. Post-hoc testing for multiple comparisons was performed using Tukey’s correction. P-values >0.05 are not depicted. All data points represent biological replicates (n=15 for control cohort; n=16 for cancer cohort).
Extended Data Fig. 5
Extended Data Fig. 5. Age-moderated analysis of immunological parameters.
a, Trajectory between two draws for RBD AUC for each cohort stratified by age quartile. b, Trajectory between two draws for log10(PRNT90) for each cohort stratified by age quartile. c, Trajectory between three draws for Spike-specific T cell frequencies for each cohort stratified by age quartile. RBD AUC and cohort differences were moderated by age (p-value = 0.01). This effect was driven by the effect of age on the control cohort, increasing age was associated with lower RBD AUC, while the cancer cohort levels were similar across the three upper age quartiles. The difference between the cancer cohort and control cohort was different at draw 3 for all age quartiles 2 – 4. Plots show the means and SEM for each draw along with the prediction intervals based on smoothing splines for each cohort There was no statistically significant difference in the relationship between log10(PRNT90) or Spike-specific T-cell frequencies by age. There was a degree of variability in Spike-specific T-cell frequency measurements in both cohorts though the trend in lower draw 3 measures in the cancer cohort remained consistent. The sample size for each age quartile was n = 0, 12, 20, 20 for the cancer cohort and n = 26, 14, 5, 5 for the control cohort.
Extended Data Fig. 6
Extended Data Fig. 6. Immune responses grouped by time post-vaccination or tumor type.
a, RBD-specific antibodies, neutralizing titers, and Spike-specific T cells were plotted as a function of time after the second vaccination. Mean values + SEM are shown. Two-sided p-values from t-test statistics were calculated within each cohort using 1-way ANOVA with post-hoc Tukey’s multiple comparisons test. No significant differences were observed. All data points represent biological replicates (n=50 for control cohort; n=53 for cancer cohort). b, RBD-specific antibodies, neutralizing titers, and Spike-specific T cells were plotted as a function of tumor type. Mean values + SEM are shown. Two-sided p-values from t-test statistics were calculated using 1-way ANOVA with post-hoc Tukey’s multiple comparisons test. No significant differences were observed. All data points represent biological replicates. c, RBD-specific antibodies, neutralizing titers, and Spike-specific T cells were plotted comparing participants who either did or did not self-report prior COVID-19. Mean values are shown. All data points represent biological replicates (breast: n=23; pancreatic cancer: n=11; biliary: n=8; colorectal: n=4; gastroesophogeal: n=3; ovarian: n=1; synovial: n=1).
Extended Data Fig. 7
Extended Data Fig. 7. Quantification of RBD- and S1-specific B cells after vaccination.
RBD- and S1-specific CD19+ B cell frequencies were measured using gating strategies shown in Extended Data Figure 1 and Figure 4a. Cells that bind both RBD and S1 are annotated as RBD+, whereas cells that are specific only for S1 are denoted as S1+. Two-sided p-values from t-test statistics were calculated for pairwise differences using 2-way ANOVA. Post-hoc testing for multiple comparisons between draws was performed using Sidak’s correction. Comparisons were made within cohorts. All data points represent biological replicates (n=50 for control cohort; n=53 for cancer cohort).
Extended Data Fig. 8
Extended Data Fig. 8. Quantification of memory B cell subsets after vaccination.
Cells that bind both RBD and S1 are annotated as RBD+, whereas cells that are specific only for S1 are denoted as S1+. Lines connect the same individual across blood draws, analyses were done on the arcsin of the square-root transformation, to standardize the small percentages. There is a statistically significant difference in slopes between cancer and control cohorts for DN2 RBD+ and S1+ (p < 0.0001 and < 0.0001, respectively) and the average rate of change is increasing in the control cohort for both DN2 RBD+ and S1+; with less dramatic slope increases with DN2 RBD+ and a flat trajectory for DN2 S2+ in the cancer cohort over time. Two-sided p-values from t-test statistics were calculated for pairwise differences using 2-way ANOVA. Post-hoc testing for multiple comparisons between draws was performed using Sidak’s correction. Comparisons were made within cohorts or between cohorts by draw, p-values >0.05 are not depicted. All data points represent biological replicates (n=50 for control cohort; n=53 for cancer cohort).
Extended Data Fig. 9
Extended Data Fig. 9. Correlation between memory B cells and anamnestic antibody responses.
a, RBD-specific memory B cell frequencies at Draw 3 (calculated as in Figure 4) were plotted against the difference in RBD antibody titers between Draws 4 and 5. Pearson’s correlation analysis was performed. All data points represent biological replicates (n=20). b, RBD- and S1-specific memory B cell frequencies at Draw 3 (calculated as in Figure 4) were plotted against the difference in PRNT-90 titers between Draws 4 and 5. Pearson’s correlation analysis was performed. All data points represent biological replicates (n=20).
Extended Data Fig. 10
Extended Data Fig. 10. Hierarchical clustering of immunological parameters.
Hierarchical clustering at the variable level, using Spearman’s rank order statistic was performed to evaluate both the correlation (similarity) of immune biomarkers after they are grouped into similar clusters. Of note is the different pattern of both clustering and similarity of the clustered variables between the control and cancer cohorts. Specifically, in the control cohort the B-cell data group into two clusters (including both switched CD21+ and DN2) with a high degree of correlation (spearman correlation of 0.80) a pattern that was not seen in the cancer cohort, within which the only obvious cluster was that of the neutralizing titers, RBD and S2 OD -- with a correlation of 0.6.
Figure 1:
Figure 1:. Antibody responses of cancer and control cohorts to mRNA vaccination.
a, Schematic of blood collection (draws) after vaccination. b, Semi-quantitative 1:40 serum dilution ELISA results for reactivity to the S2 region of SARS-CoV-2 Spike protein. Lines connect the same individual across timepoints. Repeated measures ANOVA examines the differences in slopes between cohorts, independently from the mean differences that were demonstrated at draw 3 between cohorts. There is a statistically significant difference in slopes between cancer and control cohorts (p < 0.0001) and the average rate of change is increasing at a steeper rate in the control cohort. These paired rates between draws by cohort are statistically different in the control compared to the cancer cohort for both draws 1 and 2, though it is not different between draws 2–3 (p-values < 0.0001 and 0.2945, respectively). c, Semi-quantitative 1:40 serum dilution ELISA results for reactivity to the receptor binding domain (RBD) of SARS-CoV-2 spike protein. Lines connect the same individual at each draw. There is a statistically significant difference in slopes between cancer and control cohorts (p<0.0001) and the average rate of change is steeper in the control cohort. These paired rates between draws are statistically different in the control compared to the cancer cohort for both draw 1–2 and draw 2–3 (p-values<0.0001 and 0.0043, respectively). d, Quantitative titers of RBD antibodies in control and cancer cohorts. A serum concentration beginning at 1:80 was serially diluted 1:4 and area under the curve (AUC) values calculated. Lines connect the same individual across timepoints. There is a statistically significant difference between draws 2 and 3 between cancer and control cohorts (p< 0.0001) and the average rate of change is at a steeper increase in the control cohort. For b-d, two-sided p-values from t-test statistics were calculated for pairwise differences using 2-way ANOVA. Post-hoc testing for multiple comparisons between draws was performed using Sidak’s correction. Comparisons were made either within cohorts or between cohorts at each draw, p-values >0.05 are not depicted. All data points represent biological replicates (n=50 for control cohort; n=53 for cancer cohort).
Figure 2:
Figure 2:. Neutralizing antibody responses of cancer and control cohorts to mRNA vaccination.
Virus neutralization assays were performed using the WA1 isolate of SARS-CoV-2. Serial 1:3 dilutions of serum were performed and tested for the ability to prevent plaques on Vero cells. The lowest concentration capable of preventing >90% of plaques was considered to be the PRNT90 value. Example images are shown for the control and cancer cohorts with the red box indicating the PRNT90 titer. Quantification is shown below. Lines connect the same individual across timepoints. There is a statistically significant difference between draw 2 and draw 3 between cancer and control cohorts (p < 0.0001) and the average rate of change is increasing at a steeper rate in the control cohort (p = 0.0002). Two-sided p-values from t-test statistics were calculated for pairwise differences using 2-way ANOVA. Post-hoc testing for multiple comparisons between draws was performed using Sidak’s correction. Comparisons were made either within cohorts or between cohorts at each draw, p-values >0.05 are not depicted. All data points represent biological replicates (n=50 for control cohort; n=53 for cancer cohort).
Figure 3:
Figure 3:. Spike-specific T cell responses of cancer and control cohorts to mRNA vaccination.
a, PBMCs were cultured for 24 h in the presence or absence of a pool of overlapping Spike protein peptides. IFN𝛾-producing cells were quantified by ELISPOT. Example images are shown for the control and cancer cohorts at timepoints 1 and 3. Quantification is shown below of the no peptide background-subtracted data. Lines connect the same individual across timepoints. There is a statistically significant difference in slopes between cancer and control cohorts (p = 0.0284) and the average rate of change is increasing steeper in the control cohort. While the overall rate of change was significant (draw 1 to draw 3, p = 0.0455), the rates of change between draw 1 to draw 2 and draw 2 to draw 3 were not statistically significant (p-values = 0.0642 and 0.9891, respectively). The inability to detect a statistical difference, particularly between draw 1 and draw 2, is likely due to sample size and variability as the cancer cohort difference is flatter than the cancer cohort between these two draws; these analyses were performed on a log-transformed scale. Two-sided p-values from t-test statistics were calculated for pairwise differences using 2-way ANOVA. Post-hoc testing for multiple comparisons between draws was performed using Sidak’s correction. Comparisons were made either within cohorts or between cohorts at each draw, p-values >0.05 are not depicted. All data points represent biological replicates (n=50 for control cohort; n=53 for cancer cohort). b, Draw 1 Spike-specific T cell frequencies were subtracted from draw 3 frequencies as calculated in a and plotted as a function of PRNT90 titers. Frequencies of individuals with detectable Spike-specific T cells are shown above each group. All data points represent biological replicates (n=53).
Figure 4:
Figure 4:. Memory B cell responses of cancer and control cohorts to mRNA vaccination.
a, Example gating strategy of RBD- and S1-specific CD21- isotype-switched memory B cells (full gating strategy is shown in Supplementary Figure). b, Quantification of memory B cell and plasmablast subsets after vaccination. Isotype-switched (Sw) memory B cells expressing or lacking CD21 are shown in plots along with plasmablasts. Cells that bind both RBD and S1 are annotated as RBD+, whereas cells that are specific only for S1 are denoted as S1+. Lines connect the same individual across blood draws, analyses were done on the arcsin of the square-root transformation, to standardize the small percentages. There is a statistically significant difference in slopes between cancer and control cohorts for CD21- RBD+ and S1+ (p < 0.0001 and < 0.0001, respectively) and the average rate of change is increasing in the control cohort for both CD21- RBD+ and S1+ but the slope increases more dramatically between draw 2 and 3 in the control cohort compared to the cancer cohort with a modest linearly increasing slope. The average rate of change was statistically significantly different for CD21+ RBD+ (p < 0.0001), with an linearly increasing slope in the control cohort that is much steeper than the cancer cohort. There was no statistically significant difference in slopes between cancer and control cohorts for CD21+ S1+ (p=0.1959). Two-sided p-values from t-test statistics were calculated for pairwise differences using 2-way ANOVA. Post-hoc testing for multiple comparisons between draws was performed using Sidak’s correction. Comparisons were made either within cohorts or between cohorts by draw, p-values >0.05 are not depicted. All data points represent biological replicates (n=50 for control cohort; n=53 for cancer cohort). c, RBD-specific DN2, DN3, and S1- and RBD-specific isotype-switched CD21- memory B cells were added for the cancer cohort. Summed draw 1 memory B cell frequencies were subtracted from the summation of draw 3 frequencies for each individual. These values were grouped by PRNT90 titers. Frequencies of individuals with detectable memory B cells are shown above each group. All data points represent biological replicates (n=53).
Figure 5:
Figure 5:. Antibody responses improve after a third immunization.
a, Frequencies of adverse events after third vaccine dose. b, RBD-specific antibody titers were quantified at the time of the 3rd immunization (draw 4) and 1 week afterwards (draw 5). Data from draw 3 are the same as those in Figure 1d and are shown again for context. Blue boxplot shows median and boundaries between the 1st and 3rd quartiles for the control cohort at draw 3; whiskers depict 5th-95th percentiles. All data points represent biological replicates (n=20). P-values are based on two-sided paired t-tests from the interventional (n = 20) cancer cohort based on draw 4 versus draw 5 comparisons; draw 3 cancer cohort (n=53) and control cohort (n=50) data are for descriptive comparison only. c, Neutralizing antibody titers were quantified at the time of the 3rd immunization (draw 4) and 1 week afterwards (draw 5). Data from draw 3 are the same as those in Figure 2. Blue boxplot shows median and boundaries between the 1st and 3rd quartiles for the control cohort at draw 3; whiskers depict 5th-95th percentiles. All data points represent biological replicates (n=20). P-values are based on two-sided paired t-tests from the interventional (n = 20) cancer cohort based on draw 4 versus draw 5 comparisons; draw 3 cancer cohort (n=53) and control cohort (n=50) data are for descriptive comparison only. d, Spike-specific T cell responses were quantified at the time of the 3rd immunization (draw 4) and 1 week afterwards (draw 5). Data from draw 3 are the same as those in Figure 3a. Blue boxplot shows median and boundaries between the 1st and 3rd quartiles for the control cohort at draw 3; whiskers depict 5th-95th percentiles. All data points represent biological replicates (n=20). P-values are based on two-sided paired t-tests from the interventional (n = 20) cancer cohort based on draw 4 versus draw 5 comparisons; draw 3 cancer cohort (n=53) and control cohort (n=50) data are for descriptive comparison only.

Update of

Comment in

References

    1. Wu F et al. A new coronavirus associated with human respiratory disease in China. Nature 579, 265–269 (2020). - PMC - PubMed
    1. Zhou P et al. A pneumonia outbreak associated with a new coronavirus of probable bat origin. Nature 579, 270–273 (2020). - PMC - PubMed
    1. Polack FP et al. Safety and Efficacy of the BNT162b2 mRNA Covid-19 Vaccine. New England Journal of Medicine 0, null (2020). - PMC - PubMed
    1. Baden LR et al. Efficacy and Safety of the mRNA-1273 SARS-CoV-2 Vaccine. New England Journal of Medicine 384, 403–416 (2021). - PMC - PubMed
    1. Kuderer NM et al. Clinical impact of COVID-19 on patients with cancer (CCC19): a cohort study. Lancet 395, 1907–1918 (2020). - PMC - PubMed

Publication types

MeSH terms

Associated data