. 2021 Oct;53(10):1469-1479.
doi: 10.1038/s41588-021-00927-7. Epub 2021 Sep 30.

Epigenetic encoding, heritability and plasticity of glioma transcriptional cell states

Affiliations

Epigenetic encoding, heritability and plasticity of glioma transcriptional cell states

Ronan Chaligne et al. Nat Genet. 2021 Oct.

Abstract

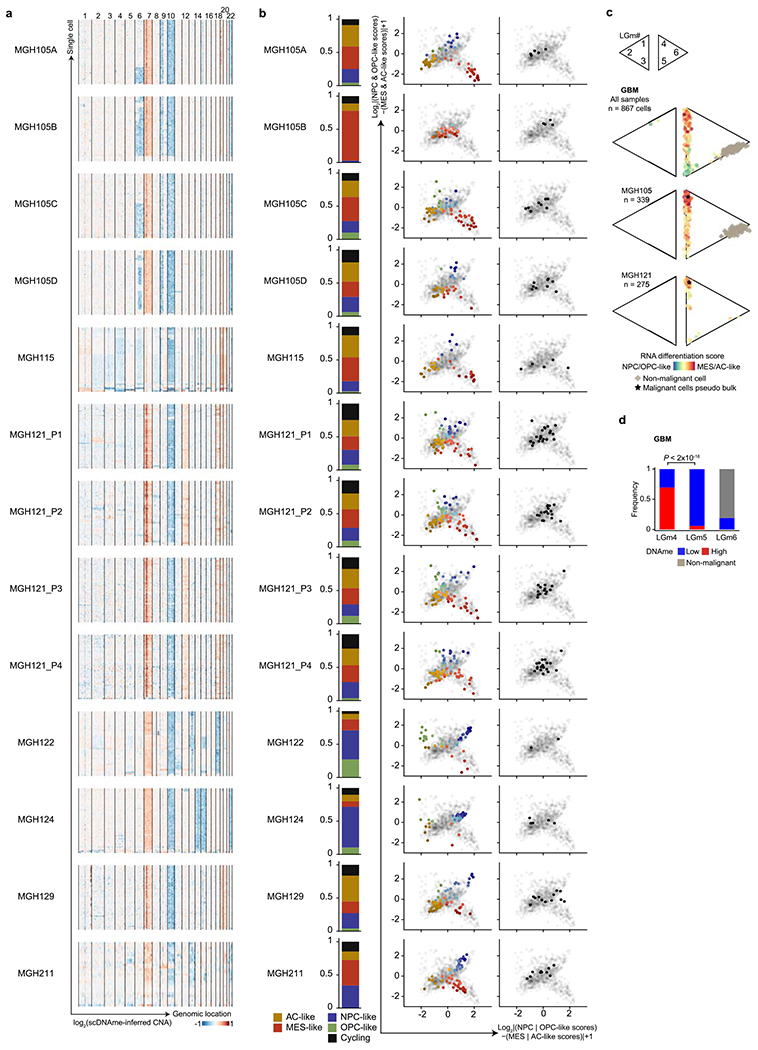
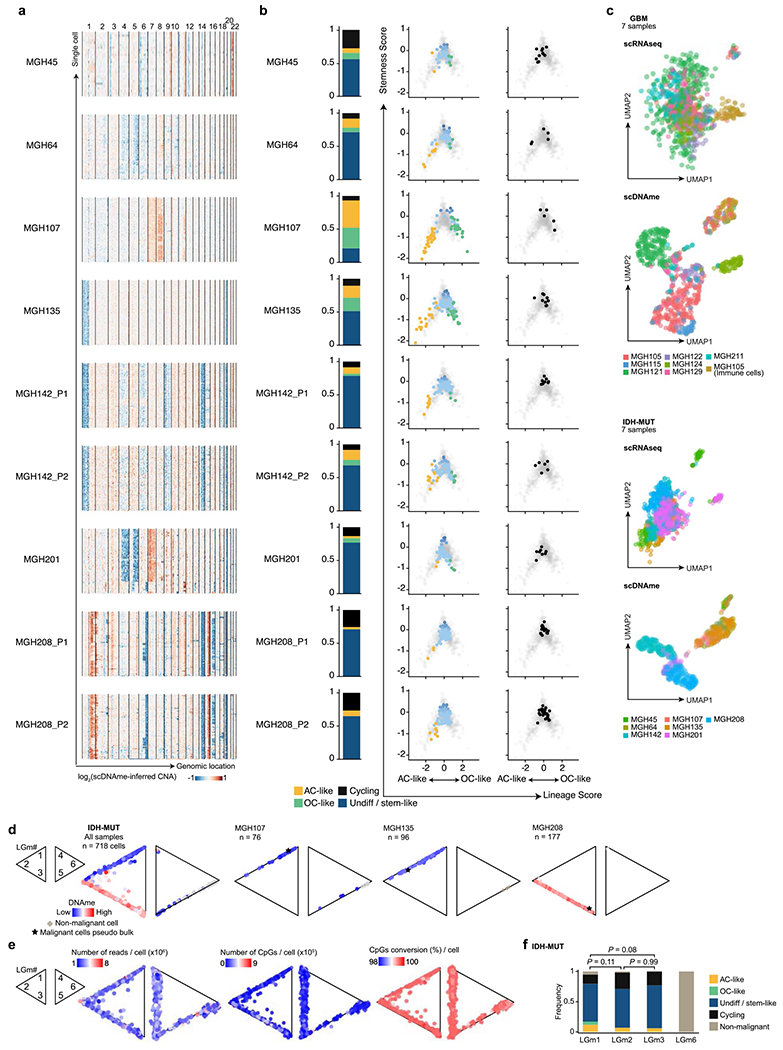
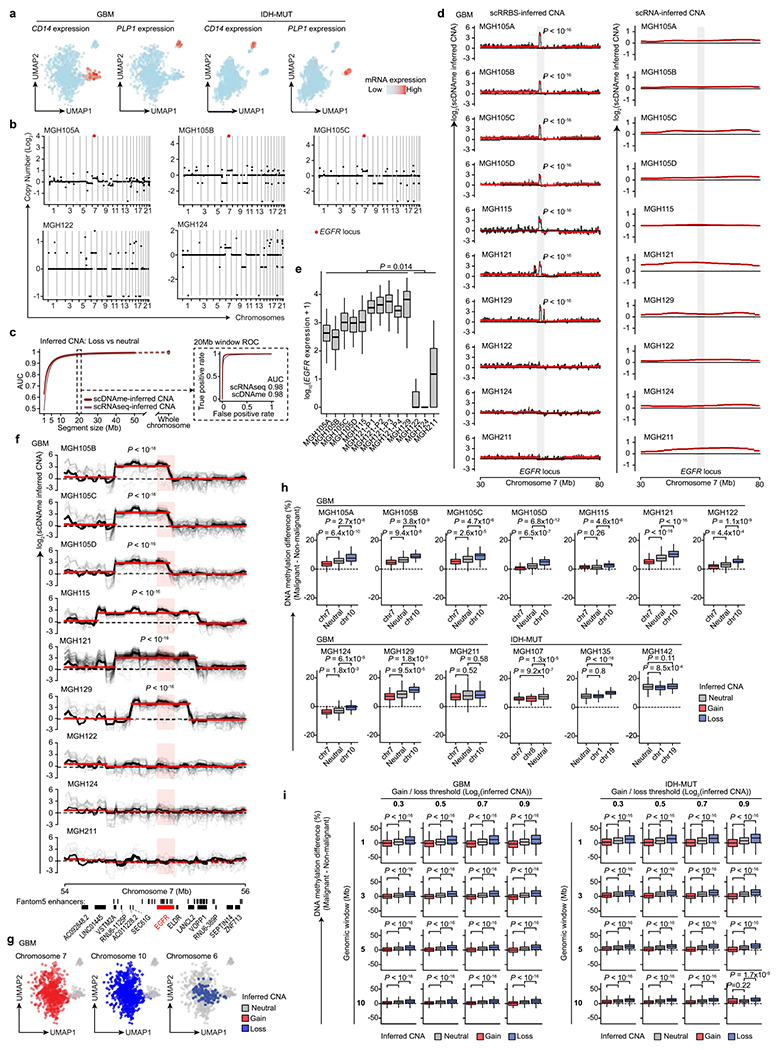
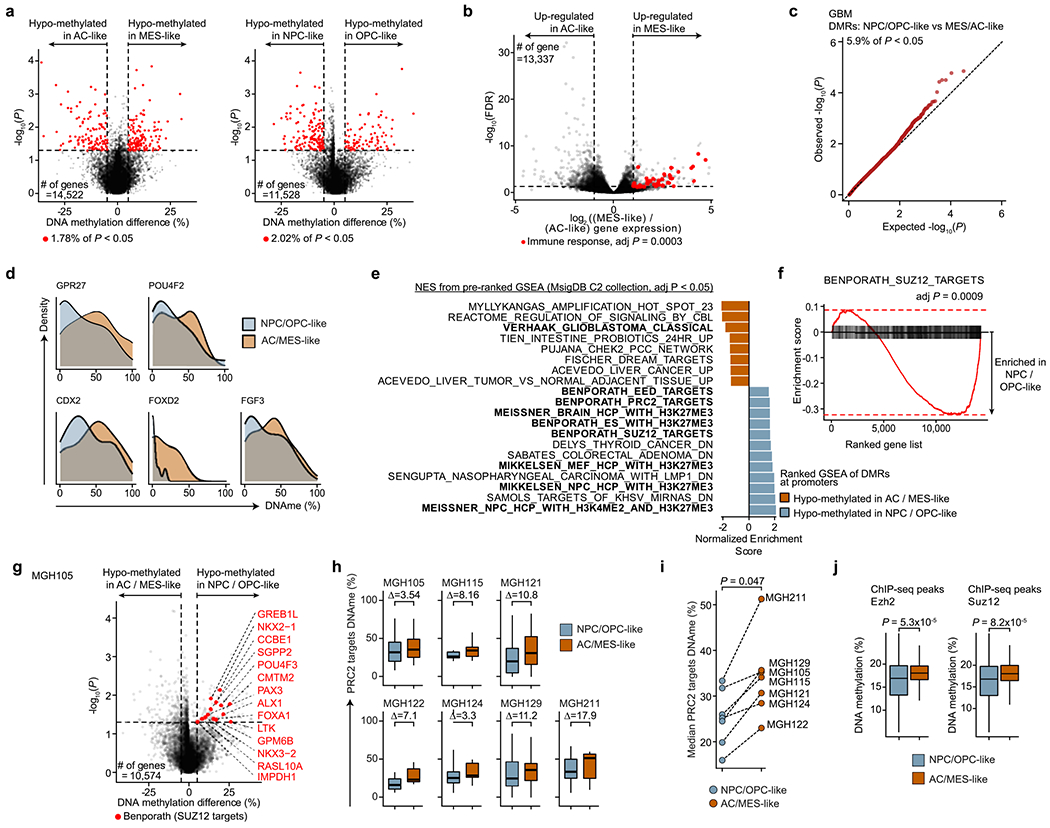
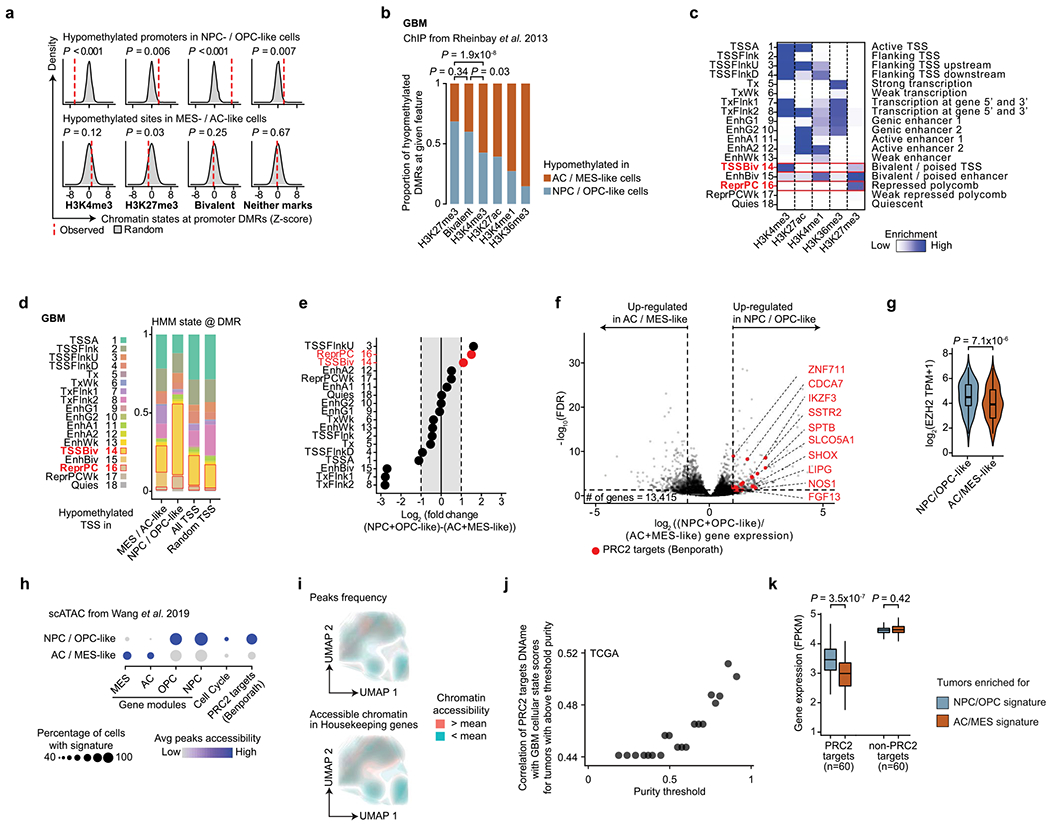
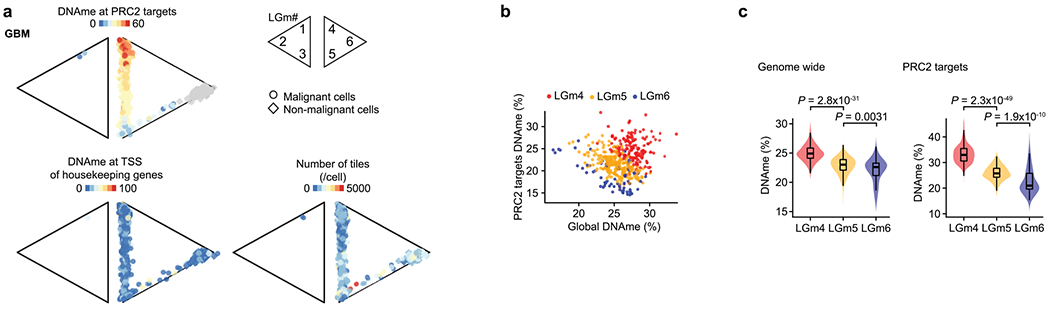
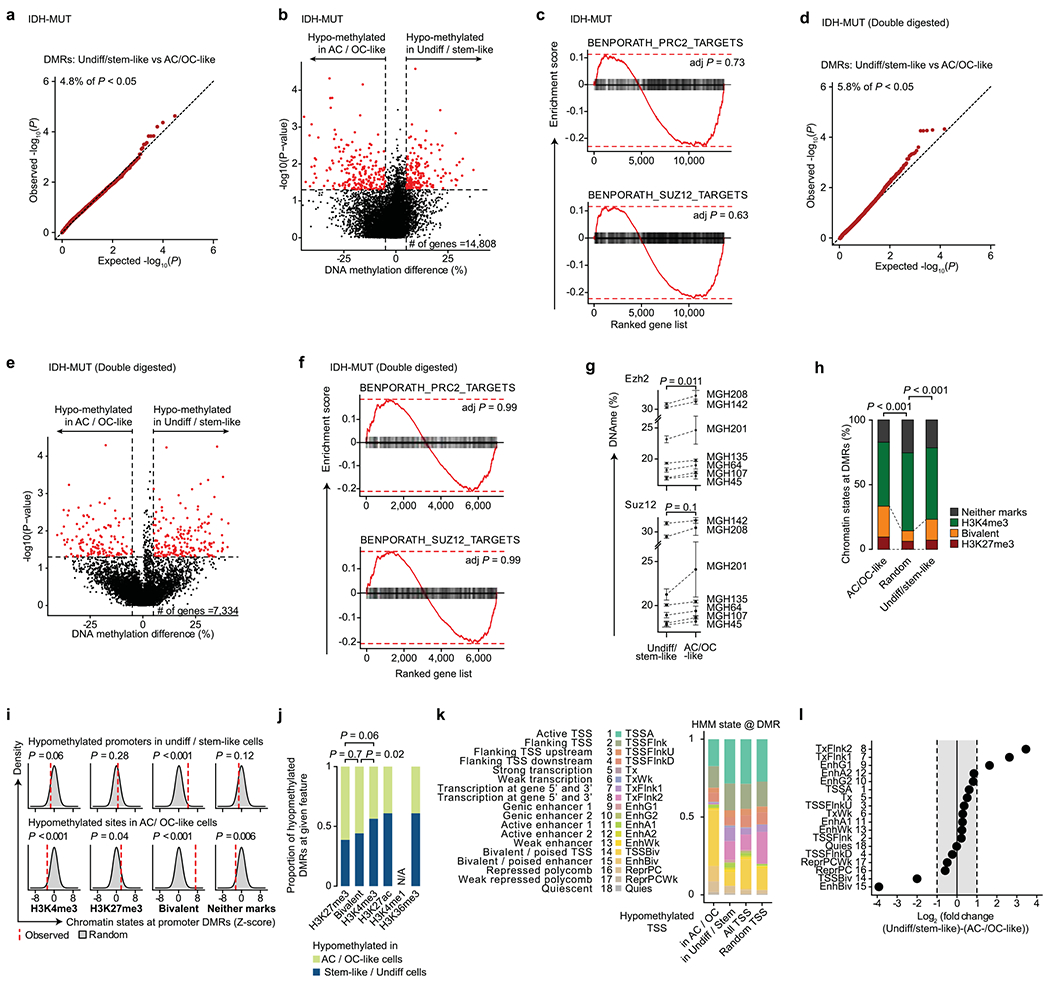
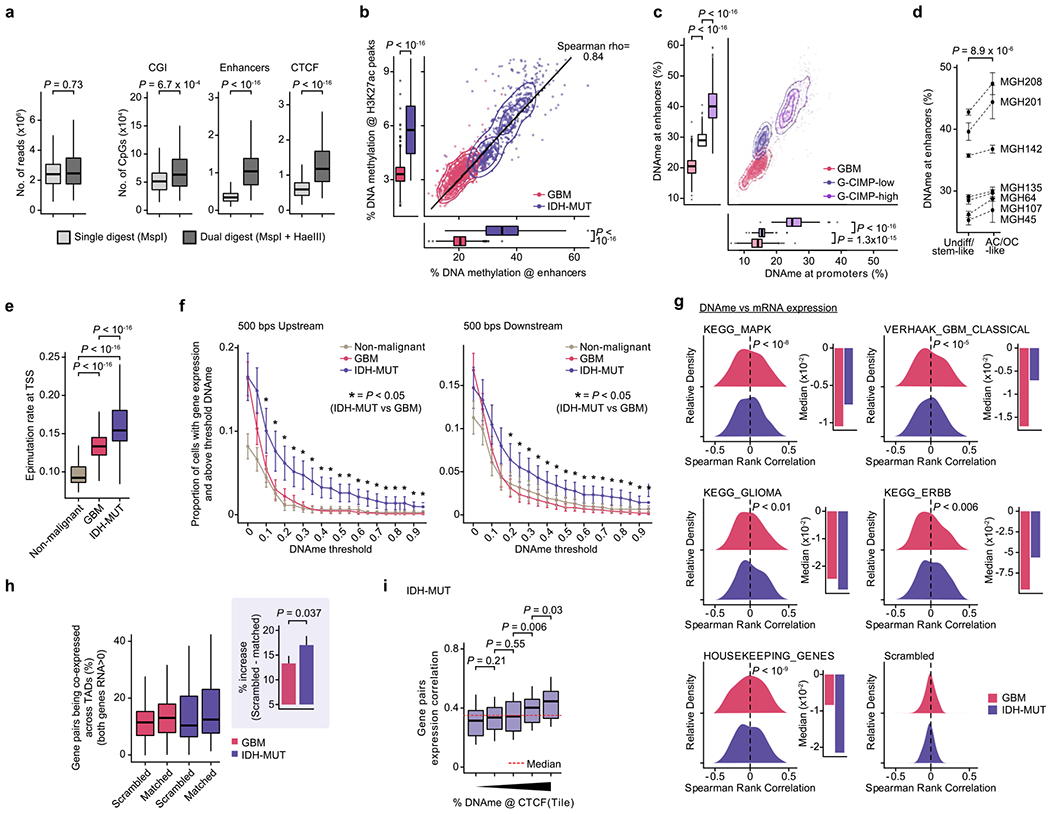
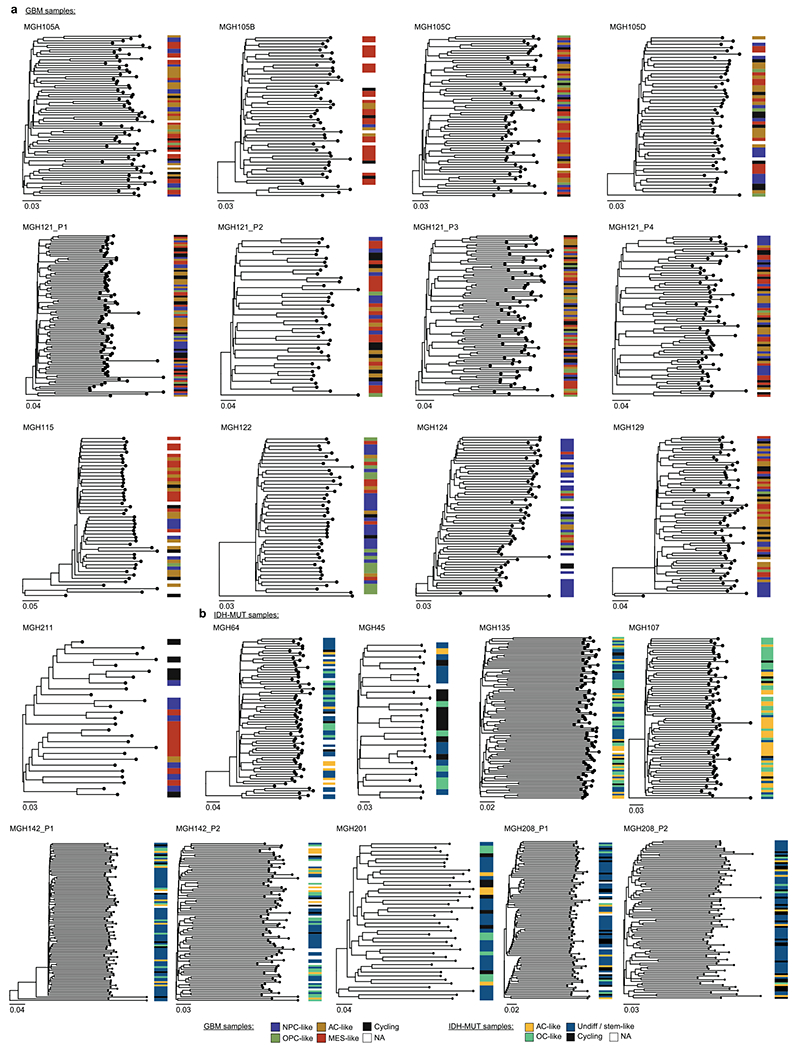
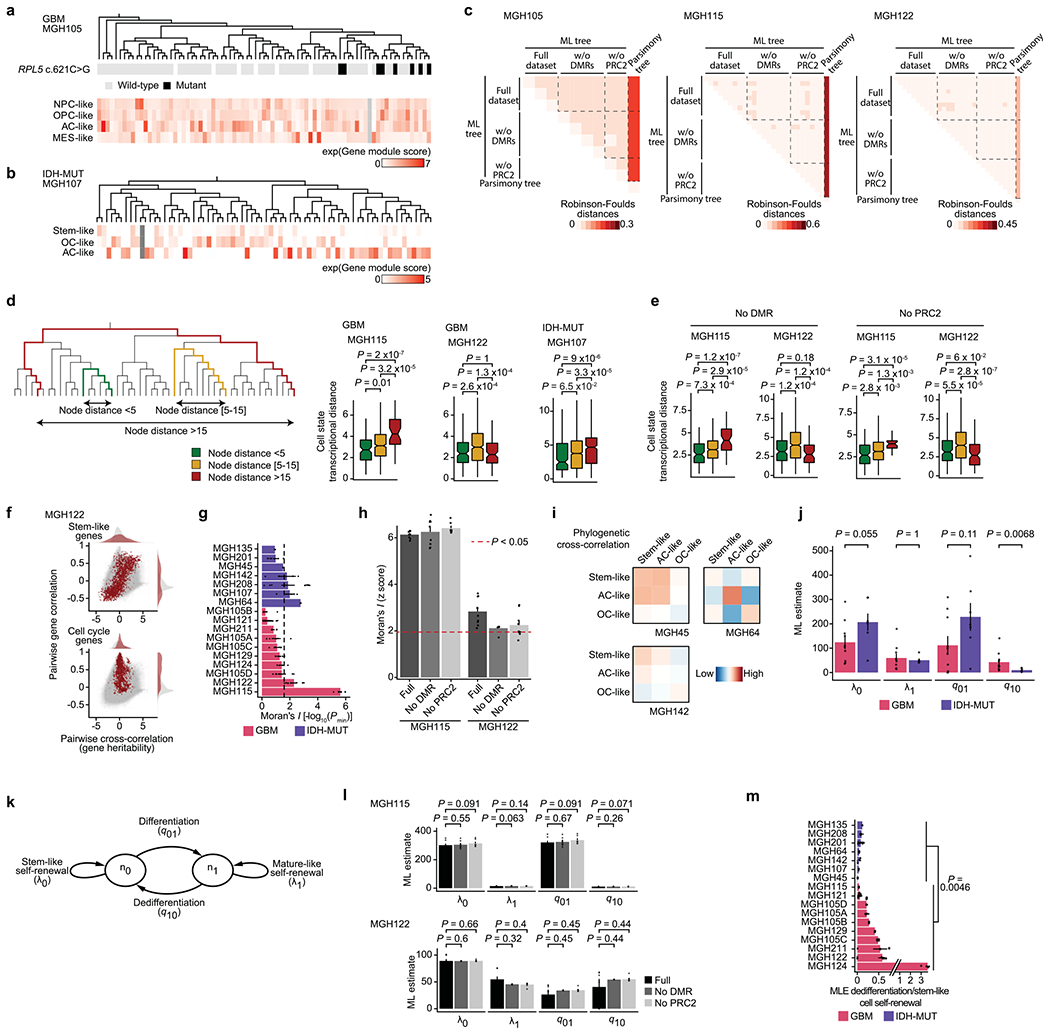
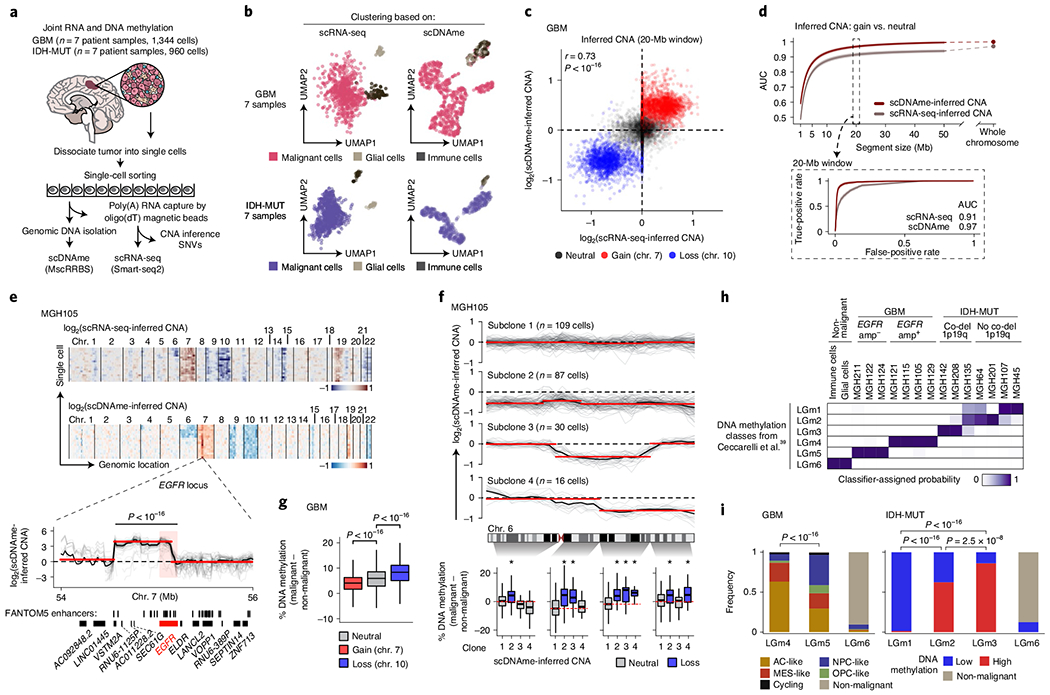
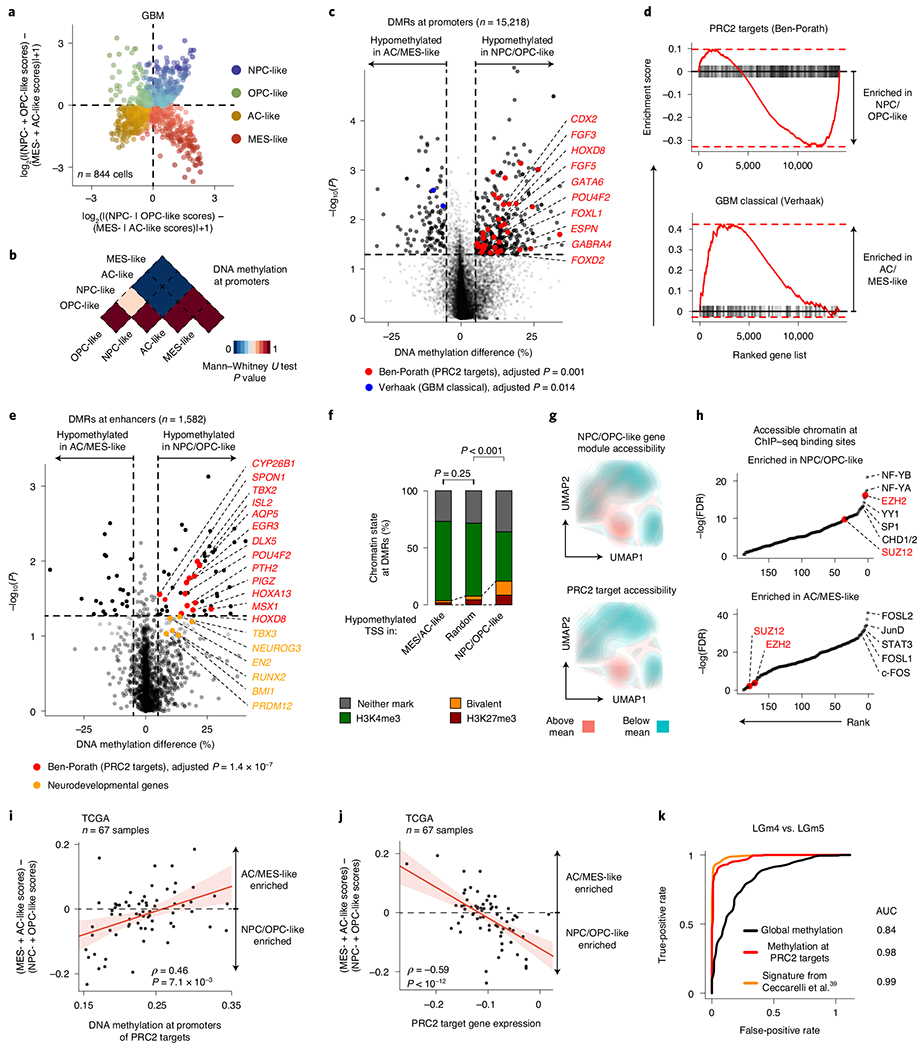
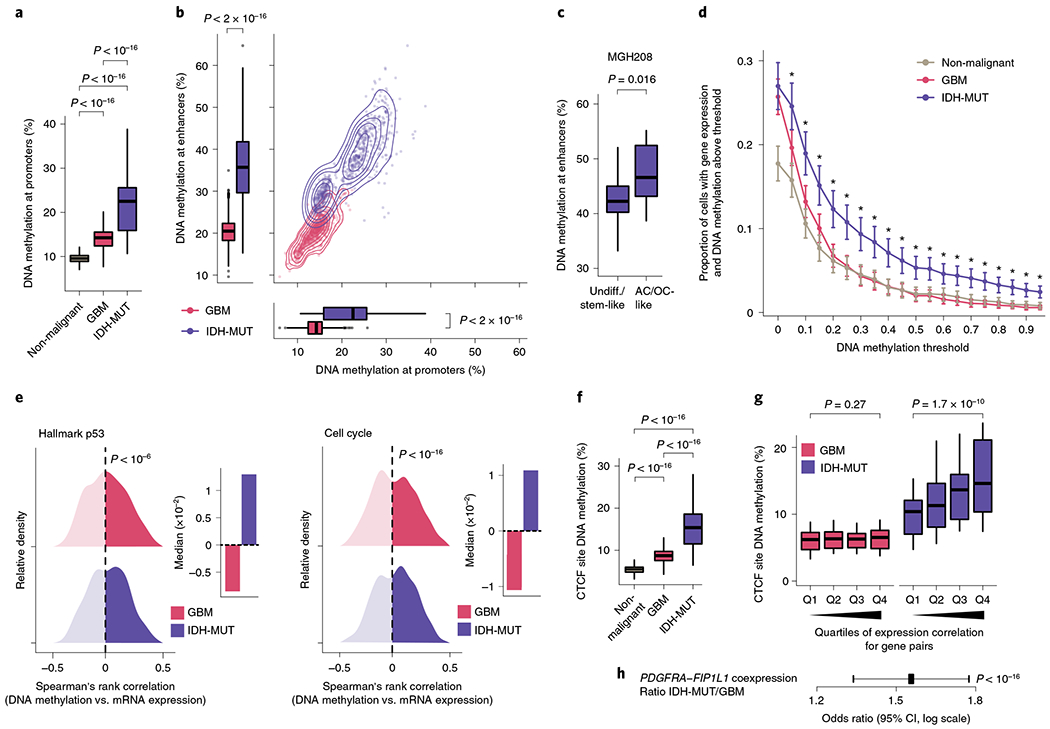
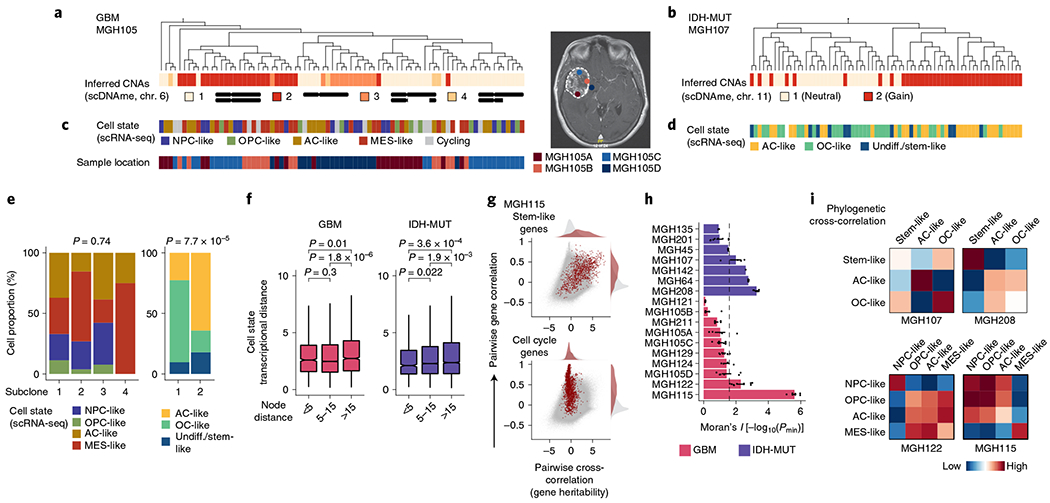
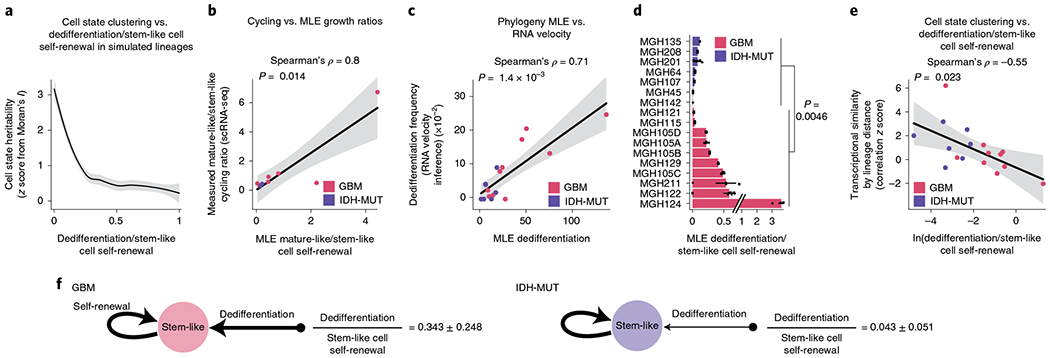
Single-cell RNA sequencing has revealed extensive transcriptional cell state diversity in cancer, often observed independently of genetic heterogeneity, raising the central question of how malignant cell states are encoded epigenetically. To address this, here we performed multiomics single-cell profiling-integrating DNA methylation, transcriptome and genotype within the same cells-of diffuse gliomas, tumors characterized by defined transcriptional cell state diversity. Direct comparison of the epigenetic profiles of distinct cell states revealed key switches for state transitions recapitulating neurodevelopmental trajectories and highlighted dysregulated epigenetic mechanisms underlying gliomagenesis. We further developed a quantitative framework to directly measure cell state heritability and transition dynamics based on high-resolution lineage trees in human samples. We demonstrated heritability of malignant cell states, with key differences in hierarchal and plastic cell state architectures in IDH-mutant glioma versus IDH-wild-type glioblastoma, respectively. This work provides a framework anchoring transcriptional cancer cell states in their epigenetic encoding, inheritance and transition dynamics.


Conflict of interest statement

Competing interests

M.L.S. is an equity holder, scientific cofounder and advisory board member of Immunitas Therapeutics. A.R. is a founder and equity holder of Celsius Therapeutics, is an equity holder in Immunitas Therapeutics and, until 31 July 2020, was a scientific advisory board member of Syros Pharmaceuticals, Neogene Therapeutics, Asimov and ThermoFisher Scientific. Since 1 August 2020, A.R. has been an employee of Genentech. Since 19 October 2020, O.R.-R. has been an employee of Genentech. D.A.L. is an equity holder, scientific cofounder and advisory board member of C2i Genomics and a scientific advisory board member for Mission Bio. The authors declare that these activities are not related to the research reported in this publication and have not influenced the conclusions in this manuscript. The remaining authors declare no competing interests.

Figures

Extended Data Fig. 1 |
Extended Data Fig. 1 |. Multi-omics single-cell sequencing of GBM reveals intra-tumoral DNAme heterogeneity.
a, CNA inference based on coverage depth imbalance in the scDNAme data in windows of 20 Mb (sliding window of 5 Mb). Rows correspond to cells, clustered by overall CNA pattern. b, Proportion of single cells belonging to GBM cellular states (left) and two-dimensional representation of GBM cellular states (middle) or cycling cells based on the relative expression of gene-sets associated with G1.S and G2.M (right) for each GBM patient sample (including MGH105 biological replicates and MGH121 technical replicates). Each quadrant corresponds to one cellular state and the exact position of malignant cells (dots) reflect their relative scores for pairs of gene modules previously defined in scRNAseq data. Light grey dots in the background represent all GBM samples (n = 844 malignant-only cells that passed quality control based on scRNAseq). c, Two-dimensional representation of single cells assigned to previously described LGm classes, visualized as triangle plots (where each vertex corresponds to one LGm class) across all 7 GBM samples (n = 867 cells [malignant and non-malignant] that passed quality control based on scDNAme, top), and the two samples harboring the highest number of cells: MGH105 (n = 339, middle) and MGH121 (n = 275, bottom). RNA differentiation score (defined as the difference in gene module scores between AC-/MES-like and NPC-/OPC-like cells) is overlaid. d, Proportion of GBM cells (n = 867 cells [malignant and non-malignant]) with high or low DNAme (defined as above or below the median of mean DNAme across windows of 1,000 bp around 450K array probes from TCGA glioma samples used in the analysis, respectively; Methods) assigned to previously described LGm classes. P value was determined by two-sided Fisher’s exact test (d).
Extended Data Fig. 2 |
Extended Data Fig. 2 |. Multi-omics single-cell sequencing of IDH-MUT reveals intra-tumoral DNAme heterogeneity.
a, CNA inference based on coverage depth imbalance in the scDNAme data in windows of 20 Mb. Rows correspond to cells, clustered by overall CNA pattern. b, Proportion of single cells belonging to IDH-MUT cellular states (left) and developmental hierarchy representation of IDH-MUT cellular states (middle) or cycling cells based on the relative expression of gene-sets associated with G1.S and G2.M (right) for each IDH-MUT patient sample. Lineage and stemness scores define the exact position of malignant cells (dots) as computed from scRNAseq data. Light grey dots in the background represent all IDH-MUT samples (n = 739 malignant-only cells that passed quality control based on scRNAseq). c, UMAP of all single cells that passed quality control based on scRNAseq (GBM n = 937, IDH-MUT n = 809) or scDNAme (GBM n = 867, IDH-MUT n = 718). Each patient sample is indicated. See also Fig. 1b. d, Two-dimensional representation of single cells assigned to previously described LGm classes, visualized as triangle plots (where each vertex corresponds to one LGm class) across all 7 IDH-MUT samples (n = 718 cells [malignant and non-malignant] that passed quality control based on scDNAme, left), and three representative samples: MGH107 (n = 76), MGH135 (n = 96), and MGH208 (n = 177). DNAme value is overlaid. e, Same as (d) for the 7 GBM and 7 IDH-MUT samples (n = 867 cells [malignant and non-malignant]; IDH-MUT, n = 718 cells [malignant and non-malignant] that passed quality control based on scDNAme). Number of reads per cell (left), number of CpGs per cell (middle), and CpG conversion rate per cell (right) are overlaid. f, Proportion of IDH-MUT cellular states or cycling cells (n = 718 cells [malignant and non-malignant]) assigned to previously described LGm classes. P values were determined by two-sided Fisher’s exact test (f).
Extended Data Fig. 3 |
Extended Data Fig. 3 |. High-resolution copy number alteration mapping enabled by single-cell multi-omics.
a, UMAP of single cells that passed quality control based on scRNAseq (GBM n = 937, IDH-MUT n = 809). b, CNA inference based on bulk WES for GBM samples MGH105A/B/C, MGH122, and MGH124. EGFR locus is highlighted. c, CNA inference by scDNAme (red line) and scRNAseq (grey line) performance in correctly classifying chr. loss vs. neutral, as assessed by the AUC of ROC curve at different genomic window resolutions. ROC curve at 20 Mb resolution is shown (inset). 95% confidence intervals were generated using bootstrapping. d, CNA inferred by scDNAme (left) and scRNAseq (right) at a 50 Mb region centered at EGFR locus. Mean CNA profile per sample is shown in black. Red lines represent CNA segments identified by circular binary segmentation (CBS) analysis. e, EGFR expression as assessed by scRNAseq for each GBM patient sample (n = 844 malignant-only cells that passed quality control based on scRNAseq). f, Same as (d) for CNA inference by scDNAme at a 2 Mb region centered at EGFR locus. Individual cell CNA profiles are shown in grey. g, UMAP of single cells as defined in (a). Clonal chr. 7 gain (left) and chr. 10 loss (middle), as inferred by scDNAme, along with sub-clonal loss of chr. 6 (right), are indicated. h, Percentage of CpG methylation change at copy number gain, loss, and neutral chromosomal regions when comparing DNAme level of individual malignant cells to baseline for GBM (n = 7) and IDH-MUT (n = 3) samples. i, Same as (h) across all GBM and IDH-MUT samples for different thresholds adopted to define copy number gain vs. loss genomic window resolutions. P values were determined by two-sided Mann-Whitney U-test (d-f, h-i), comparing the EGFR expression median values across samples (e). Boxplots represent the median, bottom and upper quartiles, whiskers correspond to 1.5 times the interquartile range.
Extended Data Fig. 4 |
Extended Data Fig. 4 |. GBM stem-like states exhibit PRC2 target hypomethylation compared with more differentiated-like cell states.
a, Differentially methylated TSS (±1Kb) between stem-like (NPC-like, n = 175 vs. OPC-like, n = 51; left) and differentiated GBM cellular states (MES-like, n = 201; AC-like, n = 168; right). b, Differential gene expression between AC-like (n = 205) and MES-like cells (n = 232). Genes with an absolute log2(fold-change) > 1 and BH-FDR < 0.05 were defined as differentially expressed (DE). DE genes belonging to immune response pathways are highlighted. c, Q-Q plot comparing the observed −log10P values of all genes used in the differential methylation analysis between GBM cellular states (Fig. 2c) to expected −log10P values. d, Distribution of mean promoter DNAme values in stem-like and differentiated cells for representative differentially methylated PRC2 target genes (Fig. 2c). e, Normalized enrichment scores for gene sets (MSigDB C2) enriched at hypomethylated promoters in NPC/OPC-like (turquoise) or MES-/AC-like (orange) cells (Fig. 2c; n = 15,218 genes). f, Enrichment score plot for SUZ12 targets gene set enriched at hypomethylated promoters in NPC-/OPC-like cells (Fig. 2c; n = 15,218 genes). g, Same as (a) for a representative GBM sample (MGH105; NPC-/OPC-like, n = 50 cells; MES-/AC-like, n = 138 cells). Genes belonging to PRC2 targets are labelled. h, Mean CpG methylation at promoters of PRC2 targets between cell states for each of the 7 GBM samples. Difference in median promoter DNAme at PRC2 targets between cell states is indicated. i, Median promoter DNAme at PRC2 targets of MES-/AC-like and NPC-/OPC-like cells for each of the 7 GBM samples. j, Mean CpG methylation at ChIP-seq maps of EZH2 and SUZ12 between GBM cell states (n = 706 cells). P values were determined by generalized linear model (a, c, g), weighted F-test (b), permutation test (f), two-sided Mann-Whitney U test (i, j). Boxplots represent the median, bottom and upper quartiles, whiskers correspond to 1.5 times the interquartile range.
Extended Data Fig. 5 |
Extended Data Fig. 5 |. Validation of PRC2 hypomethylation in GBM stem-like states using histone marks, single-cell ATACseq and TCGA bulk data.
a, Proportion of chromatin states at randomly sampled promoters (1,000 random samplings) and hypomethylated promoters in GBM stem-like (top) vs. AC/MES-like (bottom) cells. b, Proportion of ChIP-seq peaks at hypomethylated promoters in GBM stem-like vs. AC/MES-like cells. c, Heatmap of emission parameters for a HMM 18-state model derived from GBM ChIP-seq maps. Chromatin states of interest are highlighted in red. d, Proportion of chromatin states (see (c)) at hypomethylated promoters in GBM stem-like and AC/MES-like cells (Fig. 2c), all genes used in differential methylation promoter analysis (n = 15,218 genes), and randomly sampled promoters. e, Fold-change (log2) of chromatin states (see (c)) between hypomethylated promoters in GBM stem-like vs. AC/MES-like cells. Chromatin states of interest are highlighted in red. f, Differential gene expression between NPC/OPC-like (n = 270) and AC-/MES-like cells (n = 437). PRC2 target genes are highlighted. g, EZH2 expression (scRNAseq) between NPC-/OPC-like and MES-/AC-like cells across GBM samples. h, Gene expression activity derived from scATAC-seq open chromatin for GBM cellular states, cell cycle-related genes, and PRC2 targets at distinct NPC-/OPC-like and AC-/MES-like clusters identified based on scATACseq GBM data. i, UMAP of scATACseq GBM data (sample SF11956) overlaid with density plot of peaks frequency (top) and chromatin accessibility of housekeeping genes (bottom). j, Spearman’s rank-order correlation between mean DNAme at promoters of PRC2 targets and RNA differentiation score and bulk sample purity for 67 TCGA GBM samples,. k, Mean gene expression of hypomethylated PRC2 targets in stem-like cells (n = 60; Fig. 2c) and randomly selected non-PRC2 targets (n = 60) in TCGA GBM samples, enriched for NPC-/OPC-like vs. AC-/MES-like signature. P values were determined by permutation test (a), two-sided Fisher’s exact test (b), weighted F-test (f), two-sided Mann-Whitney U test (g, k). Boxplots represent the median, bottom and upper quartiles, whiskers correspond to 1.5 times the interquartile range.
Extended Data Fig. 6 |
Extended Data Fig. 6 |. PRC2 target DNAme underlies the classification of GBM tumors by bulk DNAme.
a, Two-dimensional representation of single cells assigned to previously described LGm classes, visualized as triangle plots (where each vertex corresponds to one LGm class) across 7 GBM samples (n = 867 cells [malignant and non-malignant] that passed quality control based on scDNAme). Mean DNAme at promoters of PRC2 targets (top), mean DNAme at promoters of housekeeping genes, and number of tiles per cell (bottom) are overlaid for each triangle plot. b, Comparison between mean genome wide DNAme (defined as the mean DNAme across windows of 1,000 bp around 450K array probes, Methods) and mean DNAme at promoters (TSS ± 1Kb) of PRC2 targets for the 478 TCGA GBM samples that were classified as LGm4-6 by Ceccarelli et al.. LGm classes assignment for each sample is shown. c, Left: mean genome wide DNAme for TCGA GBM samples (n = 478) previously classified as either LGm4, LGm5, or LGm6 by Ceccarelli et al. Right: mean DNAme at promoters (TSS ± 1Kb) of PRC2 targets for TCGA GBM samples (n = 478) previously classified as either LGm4, LGm5, or LGm6 by Ceccarelli et al.. P values were determined by two-sided Mann-Whitney U test (c). Boxplots represent the median, bottom and upper quartiles, whiskers correspond to 1.5 times the interquartile range.
Extended Data Fig. 7 |
Extended Data Fig. 7 |. Comparison of DNA methylation and chromatin state patterns between transcriptional cell states in IDH-MUT.
a, Q-Q plot comparing the observed −log10P values of genes used in the differential methylation analysis of promoters (n = 14,808 genes) between undiff/stem-like and AC-/OC-like IDH-MUT cellular states (defined in (b)) to expected −log10P values. b, Differentially methylated promoters between undiff/stem-like (n = 251) and AC-/OC-like (n = 133) cells with matched scRNAseq and scDNAme data across IDH-MUT samples. Promoters with absolute mean DNAme difference > 5% and P values < 0.05 were defined as differentially methylated (red). c, Enrichment score plots (n = 14,808 genes, as in (b)) for PRC2 and SUZ12 targets between stem-like/undifferentiated cells and AC-/OC-like cells in IDH-MUT samples. d-f, Same as (a-c), for single-cell DNA methylomes obtained performing double digestion with HaeIII+MspI on cells from two IDH-MUT samples (MGH201 and MGH208). g, Mean (±s.e.m.) CpG methylation at ChIP-seq maps of EZH2 and SUZ12 between undiff/stem-like and AC-/OC-like cells in each IDH-MUT sample. h, Proportion of chromatin states at hypomethylated promoters in IDH-MUT AC-/OC-like cells (defined in (b)), randomly sampled promoters (1,000 random samplings), and hypomethylated promoters in IDH-MUT undiff/stem-like (defined in (b)). i, Proportion of chromatin states at randomly sampled promoters (1,000 random samplings) and hypomethylated promoters in IDH-MUT undiff/stem-like (top) vs. AC-/OC-like cells (bottom.) j, Proportion of ChIP-seq peaks at hypomethylated promoters in IDH-MUT undiff/stem-like vs. AC-/OC-like cells. k, Proportion of each of the chromatin states (defined in Extended Data Fig. 5c) at hypomethylated promoters in IDH-MUT undiff/stem-like (defined in (b)), hypomethylated promoters in IDH-MUT AC-/OC-like cells (defined in (b)), all genes used in differential methylation promoter analysis (n = 14,808 genes), and randomly sampled promoters, respectively. l, Fold-change (log2) of chromatin states between hypomethylated promoters in IDH-MUT undiff/stem-like vs. AC-/OC-like cells. P values were determined by generalized linear model (a-b, d-e), Fisher’s combined probability test (g), permutation test (c, f, h-i), two-sided Fisher’s exact test (j).
Extended Data Fig. 8 |
Extended Data Fig. 8 |. IDH-MUT cells exhibit preferential enhancer hypermethylation, decoupling of the promoter methylation-expression relationship and disruption of CTCF insulation.
a, Number of aligned reads and unique CpGs for MspI (n=476) and HaeIII+MspI digested IDH-MUT cells (n=242; MGH201 and MGH208). b, Mean CpG methylation at FANTOM5 enhancers vs. H3K27ac ChIP-seq peaks, between GBM (n=765) and IDH-MUT (n=670) cells. c, Mean CpG methylation at TSS (±1Kb) vs. FANTOM5 enhancers between GBM (n=765) and IDH-MUT (n=670) cells (G-CIMP-low [MGH107, MGH135, MGH45, MGH64]; G-CIMP-high [MGH142, MGH201, MGH208]). d, Mean (±SEM) CpG methylation at FANTOM5 enhancers for stem-like/undifferentiated and AC-/OC-like IDH-MUT cells. e, Epimutation rate across non-malignant (n=148), GBM (n=765) and IDH-MUT (n=670) cells. f, Proportion of cells with gene expression (read count >0) and above-threshold DNAme at 500 base-pairs regions upstream (left) or downstream (right) of TSS. Data are mean (±s.e.m.) across all genes (expression seen in > 5 cells, DNAme >5 CpGs per region) for non-malignant cells (n=148), GBM (n=765) and IDH-MUT (n=670) cells. ’*’ P-value < 0.05. g, Left: Distribution of Spearman’s rho of expression and promoter DNAme correlation (n=1,523 genes expressed >5 cells, DNAme >5 CpGs per promoter); GBM (n=765) and IDH-MUT (n=670) cells. Right: Median values of Spearman’s rho of expression and promoter DNAme correlation. h, Percentage of genes pairs across CTCF sites being co-expressed (both RNA read count >0); GBM (n=765) and IDH-MUT (n=670) cells. Scrambled represents randomly permuted cell labels for the expression values. Inset: Increase in percentage of genes pairs across CTCF sites being co-expressed when comparing matched vs. scrambled groups. Error bars represent 95% CIs. i, Gene expression correlation (Spearman’s rho) of genes pairs across CTCF sites per tile of mean CpG methylation at CTCF binding sites (low-to-high); IDH-MUT (n=670) cells. P values are two-sided Mann-Whitney U test (a-c, e-f, h-i), Fisher’s combined probability test (d), two-sided Kolmogorov-Smirnov test (g). Boxplots represent the median, bottom and upper quartiles, whiskers correspond to 1.5 times the interquartile range.
Extended Data Fig. 9 |
Extended Data Fig. 9 |. High-resolution DNAme-based lineage trees coupled with leaf annotation of cellular states.
a, Representative (random cell subsampling) DNAme-based lineage tree for each GBM patient sample (including MGH105 biological replicates and MGH121 technical replicates), with projection of GBM cellular states. b, Representative (random cell subsampling) DNAme-based lineage tree for each IDH-MUT patient sample (including MGH142 and MGH208 technical replicates), with projection of IDH-MUT cellular states. Throughout the figure, scale represents DNAme changes per site.
Extended Data Fig. 10 |
Extended Data Fig. 10 |. Cell state transition dynamics inference from lineage tree architectures revealed higher cellular plasticity in GBM compared to a more stable differentiation hierarchy in IDH-MUT.
a, Top: GBM DNAme-based lineage tree (MGH105) with RPL5 c.621 C>G genotyping. Bottom: GBM gene module scores. b, IDH-MUT DNAme-based lineage tree (MGH107) with IDH-MUT gene module scores. c, Normalized Robinson-Foulds between GBM tree replicates (from same sample; full dataset or removing CpGs from DMRs (Fig. 2c) or PRC2 targets) reconstructed by maximum-likelihood (ML) vs. maximum parsimony. d, Transcriptional distances as function of lineage distance between unique cell pairs for MGH115, MGH122 and MGH107. e, As (d), for DNAme-based lineage tree of MGH115 and MGH122 (n=47 and 46 cells, respectively) reconstructed removing CpGs from DMRs (Fig. 2c) or PRC2 targets. f, Pairwise gene expression correlation (Pearson’s) and cross-correlation (heritability). Grey points=all gene pair relationships; red points=gene pair relationships within selected gene module (top: stem-like; bottom: cell cycle). g, Phylogenetic association of cell states on GBM (n=7 patients; n=10 samples with MGH105A-D) and IDH-MUT (n=7 patients). Barplots=weighted mean±s.e.m. Moran’s I permutation-based one-sided P values (106 permutations) across replicates. Dashed line: P=0.025. h, As (g), comparing DNAme-based lineage tree reconstruction of MGH115 and MGH122, using replicates from same sample with full dataset or removing CpGs from DMRs (Fig. 2c) or PRC2 targets. Barplots=mean±s.e.m. i, Heat maps of pairwise cell state phylogenetic associations. Close phylogenetic associations are shown in warmer colors. j, ML estimate (median±MAD across tree replicates; samples as in (g)) rates of cell state growth and transition. k, Mathematical model of glioma evolutionary dynamics. l, ML estimate (mean±s.e.m. across tree replicates of MGH115 and MGH122) rates of cell state self-renewal and transition, using replicates from same sample (full dataset or removing CpGs from DMRs analysis (Fig. 2c) or PRC2 targets). m, Weighted median±weighted MAD rates of dedifferentiation compared to stem-like cell self-renewal across lineage tree replicates (sample as in (g)). P values: two-sided Mann-Whitney U test (d-e, j, l-m). Boxplots: median, bottom and upper quartiles, whiskers: 1.5 times the interquartile range.
Fig. 1 |
Fig. 1 |. Multiomics single-cell sequencing of primary human gliomas reveals intratumoral DNA methylation heterogeneity.
a, Joint methylomics and transcriptomics analysis applied to seven GBM and seven IDH-MUT glioma samples. b, UMAP plots of single cells that passed quality control based on data from scRNA-seq (left; GBM, n = 937; IDH-MUT, n = 809) or scDNAme (right; GBM, n = 867; IDH-MUT, n = 718). c, CNA inference by scDNAme (y axis) versus scRNA-seq (x axis) in 20-Mb windows. Pearson’s correlation coefficient is indicated. d, Performance of CNA inference by scDNAme (red line) and scRNA-seq (gray line) in correctly classifying regions of chromosome gain versus neutral regions, as assessed by the AUC of the receiver operating characteristic (ROC) curve at different genomic window resolutions. Inset, ROC curves at 20-Mb resolution. 95% confidence intervals were generated using bootstrapping. e, Top, representative example (MGH105) of CNA inference by scRNA-seq and scDNAme. Rows correspond to cells, clustered by overall CNA pattern. Bottom, CNA inference by scDNAme centered at the EGFR locus. CNA profiles for individual cells are shown in gray, with the mean per sample shown in black. Red lines represent CNA segments identified by circular binary segmentation analysis. f, Top, CNA inference by scDNAme at chromosome 6 showing distinct genetic subclones within the same tumor (MGH105). Color legend as in e. Bottom, CpG methylation changes at four regions of chromosome 6 when comparing the DNA methylation level of individual cells in each subclone to baseline. *P < 0.05. g, Percentage of CpG methylation change at regions with copy number gain (chromosome 7) or loss (chromosome 10) and neutral regions (chromosome 1) when comparing DNA methylation levels for individual GBM cells to baseline across all GBM samples. h, Heat map of probability assignment for pseudo-bulk DNA methylation profiles (based on MscRRBS) of malignant cells across all GBM and IDH-MUT glioma samples and non-malignant cells (defined in b) to previously described LGm classes based on a multinomial logistic regression classifier (Methods). Amp, amplification; co-del, co-deletion. i, Proportion of all single cells (defined in b) assigned to previously described DNA methylation LGm classes. P values were determined by two-sided Mann–Whitney U test (eg) or Fisher’s exact test (i). Boxplots represent the median and bottom and upper quartiles; whiskers correspond to 1.5 times the interquartile range.
Fig. 2 |
Fig. 2 |. PRC2 target DNA methylation is a key switch in the differentiation of malignant GBM cells.
a, Two-dimensional representation of cellular states across seven GBM samples (n = 844 malignant-only cells that passed scRNA-seq quality control). b, Heat map of P values obtained when comparing mean CpG methylation at promoters (TSS ± 1 kb) between GBM cellular states (n = 706, cells in a with matched scDNAme data). c, Volcano plot of differentially methylated promoters between the NPC/OPC-like and AC/MES-like GBM cellular states. Promoters (n = 459) with an absolute mean DNA methylation difference of greater than 5% and a P value below 0.05 were defined as differentially methylated. Genes correlated with the classical TCGA GBM subtype (blue) and genes corresponding to PRC2 targets (red) are highlighted (BH FDR-adjusted permutation-based P < 0.05). d, Enrichment score plots (reflecting whether a gene set is over-represented at the top or bottom of the ranked list of genes used in c; n = 15, 218 genes) for gene sets enriched at hypomethylated promoters in NPC/OPC-like (top) or AC/MES-like (bottom) cells. e, Volcano plot of differentially methylated enhancers in comparison of NPC/OPC-like and AC/MES-like GBM cellular states. Putative gene targets of hypomethylated enhancers in stem-like cells that are PRC2 targets are labeled in red. Key neurodevelopmental genes are highlighted in orange. f, Proportion of chromatin states at hypomethylated promoters in GBM AC/MES-like cells (defined in c), randomly sampled promoters (1,000 promoters sampled) and hypomethylated promoters in GBM stem-like cells (defined in c). g, UMAP plots of scATAC-seq GBM data (sample SF11956) overlaid with density plots showing chromatin accessibility of genes belonging to NPC/OPC-like gene modules (top) and PRC2 targets (bottom). h, Comparison of rank (by P value) in the enrichment of open chromatin at transcription factor-binding sites (n = 188) between NPC/OPC-like (top) and AC/MES-like (bottom) cells. PRC2 subunits are highlighted in red. i, Spearman’s rank-order correlation between mean DNA methylation at the promoters of PRC2 targets and RNA differentiation score (defined as the difference in gene module scores between AC/MES-like and NPC/OPC-like cellular states) for 67 TCGA GBM samples,. A linear regression line (red) with its 95% confidence interval is shown. j, Same as in i, for PRC2 target gene expression and RNA differentiation score. k, Comparison of performance, as assessed by ROC curve, in correctly classifying bulk TCGA GBM samples, to DNA methylation glioma subtypes (LGm4 or LGm5) using 1,300 previously defined CpG sites, mean global DNA methylation and mean PRC2 target DNA methylation. P values were determined by two-sided Mann-Whitney U test (b), generalized linear model (c,e), permutation test (f), BH FDR-adjusted hypergeometric test (h) or Spearman’s rank-order correlation (i,j).
Fig. 3 |
Fig. 3 |. Increased enhancer DNA methylation, decoupling of promoter methylation-expression relationship and disruption of CTCF insulation define the IDH-MUT epigenome.
a, Mean CpG methylation at promoters (TSS±1 kb) comparing non-malignant cells (n = 148) with GBM (n = 765) and IDH-MUT (n = 670) malignant cells. b, Mean CpG methylation at promoters versus FANTOM5 enhancers for GBM (n = 765) and IDH-MUT (n = 670) malignant cells. c, Mean CpG methylation at FANTOM5 enhancers for undifferentiated/stem-like and AC/OC-like IDH-MUT cells (MGH208; n = 123 cells with matched scRNA-seq and scDNAme data). d, Proportion of cells with gene expression (RNA read count > 0) and exhibiting above-threshold DNA methylation. Data are shown as mean±s.e.m. across all genes with sufficient RNA (expression seen in >5 cells) and DNA methylation (>5 CpGs per promoter) information across non-malignant cells (n = 148) and GBM (n = 765) and IDH-MUT (n = 670) malignant cells. *P < 0.05. e, Left plot, distribution of Spearman’s rho for correlation of expression with promoter DNA methylation (n = 1,523 genes expressed in >5 cells, DNA methylation at >5 CpGs per promoter) across GBM (n = 765) and IDH-MUT (n = 670) malignant cells. The distribution of Spearman’s rho values was compared to the distribution of values obtained with randomly permuted cell labels. Right plot, median values of Spearman’s rho for correlation of expression with promoter DNA methylation. See also Extended Data Fig. 8g. f, Mean CpG methylation at CTCF-binding sites comparing non-malignant cells (n = 148) with GBM (n = 765) and IDH-MUT (n = 670) malignant cells. g, Mean CpG methylation at CTCF-binding sites per quartile of gene expression correlation (Spearman’s rho) for previously defined pairs of neighboring genes separated by CTCF-binding sites in GBM (n = 765) and IDH-MUT (n = 670) malignant cells. h, The log odds ratio of PDGFRA-FIP1L1 gene pair coexpression (for both genes, RNA read count > 0) in IDH-MUT and GBM malignant cells. Error bar represents the 95% confidence interval (CI). P values were determined by two-sided Mann-Whitney U test (ad,f,g; by comparing the proportion of cells with gene expression and exhibiting above-threshold DNA methylation in IDH-MUT and GBM cells at each DNA methylation threshold in d), two-sided Kolmogorov-Smirnov test (e) and Fisher’s exact test (h). Boxplots represent the median and bottom and upper quartiles; whiskers correspond to 1.5 times the interquartile range.
Fig. 4 |
Fig. 4 |. Heritability of glioma malignant cell states inferred from lineage tree architectures.
a, Representative (random cell subsampling within each of the four spatial locations sampled) DNA methylation-based lineage tree of GBM (MGH105) cells, with projection of chromosome 6 inferred CNAs (as defined in Fig. 1f). b, Representative DNA methylation-based lineage tree of IDH-MUT (MGH107) cells, with projection of chromosome 11 inferred CNAs. c, Projection onto the DNA methylation-based lineage tree of GBM MGH105 (see a) of cellular states (top) and sample collection location (bottom). Right, the magnetic resonance imaging (MRI) image from MGH105 indicates the four spatially distinct regions sampled. d, Projection onto the DNA methylation-based lineage tree of IDH-MUT MGH107 (see b) of cellular states. e, Proportion of cells belonging to GBM (MGH105; left) or IDH-MUT (MGH107; right) cellular states in distinct genetic subclones as identified by scDNAme-based CNA inference at chromosome 6 (left) or chromosome 11 (right). f, Comparison of transcriptional distances (measured as Euclidean distances between gene module scores) as a function of lineage distance (defined as <5, between 5 and 15, and >15 nodes away) for unique cell pairs from GBM (left; n = 7 patients) and IDH-MUT (right; n = 7 patients) lineage trees. g, Pairwise gene expression correlation (Pearson’s) and cross-correlation (heritability). Gray points represent all gene pair relationships, and red points represent gene pair relationships within the same selected gene module (top, stem-like; bottom, cell cycle). Correlation and cross-correlation densities are shown in the plot margins. h, Phylogenetic association of cell states on GBM (n = 7 patients; n = 10 biological replicates if considering the four spatially distinct regions sampled from MGH105) and IDH-MUT (n = 7 patients) lineage trees, as measured by cell state gene module expression autocorrelation with Moran’s I (ref. ). Barplots represent mean±s.e.m. Moran’s I permutation-based one-sided P values (106 permutations) were calculated across lineage tree replicates. The dashed line corresponds to a P value of 0.025. i, Heat maps of pairwise cell state phylogenetic associations (gene module cross-correlation analytical z scores). Close phylogenetic associations are shown in warmer colors, and distant associations are shown in cooler colors. P values were determined by two-sided Fisher’s exact test (e) or two-sided Mann-Whitney U test (f). Boxplots represent the median and bottom and upper quartiles; whiskers correspond to 1.5 times the interquartile range.
Fig. 5 |
Fig. 5 |. GBMs exhibit higher cellular plasticity while IDH-MUT gliomas have a more stable differentiation hierarchy.
a, Simulated lineage trees (n = 1,000) with varying rates of dedifferentiation compared to stem-like cell self-renewal (x axis) as a function of phylogenetic association of cellular states (as measured by z scores from Moran’s I; y axis). The LOESS regression line (black) with its 95% confidence interval (gray) is shown. b, Comparison of the mathematical model’s estimates (MLE, maximum-likelihood estimation; weighted median across lineage tree replicates for each GBM (pink) and IDH-MUT (purple) sample) of cell state self-renewal in differentiated-like versus stem-like states with cycling rates derived from the scRNA-seq expression profiles. Spearman’s rho is indicated. Only samples with at least two cycling stem-like and two cycling differentiated-like cells were used (Methods). The linear regression line (black) with its 95% confidence interval (gray) is shown. c, Same as in b for comparison of the mathematical model’s estimates of dedifferentiation with dedifferentiation rates provided by RNA velocity estimation (Methods). The linear regression line (black) with its 95% confidence interval (gray) is shown. d, Rates of dedifferentiation compared to stem-like cell self-renewal (as estimated by mathematical modeling) in GBM (n = 7 patients; n = 10 if considering the four spatially distinct regions sampled from MGH105) and IDH-MUT (n = 7 patients) tumors across lineage tree replicates (Methods). Barplots represent median ± median absolute deviation (MAD) across lineage tree replicates. Medians are weighted to balance plates with a disparate number of lineage tree replicates within samples. e, Dedifferentiation/stem-like cell self-renewal ratio (weighted median across lineage tree replicates for each GBM (pink) and IDH-MUT (purple) sample; x axis) compared to cell state clustering on the lineage tree as measured by transcriptional similarity (mean across tree replicates of a gene module by lineage distance Pearson’s correlation z score; 1,000 permutations). The linear regression line (black) with its 95% confidence interval (gray) is shown. f, Data-driven model of cell state transition dynamics inferred from DNA methylation-based lineage trees. The median± MAD dedifferentiation/stem-like cell self-renewal ratios across GBM (n = 7 patients) and IDH-MUT (n = 7 patients) samples are shown. P values were determined by two-sided Mann–Whitney U test (d), comparing the weighted median dedifferentiation/stem-like cell self-renewal ratio of GBM samples with the weighted median dedifferentiation/stem-like cell self-renewal ratio of IDH-MUT samples.

Comment in

References

    1. Tirosh I et al. Dissecting the multicellular ecosystem of metastatic melanoma by single-cell RNA-seq. Science 352, 189–196 (2016). - PMC - PubMed
    1. Nam AS et al. Somatic mutations and cell identity linked by genotyping of transcriptomes. Nature 571, 355–360 (2019). - PMC - PubMed
    1. Puram SV et al. Single-cell transcriptomic analysis of primary and metastatic tumor ecosystems in head and neck cancer. Cell 171, 1611–1624 (2017). - PMC - PubMed
    1. Hata AN et al. Tumor cells can follow distinct evolutionary paths to become resistant to epidermal growth factor receptor inhibition. Nat. Med 22, 262–269 (2016). - PMC - PubMed
    1. Shaffer SM et al. Rare cell variability and drug-induced reprogramming as a mode of cancer drug resistance. Nature 546, 431–435 (2017). - PMC - PubMed

Publication types

MeSH terms

Substances