. 2021 Oct;53(10):1434-1442.
doi: 10.1038/s41588-021-00930-y. Epub 2021 Sep 30.

Increased somatic mutation burdens in normal human cells due to defective DNA polymerases

Affiliations

Increased somatic mutation burdens in normal human cells due to defective DNA polymerases

Philip S Robinson et al. Nat Genet. 2021 Oct.

Abstract

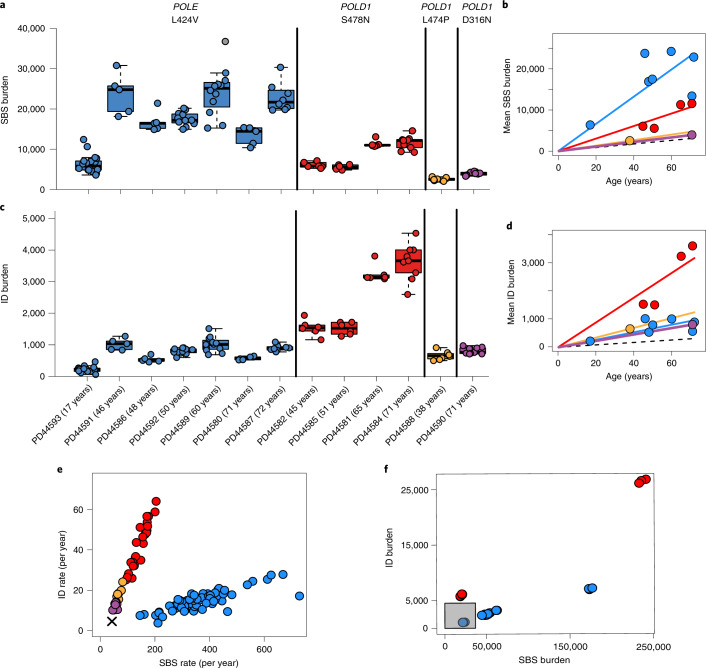
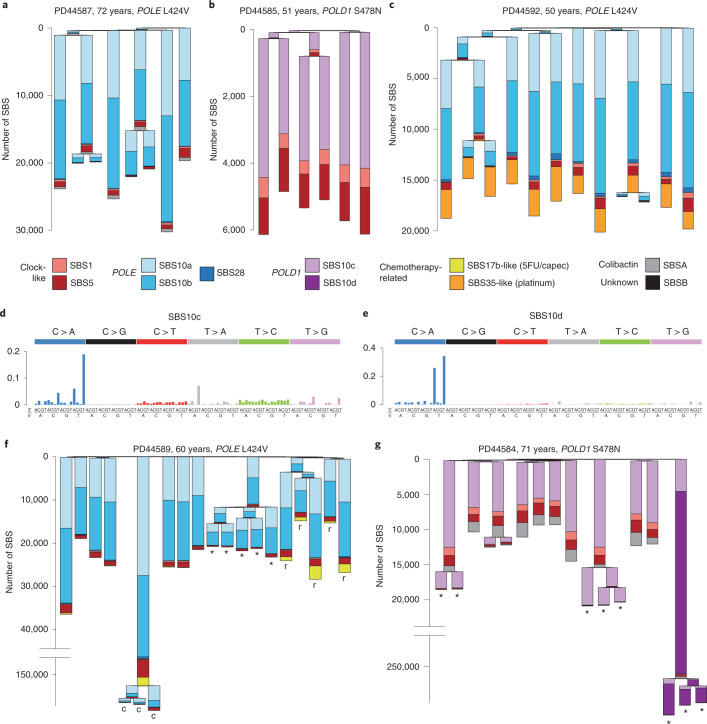
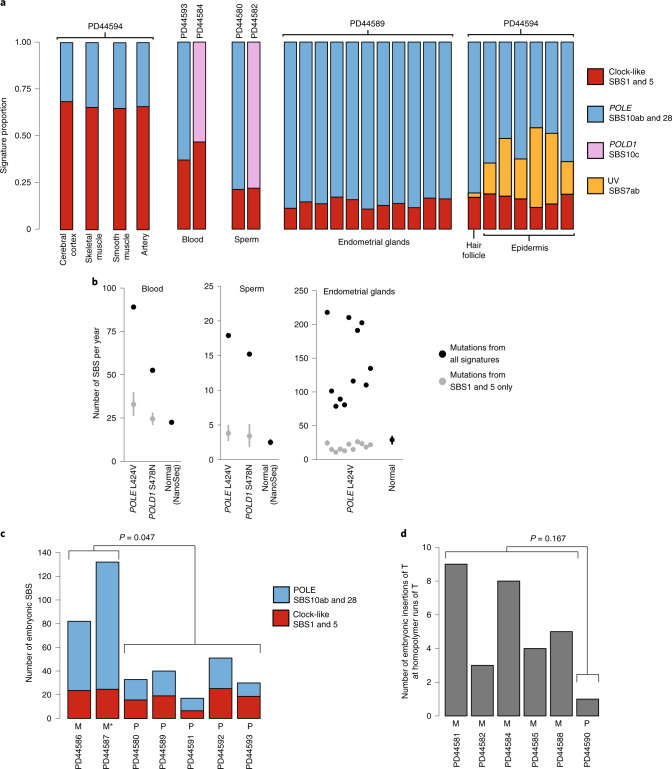
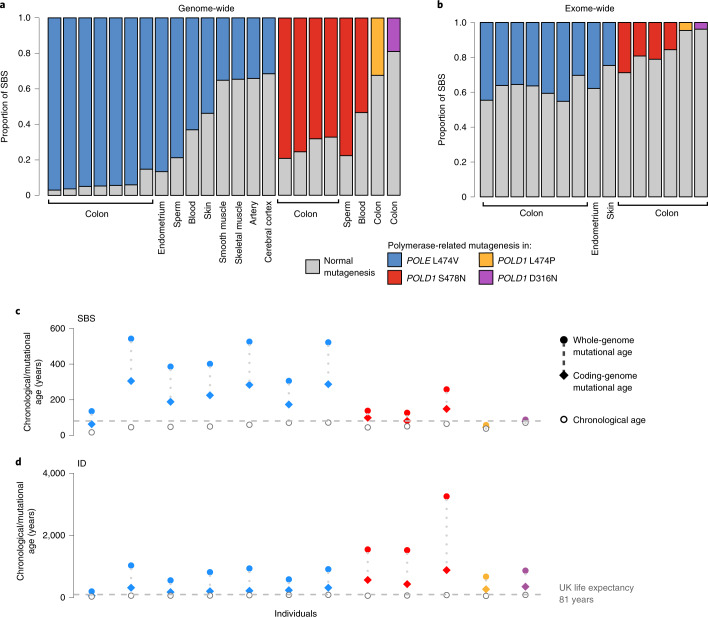
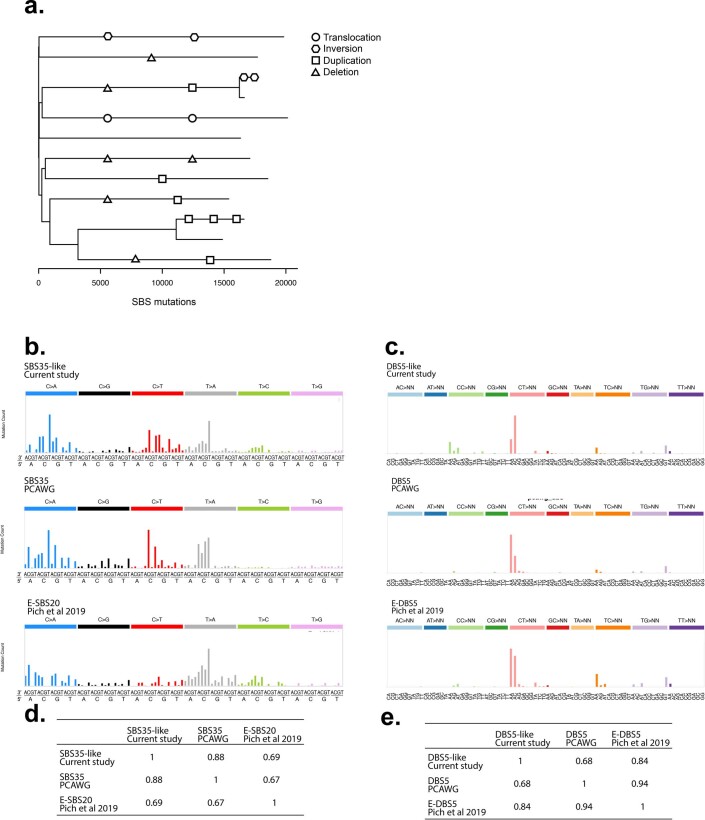
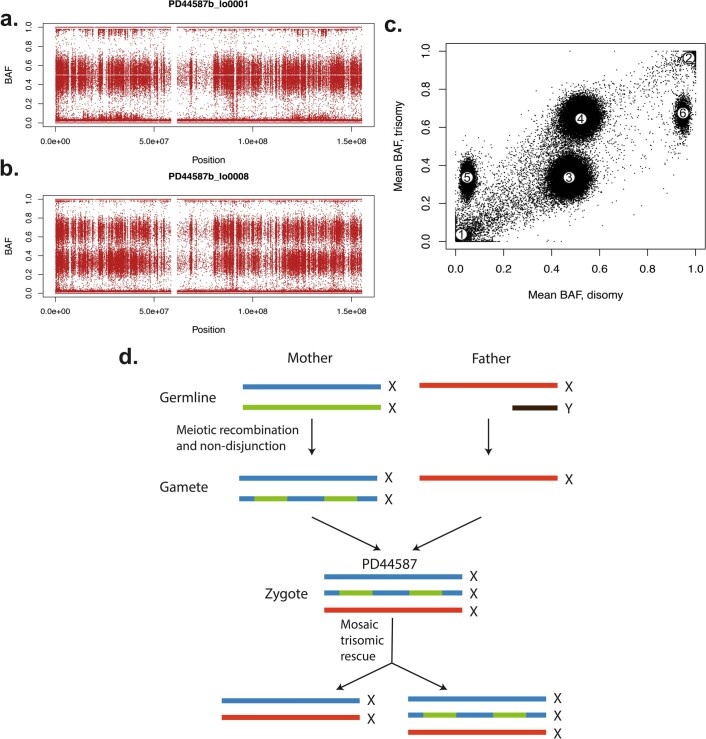
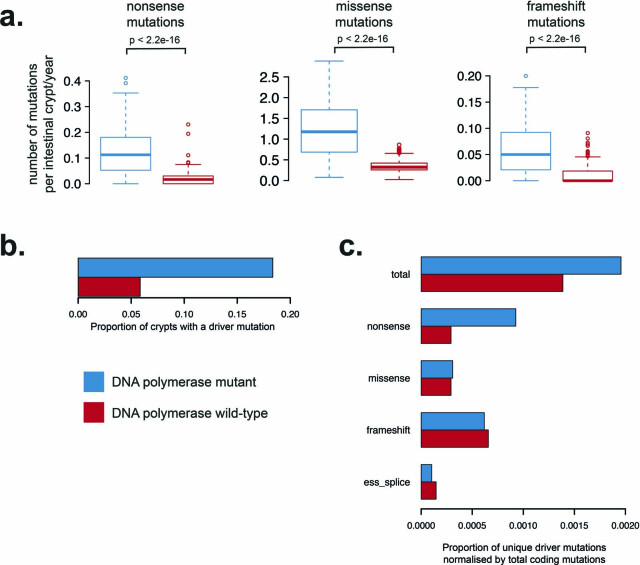
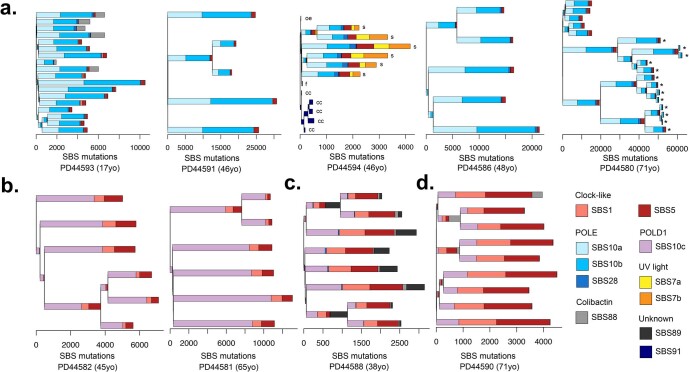
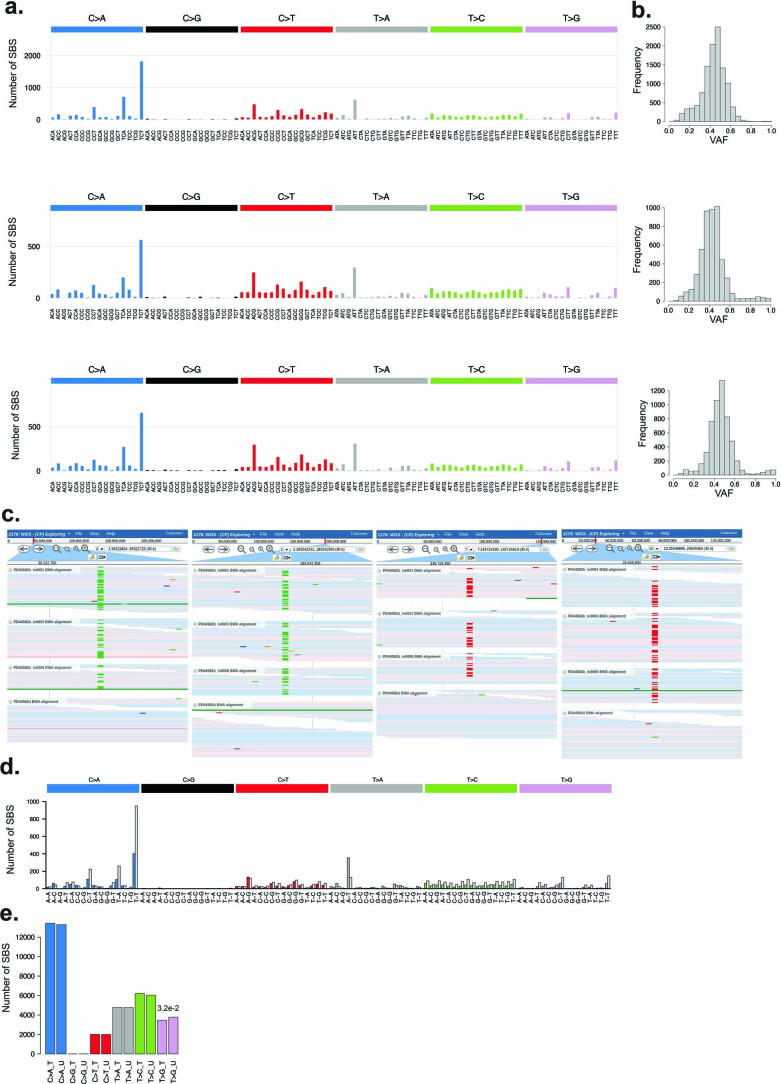
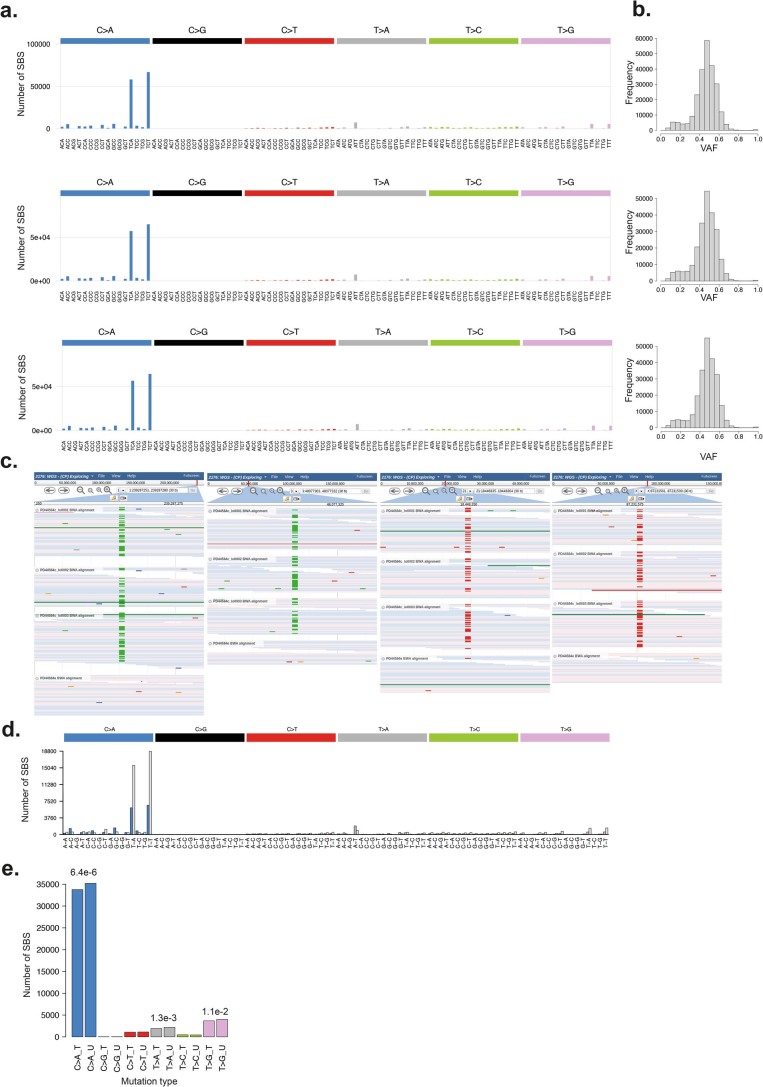
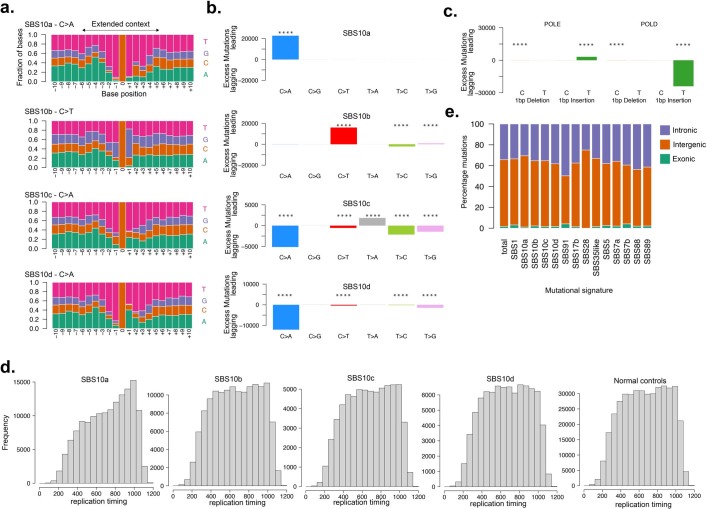
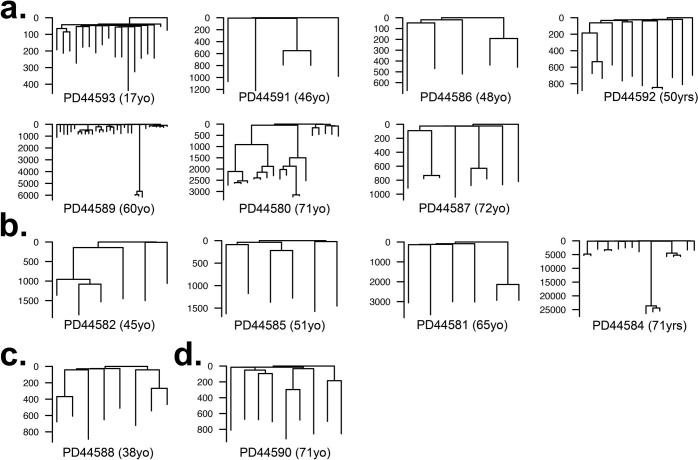
Mutation accumulation in somatic cells contributes to cancer development and is proposed as a cause of aging. DNA polymerases Pol ε and Pol δ replicate DNA during cell division. However, in some cancers, defective proofreading due to acquired POLE/POLD1 exonuclease domain mutations causes markedly elevated somatic mutation burdens with distinctive mutational signatures. Germline POLE/POLD1 mutations cause familial cancer predisposition. Here, we sequenced normal tissue and tumor DNA from individuals with germline POLE/POLD1 mutations. Increased mutation burdens with characteristic mutational signatures were found in normal adult somatic cell types, during early embryogenesis and in sperm. Thus human physiology can tolerate ubiquitously elevated mutation burdens. Except for increased cancer risk, individuals with germline POLE/POLD1 mutations do not exhibit overt features of premature aging. These results do not support a model in which all features of aging are attributable to widespread cell malfunction directly resulting from somatic mutation burdens accrued during life.


Conflict of interest statement

P.J.C. is a founder, consultant and stockholder of Mu Genomics Ltd. The other authors declare no competing interests.

Figures

Fig. 1
Fig. 1. SBS and ID burdens in normal and neoplastic intestinal crypts from individuals with germline POLE or POLD1 mutations.
a, Genome-wide mutation burden per individual, with the specific germline mutation indicated at the top and color coded (blue, red, green and purple denote POLE L424V, POLD1 S478N, POLD1 L474P and POLD1 D316N, respectively). For box-and-whisker plots, the central line, box and whiskers represent the median, interquartile range (IQR) from first to third quartiles, and 1.5 × IQR, respectively. b, Mean SBS burden versus age, showing regression lines for the four different germline mutations. The relationship between age and SBS burden in normal individuals is denoted by the dashed line. c, Genome-wide ID burden per individual. d, Relationship between age and ID burden. e, ID rate (per year) versus SBS rate (per year); the cross indicates the SBS and ID rate in normal individuals. f, ID and SBS burden in adenomatous samples from individuals with POLE/POLD1 mutations. The gray box indicates the range of mutation burdens in normal intestinal crypts from individuals with POLE/POLD1 mutations.
Fig. 2
Fig. 2. Phylogenies of intestinal crypts with mutational signature annotation.
a,b, Phylogenies of microdissected intestinal crypts of PD44587 (POLE L424V) (a), exhibiting mainly SBS10a and SBS10b, and PD44585 (POLD1 S478N) (b), exhibiting SBS10c. SBS1 and SBS5, normal signatures of aging, are also present. Signature exposures are color coded as indicated below the trees. Branch lengths correspond to SBS mutation burdens. c, In addition to mutagenesis due to POLE L424V, PD44592 shows widespread mutagenesis resulting from exposure to a platinum-based chemotherapeutic agent (SBS35-like). d,e, Probability distributions of SBS10c (d) and SBS10d (e), two novel signatures associated with POLD1 mutagenesis. f, Phylogeny of PD44589 (POLE L424V) containing samples from driver-bearing adenomas (*) and a carcinoma (c). Note that the y axis is broken for scale, preserving the original signature proportions. This individual showed mutagenesis due to exposure to capecitabine (capec, SBS17b-like), which was localized to carcinoma samples and nearby normal rectum (marked with r). g, Phylogeny of PD44584 (POLD1 S478N), with driver-bearing adenomas (*). One particular polyp showed extensive hypermutation (note broken y axis), largely due to SBS10d. 5FU/capec, capecitabine and fluorouracil. 5FU, 5-fluorouracil; capec, capecitabine.
Fig. 3
Fig. 3. POLE and POLD1 mutagenesis in other tissues.
a, Signature contribution to mutational landscapes of various tissues in individuals with a POLE L424V (PD44594, PD44593, PD44580, PD44589) or POLD1 S478N (PD44584, PD44582) germline mutation. Normal cerebral cortex, skeletal muscle, smooth muscle, artery, blood and sperm were sequenced using a modified duplex sequencing protocol, while other tissues were subjected to low-input WGS after laser-capture microdissection. Groups of mutational signatures are color coded as indicated. b, Estimated genome-wide total mutation rate per year for blood, sperm and endometrium (black dots), as well as yearly mutation burden due to SBS1 and SBS5 (gray dots with 95% CI). Mutation rates of normal controls for blood, sperm and endometrium are displayed for reference. c, Early embryonic SBS in individuals with a POLE L424V germline mutation, with a contribution from POLE signatures (blue, SBS10a, SBS10b and SBS28) and normal signatures (red, SBS1 and SBS5). M indicates that the mutation was inherited maternally, P paternally; M* indicates presumed maternal inheritance based on pedigree. P value is the result of a two-sided Wilcoxon rank-sum test on total counts of mutations attributed to SBS10a, SBS10b and SBS28. d, Early embryonic insertions of T at homopolymers of T (indicative of POLD1 mutagenesis) in individuals with POLD1 germline mutations (S478N: PD44581, PD44582, PD44584, PD44585; L474P: PD44588; D316N: PD44590). Again, P and M indicate paternal and maternal inheritance, respectively. P value is the result of a two-sided Wilcoxon rank-sum test on total counts.
Fig. 4
Fig. 4. Genome- and coding-sequence-wide increase in mutation burdens.
a, Genome-wide proportion of mutations due to POLE and POLD1 germline mutations across various normal tissues. Colored bars indicate mutagenesis due to POLE (SBS10a, SBS10b, SBS28) or POLD1 (SBS10c, SBS28) mutational signatures, with normal signatures in gray (SBS1, SBS5 and, for skin, SBS7a and SBS7b). b, Protein-coding exome proportion of mutations due to POLE and POLD1 germline mutations across various normal tissues, showing a much lower increase in polymerase-related mutational signatures (Wilcoxon signed-rank test P = 6.1 × 10−5). c,d, Mutational and chronological ages of histologically normal intestinal crypts per individual. Mutational ages are calculated based on the expected rate of mutation accumulation in wild-type intestinal crypts, enabling the calculation of both SBS and ID mutational age. Plots show SBS (c) and ID (d) mutational ages across the whole genome (filled dots) and coding genome (filled diamonds). Germline mutation is color coded: blue, red, green and purple denote POLE L424V, POLD1 S478N, POLD1 L474P and POLD1 D316N, respectively. Individuals’ chronological ages are indicated by unfilled circles, and UK life expectancy is displayed as a dashed horizontal line.
Extended Data Fig. 1
Extended Data Fig. 1. Mutational signatures and structural variants in normal tissue from an individual exposed to oxaliplatin chemotherapy.
Mutational signatures identified in normal intestinal crypts from individual PD44592 who had previously undergone treatment with oxaliplatin. Distinctive SBS and DBS signatures were observed that have previously been associated with oxaliplatin treatment in cancer samples. Unexpectedly high numbers of structural variants were also observed in the normal intestinal crypts from this individual and may be due to chemotherapy exposure. (a) Phylogenetic tree from individual PD44592 with structural variants (SVs) mapped to branches. Shapes correspond to SV type; translocation (circle), inversion (hexagon), large duplication (square) and deletion (triangle). Ordering of SVs and positioning along branches is arbitrary (b) SBS signature SBS35-like displayed above the Pan-Cancer Analysis of Whole Genomes (PCAWG) reference signature SBS35 (PCAWG) and E-SBS20 (c) Doublet Base Substitution (DBS) signature displayed above PCAWG reference signature DBS5 and E-DBS5 from Pich et al 2019. (d-e) Cosine similarity matrices for SBS and DBS signatures.
Extended Data Fig. 2
Extended Data Fig. 2. Trisomy X (47XXX) with mosaic trisomic rescue in individual PD44587 identified by lineage tracing of somatic mutations.
B-allele frequencies (BAF) of SNP sites for intestinal crypts with two copies of the X-chromosome (a) or three (b). Seven crypts exhibited the disomy, whereas one crypt and the majority of blood showed the trisomy. (c) The mean BAF of SNPs for samples with a disomic profile versus those with a trisomic profile. SNPs clustered in six distinct groups: those absent from all samples (marked with ‘1’), homozygously present across all samples (2), heterozygous in disomy but in one out of three copies in trisomy (3), heterozygous in disomy but on two copies in trisomy (4), absent from disomy but on one copy in trisomy (5) or homozygous in disomy but on two copies in trisomy (6). The last two clusters are inconsistent with an acquired gain of chromosome X, as they constitute bringing in novel germline SNPs or omission of those previously homozygotic. (d) Therefore, this profile can only be explained by a zygote which possessed three copies of X, one of which was mosaically lost in the crypt lineage.
Extended Data Fig. 3
Extended Data Fig. 3. Protein coding mutations due to mutational signatures of defective DNA polymerases.
(a) Mutation burden per intestinal crypt per year of life. For box and whisker plots, the central line, box and whiskers represent the median, inter-quartile range (IQR) from 1st to 3rd quartiles and 1.5 times the IQR. Elevated burdens of nonsense, missense and frameshift mutations are observed in crypts due to DNA polymerase associated mutational signatures. P-values result from two-sided Wilcoxon rank sum test. (b) Comparison of driver mutation burden of normal crypts from individuals with a germline DNA polymerase mutation (blue) and wild-type crypts (red). SBS mutations included are from n = 445 wild-type intestinal crypts and n = 109 DNA polymerase mutant crypts from the current cohort. (c) Comparison of driver mutations normalised by the total number of protein coding mutations. Normalised proportion of driver mutations is displayed on the x-axis. No statistically significant difference in the driver mutation burden between DNA polymerase mutant and DNA polymerase wild-type crypts is observed (Chi-squared test p > 0.05).
Extended Data Fig. 4
Extended Data Fig. 4. Phylogenetic trees constructed from somatic single base substitution (SBS) mutations annotated with mutational signature exposure.
Phylogenetic trees generated from normal and neoplastic crypts displayed per individual. Mutational signature exposure per branch is displayed as stacked bar plots. Ordering of mutational signatures within branches is arbitrary. SBS burden is displayed on the x-axis. Each tip represents a normal intestinal crypt unless otherwise indicated microbiopsies from; ‘s’ skin, ‘cc’ cerebral cortex, ‘oe’ oesophagus, ‘f’ hair follicle and ‘*’ indicates adenomatous crypts. Trees are grouped according to germline DNA polymerase mutation; (a) POLE L424V, (b) POLD1 S478N, (c) POLD1 L474P and (d) POLD1 D316N.
Extended Data Fig. 5
Extended Data Fig. 5. Characterisation of mutational signature SBS10c.
(a) SBS mutational profiles for representative samples (PD44581b_lo0001, PD44585b_lo0009 and PD44582b_lo0001). (b) Histograms of Variant Allele Fraction (VAF) for SBS mutations in each sample. (c) JBrowse images showing SBS10c mutations validated across multiple samples. Matched normal samples are displayed at the bottom of each image (d) Mutational profile showing replication strand bias of SBS10c mutations from a representative sample. Coloured bars indicate the mutation count on the leading strand and light grey bars indicate the lagging strand. (e) Barplot of SBS mutations assigned to SBS10c on the transcribed (T) and un-transcribed (U) strands, p-values were calculated for each mutation type using a two-sided Poisson test, statistically significant p-values are displayed.
Extended Data Fig. 6
Extended Data Fig. 6. Characterisation of mutational signature SBS10d.
(a) SBS mutational profiles for samples (PD44584c_lo0001, PD44584c_lo0002 and PD44584c_lo0003). (b) Histograms of Variant Allele Fraction (VAF) for SBS mutations in each sample. (c) JBrowse images showing clonal SBS10d mutations validated across multiple samples. (d) Mutational profile showing replication strand bias of SBS10d mutations from a representative sample. Coloured bars indicate leading strand and light grey bars indicate lagging strand. (e) Barplot of SBS mutations assigned to SBS10d on the transcribed (T) and un-transcribed (U) strands, p-values were calculated for each mutation type using a two-sided Poisson test, statistically significant p-values are displayed.
Extended Data Fig. 7
Extended Data Fig. 7. Characterisation of replication strand bias and extended sequence context of mutational signatures associated with germline DNA polymerase mutations.
(a) Extended sequence context of mutations assigned to signatures SBS10a, SBS10b, SBS10c and SBS10d displayed with pyrimidine annotation. Plots show extended sequence context of C > A and C > T mutations in SBS10a and SBS10b respectively and C > A mutations in SBS10c and SBS10d. (b) Replication strand biases of SBS mutations indicated by excess mutations (annotated by pyrimidine base) on either the leading or lagging DNA strand. Biases are displayed according to mutations assigned to known signatures SBS10a and SBS10b and new signatures SBS10c and SBS10d. Only SBS mutations with an assignment probability >0.7 were included (Supplementary Methods). Strong replicative strand asymmetries are seen in known (SBS10a & SBS10b) signatures as well as new signatures; SBS10c and SBS10d. P-values were calculated using two-sided Poisson tests and corrected for multiple testing using the Benjamini-Hochberg method. Mutation types with statistically significant replication strand bias (adjusted p < 0.0001) are annotated with ‘****’. (c) ID replication strand asymmetries are displayed for single base insertions and deletions according to the affected polymerase gene; POLE (left) POLD1 (right). Replication strand bias is indicated by excess mutations with single base insertions on the leading strand in POLE mutant cells and on the lagging strand in POLD1 mutant cells. (d) Frequency of somatic SBS mutations assigned to each mutational signature SBS10a-d in replication timing bins. (e) Distribution of SBS mutations across different genomic regions; exonic, intronic and intergenic.
Extended Data Fig. 8
Extended Data Fig. 8. Phylogenetic trees constructed from somatic insertion and deletion (ID) mutations from normal and neoplastic intestinal stem cells.
Phylogenetic trees generated from ID mutations. ID mutation burden is displayed on the y-axis. Each tree represents samples from a single individual. Trees are grouped according to germline DNA polymerase mutation (a) POLE L424V (b) POLD1 S478N (c) POLD1 L474P (d) POLD1 D316N.
Extended Data Fig. 9
Extended Data Fig. 9. Driver mutation landscape in normal tissues from individuals with POLE and POLD1 germline mutations.
Driver mutations in tissues from individuals with germline DNA polymerase mutations. (a) Trinucleotide mutational spectrum of SBS driver mutations from normal and neoplastic cells showing characteristic peaks associated with DNA polymerase mutational signatures. (b) ID mutation spectrum showing ID type of driver mutations are associated with ID1 mutational signature. (c) Frequency of SBS driver mutations from normal and neoplastic cells according to their assigned mutational signature. (d) Cancer driver mutations (top 10) identified in histologically normal intestinal crypts displayed in order of frequency, mutation class is indicated by the colour. (e) Phylogenetic tree of SBS mutations from endometrial glands from individual PD44589. SBS driver mutations are plotted on the tree, ordering of the drivers within each branch is arbitrary. Driver mutation class is represented by the symbol: nonsense mutations (circles) missense (squares). Gene name and protein change are displayed above each symbol.

References

    1. Morrison A, Araki H, Clark AB, Hamatake RK, Sugino A. A third essential DNA polymerase in S. cerevisiae. Cell. 1990;62:1143–1151. doi: 10.1016/0092-8674(90)90391-Q. - DOI - PubMed
    1. Pursell ZF, Isoz I, Lundstrom EB, Johansson E, Kunkel TA. Yeast DNA polymerase epsilon participates in leading-strand DNA replication. Science. 2007;317:127–130. doi: 10.1126/science.1144067. - DOI - PMC - PubMed
    1. Simon M, Giot L, Faye G. The 3′ to 5′ exonuclease activity located in the DNA polymerase delta subunit of Saccharomyces cerevisiae is required for accurate replication. EMBO J. 1991;10:2165–2170. doi: 10.1002/j.1460-2075.1991.tb07751.x. - DOI - PMC - PubMed
    1. Morrison A, Johnson AL, Johnston LH, Sugino A. Pathway correcting DNA replication errors in Saccharomyces cerevisiae. EMBO J. 1993;12:1467–1473. doi: 10.1002/j.1460-2075.1993.tb05790.x. - DOI - PMC - PubMed
    1. Morrison A, Sugino A. The 3′ → 5′ exonucleases of both DNA polymerases δ and ε participate in correcting errors of DNA replication in Saccharomyces cerevisiae. MGG Mol. Gen. Genet. 1994;242:289–296. doi: 10.1007/BF00280418. - DOI - PubMed

Publication types