. 2021 Oct;53(10):1405-1414.
doi: 10.1038/s41588-021-00936-6. Epub 2021 Sep 30.

The first wave of the COVID-19 epidemic in Spain was associated with early introductions and fast spread of a dominating genetic variant

Mariana G López #  1 Álvaro Chiner-Oms #  1 Darío García de Viedma  2   3   4 Paula Ruiz-Rodriguez  5 Maria Alma Bracho  6   7 Irving Cancino-Muñoz  1 Giuseppe D'Auria  7   8 Griselda de Marco  8 Neris García-González  6 Galo Adrian Goig  9 Inmaculada Gómez-Navarro  1 Santiago Jiménez-Serrano  1 Llúcia Martinez-Priego  8 Paula Ruiz-Hueso  8 Lidia Ruiz-Roldán  6 Manuela Torres-Puente  1 Juan Alberola  10   11   12 Eliseo Albert  13 Maitane Aranzamendi Zaldumbide  14   15 María Pilar Bea-Escudero  16 Jose Antonio Boga  17   18 Antoni E Bordoy  19 Andrés Canut-Blasco  20 Ana Carvajal  21 Gustavo Cilla Eguiluz  22 Maria Luz Cordón Rodríguez  20 José J Costa-Alcalde  23 María de Toro  16 Inmaculada de Toro Peinado  24 Jose Luis Del Pozo  25 Sebastián Duchêne  26 Jovita Fernández-Pinero  27 Begoña Fuster Escrivá  12   28 Concepción Gimeno Cardona  28 Verónica González Galán  29 Nieves Gonzalo Jiménez  30 Silvia Hernáez Crespo  20 Marta Herranz  2   3   4 José Antonio Lepe  29 Carla López-Causapé  31 José Luis López-Hontangas  32 Vicente Martín  7   33 Elisa Martró  7   19 Ana Milagro Beamonte  34 Milagrosa Montes Ros  22 Rosario Moreno-Muñoz  35 David Navarro  12   13 José María Navarro-Marí  36   37 Anna Not  19 Antonio Oliver  31   38 Begoña Palop-Borrás  24 Mónica Parra Grande  39 Irene Pedrosa-Corral  36   37 Maria Carmen Pérez González  40 Laura Pérez-Lago  2   3 Mercedes Pérez-Ruiz  24 Luis Piñeiro Vázquez  22 Nuria Rabella  41   42   43 Antonio Rezusta  34   44   45 Lorena Robles Fonseca  46 Ángel Rodríguez-Villodres  29 Sara Sanbonmatsu-Gámez  36   37 Jon Sicilia  2   3 Alex Soriano  47 María Dolores Tirado Balaguer  35 Ignacio Torres  13 Alexander Tristancho  34   44 José María Marimón  22 SeqCOVID-Spain consortiumMireia Coscolla  48 Fernando González-Candelas  49   50 Iñaki Comas  51   52
Collaborators, Affiliations

The first wave of the COVID-19 epidemic in Spain was associated with early introductions and fast spread of a dominating genetic variant

Mariana G López et al. Nat Genet. 2021 Oct.

Abstract

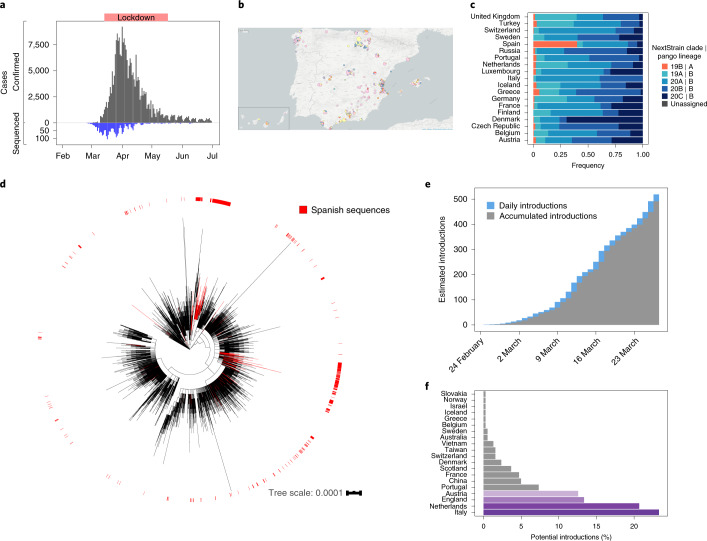
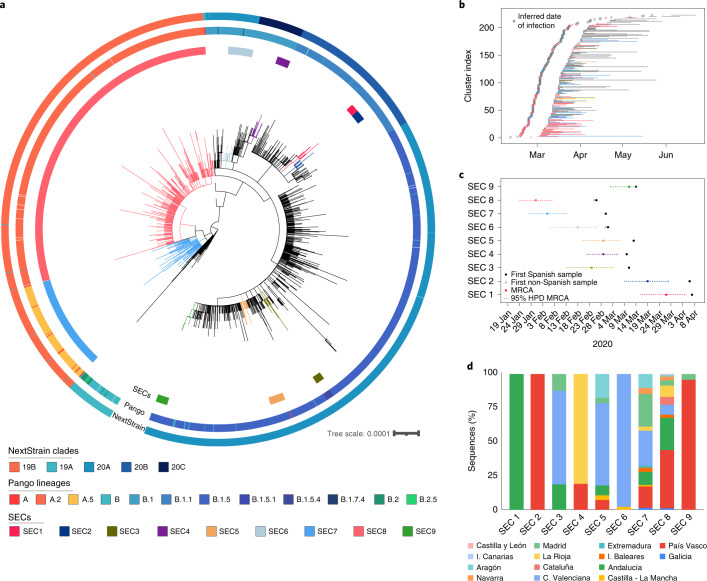
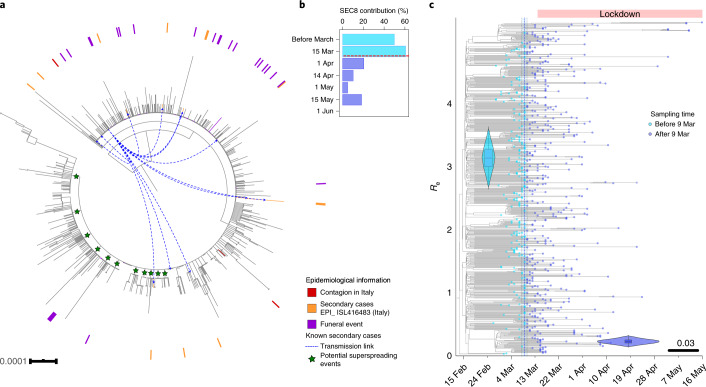
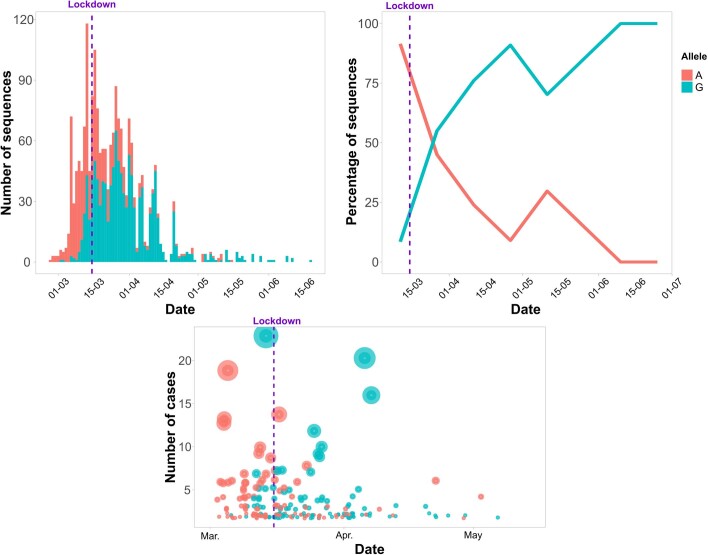
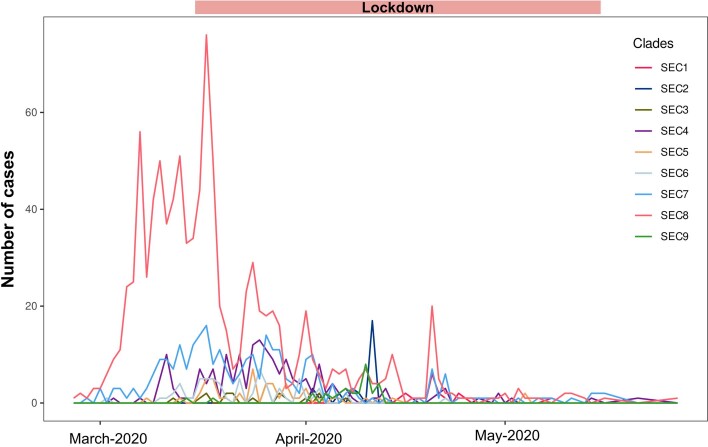
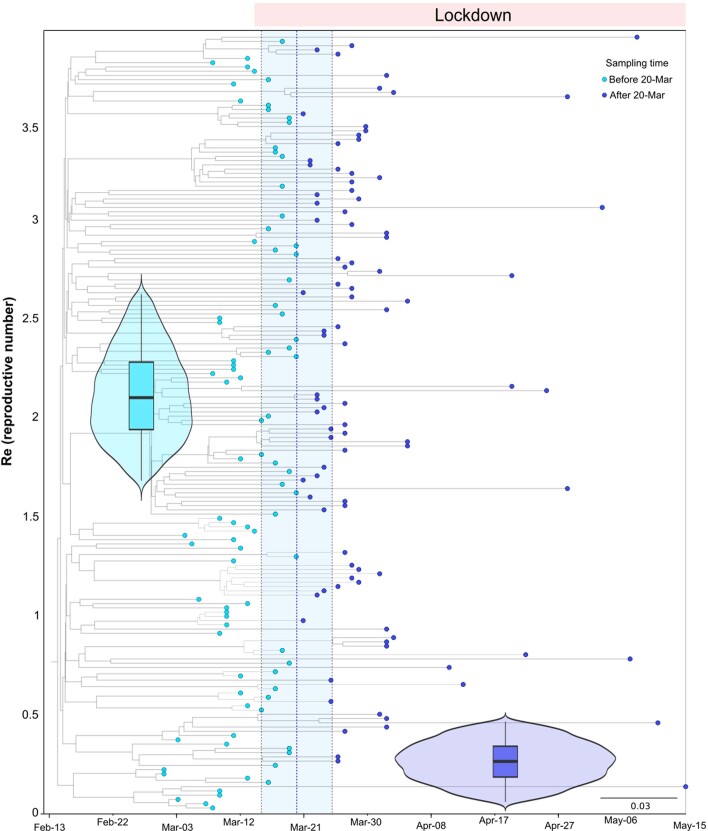
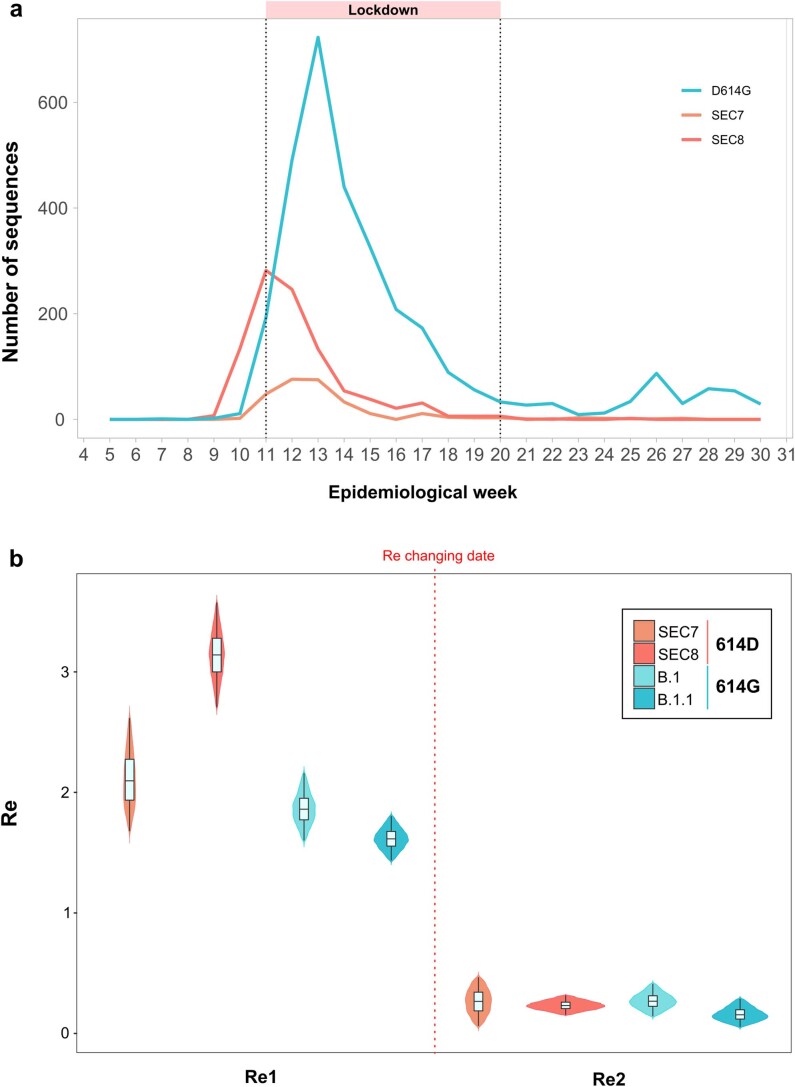
The coronavirus disease 2019 (COVID-19) pandemic has affected the world radically since 2020. Spain was one of the European countries with the highest incidence during the first wave. As a part of a consortium to monitor and study the evolution of the epidemic, we sequenced 2,170 samples, diagnosed mostly before lockdown measures. Here, we identified at least 500 introductions from multiple international sources and documented the early rise of two dominant Spanish epidemic clades (SECs), probably amplified by superspreading events. Both SECs were related closely to the initial Asian variants of SARS-CoV-2 and spread widely across Spain. We inferred a substantial reduction in the effective reproductive number of both SECs due to public-health interventions (Re < 1), also reflected in the replacement of SECs by a new variant over the summer of 2020. In summary, we reveal a notable difference in the initial genetic makeup of SARS-CoV-2 in Spain compared with other European countries and show evidence to support the effectiveness of lockdown measures in controlling virus spread, even for the most successful genetic variants.


Conflict of interest statement

The authors declare no competing interests.

Figures

Fig. 1
Fig. 1. SARS-CoV-2 genomes sequenced from Spain.
a, Distribution of sequenced samples (blue) versus confirmed cases in Spain (gray) by date. Country lockdown measures were in effect from 14 March to 14 May 2020. b, Distribution of the sequenced samples across Spain plotted in Microreact. These data can be explored with more detail in the Microreact webpage (https://microreact.org/showcase) loading the Supplementary Data 1 files. The size of each piechart correlates with the number of sequences collected in the corresponding area. Each color corresponds to a specific Pango lineage, as detailed in Extended Data Fig. 1 (light yellow and green correspond to lineage A, all the others are lineage B). The map image was extracted from the Microreact visualization. c, Distribution of main SARS-CoV-2 clades during the first stages of the pandemic (before 1 April 2020), in those European countries with more than 50 sequences deposited in GISAID as of 13 November 2020. d, Global ML phylogeny constructed with 32,416 sequences, placement of Spanish samples is indicated in red. e, New and accumulated introductions to Spain. Lower-bound introduction estimates were defined as the probable date of the infection of the first case in a cluster (14 days before symptom onset). f, Estimated international origin of SARS-CoV-2 introductions based on phylogenetic data; in color, those countries with a probable contribution greater than 10%.
Fig. 2
Fig. 2. Inferred introduction times and expansion of SECs.
a, ML phylogenetic tree of Spanish sequences indicating the identified SECs (inner circle), the Pango lineage (middle circle) and the NextStrain clade (outer circle). b, Range of dates for each ‘candidate transmission cluster’ identified within the SECs, and the most probable origin date (14 days before the first documented case). c, Time of the MRCA of each SEC is plotted, including the 95% HPD interval. First collected sample, and whether it is Spanish or non-Spanish, is indicated. d, SEC dispersion through the different regions of the country. Some SECs are restricted to one or two regions, while others have expanded through the complete territory.
Fig. 3
Fig. 3. SEC8 epidemiological success and impact of mobility restrictions.
a, ML phylogeny with all strains of SEC8. Samples with epidemiological evidence about their origin are marked in the tree. In red, cases imported from different events in Italy. In orange, secondary cases originated from one of the cases introduced from Italy (also marked with blue arrows). In purple, cases related to a large funeral in La Rioja. Green stars mark potential superspreading events of more than ten sequences sharing at least one clade-defining SNP. b, Contribution of SEC8 to the total of samples sequenced over time. The horizontal red line marks the start of the Spanish lockdown on 14 March 2020. c, Phylodynamic estimates of the reproductive number (Re) of SEC8. The x axis represents time, from the origin of the sampled diversity of SEC8 to the date of the last collected genome on 16 May 2020. The blue dotted line shows the posterior value of the timing of the most important change in Re, around 9 March 2020 [95% HPD: 8–10 March]. The y axis represents Re, and the violin plots show the posterior distribution of this parameter before and after the change time in Re, with a mean of 3.14 [95% HPD: 2.71–3.57] and 0.23 [95% HPD: 0.15–0.32] before and after the change time, respectively. The phylogenetic tree in the background is a maximum clade credibility tree with the tips colored according to whether they were sampled before or after 9 March 2020. The lower whisker, higher whisker, center and bounds of each boxplot refers to quartile 1–1.5 interquartile range, quartile 3 + 1.5 interquartile range, mean, first and third quartiles of the data. Individual points are outliers (values lower than quartile 1–1.5 interquartile range and higher than quartile 3 + 1.5 interquartile range). Boxplot was constructed with all the Spanish sequences in SEC8 (N = 636).
Extended Data Fig. 1
Extended Data Fig. 1. Abundance of the different Pango lineages in the dataset.
In the x-axis, the epidemiological week as plotted in Microreact.
Extended Data Fig. 2
Extended Data Fig. 2. Examples of the different groups of sequences identified.
‘Candidate transmission clusters’ are groups of Spanish sequences that form a clade. ‘Zero distance clusters’ are groups of Spanish sequences that are at zero distance from each other. Finally, the ‘unique’ sequences are Spanish sequences that are more than 1 SNP away from any other Spanish sequence and that do not share a most recent common ancestor (MRCA) node with other Spanish sequences.
Extended Data Fig. 3
Number of international and Spanish sequences in each SEC.
Extended Data Fig. 4
Extended Data Fig. 4. Phylogenetic location of each SEC in the global SARS-CoV-2 phylogeny.
Sequences from Spain are colored according to their SEC color (as indicated in Fig. 2a legend) while international sequences remain in black color.
Extended Data Fig. 5
Extended Data Fig. 5. Distribution of genetic (salmon) versus geographic (gray) distances within each pair of samples belonging to the same SEC.
For each SEC we had the following comparisons (data points): SEC1 (N = 120), SEC2 (N = 190), SEC3 (N = 91), SEC4 (N = 325), SEC5 (N = 378), SEC6 (N = 990), SEC7 (N = 14,028), SEC8 (N = 178,503) and SEC9 (N = 231). The lower whisker, higher whisker, center and bounds of each boxplot refers to quartile 1–1.5 interquartile range, quartile 3 + 1.5 interquartile range, mean, first and third quartiles of the data. Individual points are outliers (values lower than quartile 1–1.5 interquartile range and higher than quartile 3 + 1.5 interquartile range).
Extended Data Fig. 6
Extended Data Fig. 6. Distribution of sequences harboring the 614 G mutation (blue) versus the 614D mutation (salmon,wild-type) in the S gene for the spanish sequences in our dataset.
In the left panel, a histogram of samples sorted by date of sequencing. At right, frequency of both mutations in the sequenced samples by date. The national lockdown event is marked by a purple vertical line. At the bottom, ‘candidate transmission clusters’ by date and size, colored according to the allele found at the 614 position of the S gene.
Extended Data Fig. 7
Extended Data Fig. 7. Cases sequenced during the period that includes the first wave until the end of the lockdown (14th May, 2020).
Lines represent the number of cases belonging to different Spanish Epidemic Clades (SECs).
Extended Data Fig. 8
Extended Data Fig. 8. Phylodynamic estimates of the effective reproductive number (Re) of Spanish SEC7.
A birth–death skyline (BDSKY) model was implemented in Beast v.2, allowing for piecewise changes in Re, with the time and magnitude estimated from the data. The X axis represents time, starting with the MRCA of all sampled diversity within SEC7 and ending with the date of the most recently sequenced genome from 15th May. The blue dotted line indicates the posterior value of the timing of a most important decrease in Re, around 20th March 2020 [95% HPD: 15–25th March]. The Y axis represents Re, and the violin plots show the posterior probability distribution for this parameter before and after the change time in Re; with a mean of 2.10 [95% HPD: 1.67–2.62] and 0.27 [95% HPD:0.06–0.47] before and after this time, respectively. The phylogenetic tree in the background is the maximum clade credibility tree from the BDSKY analysis, with the tips colored according to whether they were sampled before or after 20th March. The lower whisker, higher whisker, center and bounds of each boxplot refers to quartile 1–1.5 interquartile range, quartile 3 + 1.5 interquartile range, mean, first and third quartiles of the data. Individual points are outliers (values lower than quartile 1–1.5 interquartile range and higher than quartile 3 + 1.5 interquartile range). Boxplot was constructed with all the Spanish sequences in SEC7 (N = 182).
Extended Data Fig. 9
Extended Data Fig. 9. Comparison between strains carrying 614D and 614 G mutations.
a. Number of sequences belonging to SEC7, SEC8 (614D) and those having the 614 G allele. b. Phylodynamic estimates of the effective reproductive number (Re) of clades harboring 614D mutation (SEC7 and SEC8) and Pango lineages with 614 G mutation (B.1 and B1.1). A birth–death skyline (BDSKY) model was implemented in Beast v.2, allowing for piecewise changes in Re, with the time and magnitude estimated from the data. The violin plots show the posterior probability distribution (HPD) interval for Re parameter before (Re1) and after (Re2) the changing time estimates (dotted line). For SEC7, Re1: 2.10 [95% HPD: 1.67–2.62] and Re2: 0.27 [95% HPD:0.06–0.47]; changing time 20th March 2020 [95% HPD: 15–25th March]. For SEC8, Re1: 3.14 [95% HPD: 2.71–3.57] and Re2: 0.23 [95% HPD: 0.15–0.32]; changing time 9th March 2020 [95% HPD: 8–10th March]. For B.1, Re1: 1.86 [1.6–2.16] and Re2: 0.26 [0.14–0.41]; changing time 23rd March 2020 [95% HPD: 21–25th March]. For B.1.1, Re1: 1.62 [1.44–1.80] and Re2: 0.15 [0.05–0.29]; changing time 10th April 2020 [95% HPD: 9–12th April]. The lower whisker, higher whisker, center and bounds of each boxplot refers to quartile 1–1.5 interquartile range, quartile 3 + 1.5 interquartile range, mean, first and third quartiles of the data. Individual points are outliers (values lower than quartile 1–1.5 interquartile range and higher than quartile 3 + 1.5 interquartile range). Boxplots were constructed with all the Spanish sequences in SEC7 (N = 182), SEC8 (N = 636), B.1 (N = 191) and B.1.1 (N = 223).

References

    1. Zhu N, et al. Brief report: a novel coronavirus from patients with pneumonia in China, 2019. N. Engl. J. Med. 2020;382:727. doi: 10.1056/NEJMoa2001017. - DOI - PMC - PubMed
    1. Spiteri, G. et al. First cases of coronavirus disease 2019 (COVID-19) in the WHO European Region, 24 January to 21 February 2020. Eurosurveillance25, PMC7068164 (2020). - PMC - PubMed
    1. Centro de Coordinación de Alertas y Emergencias Sanitarias. Enfermedad por el coronavirus, situación en Españahttps://www.mscbs.gob.es/profesionales/saludPublica/ccayes/alertasActual... (2020).
    1. Pollán M, et al. Prevalence of SARS-CoV-2 in Spain (ENE-COVID): a nationwide, population-based seroepidemiological study. Lancet. 2020;396:535–544. doi: 10.1016/S0140-6736(20)31483-5. - DOI - PMC - PubMed
    1. Ministerio de la Presidencia, R. C. las C. y. M. D. BOE-A-2020-3692 https://www.boe.es/eli/es/rd/2020/03/14/463/con (2020).

Publication types