. 2021 Sep 1:15:662127.
doi: 10.3389/fnint.2021.662127. eCollection 2021.

Weak Vestibular Response in Persistent Developmental Stuttering

Affiliations

Weak Vestibular Response in Persistent Developmental Stuttering

Max Gattie et al. Front Integr Neurosci. .

Abstract

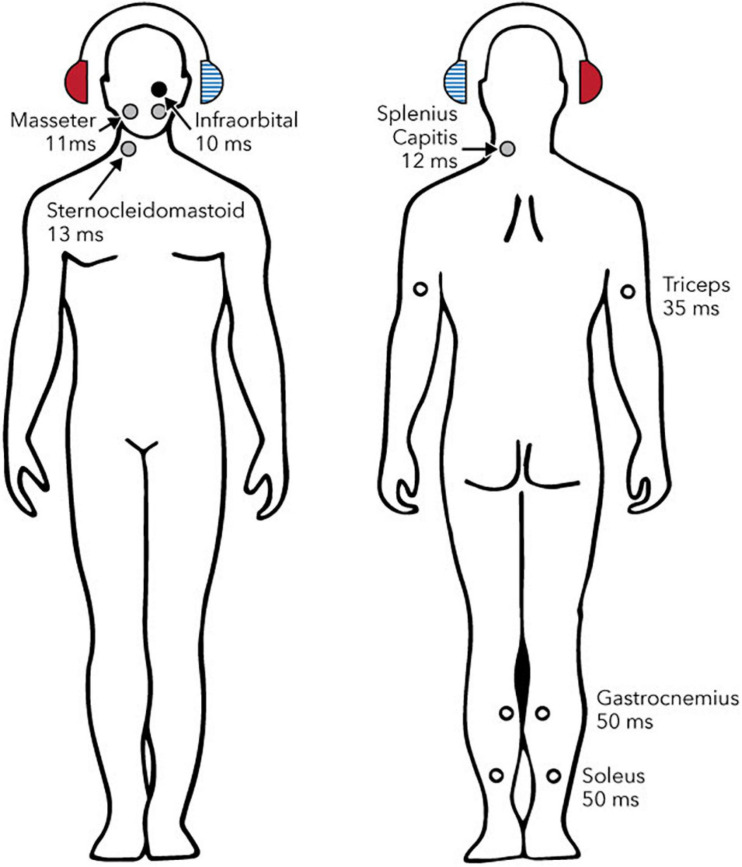
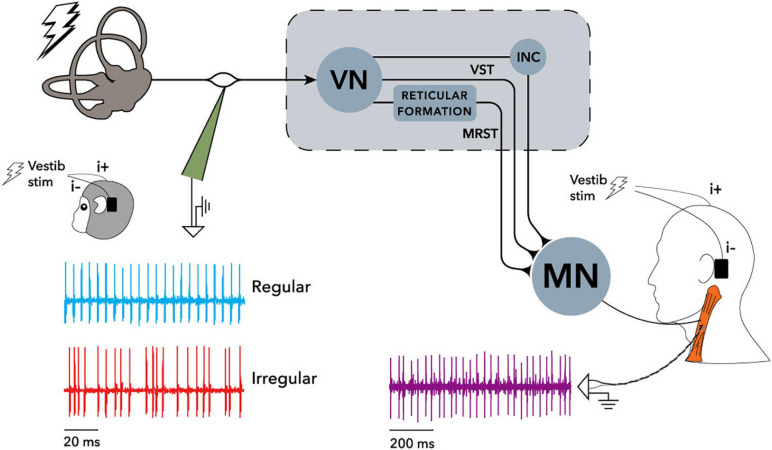
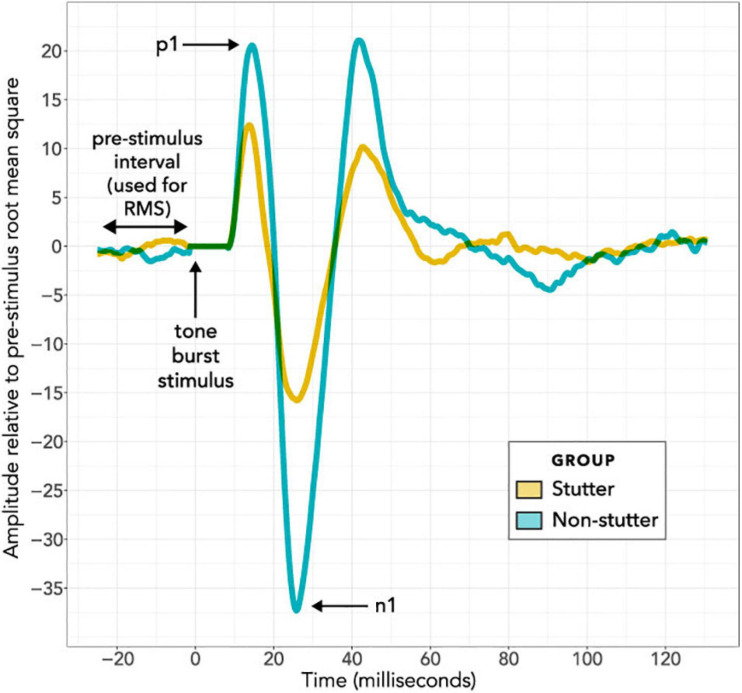
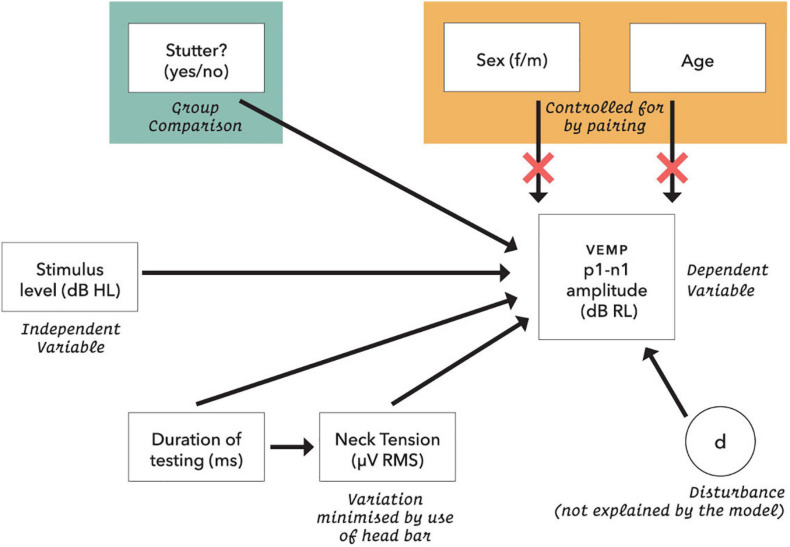
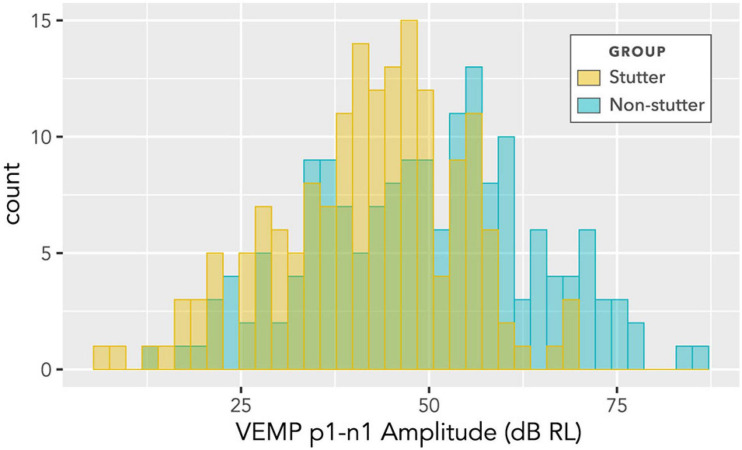
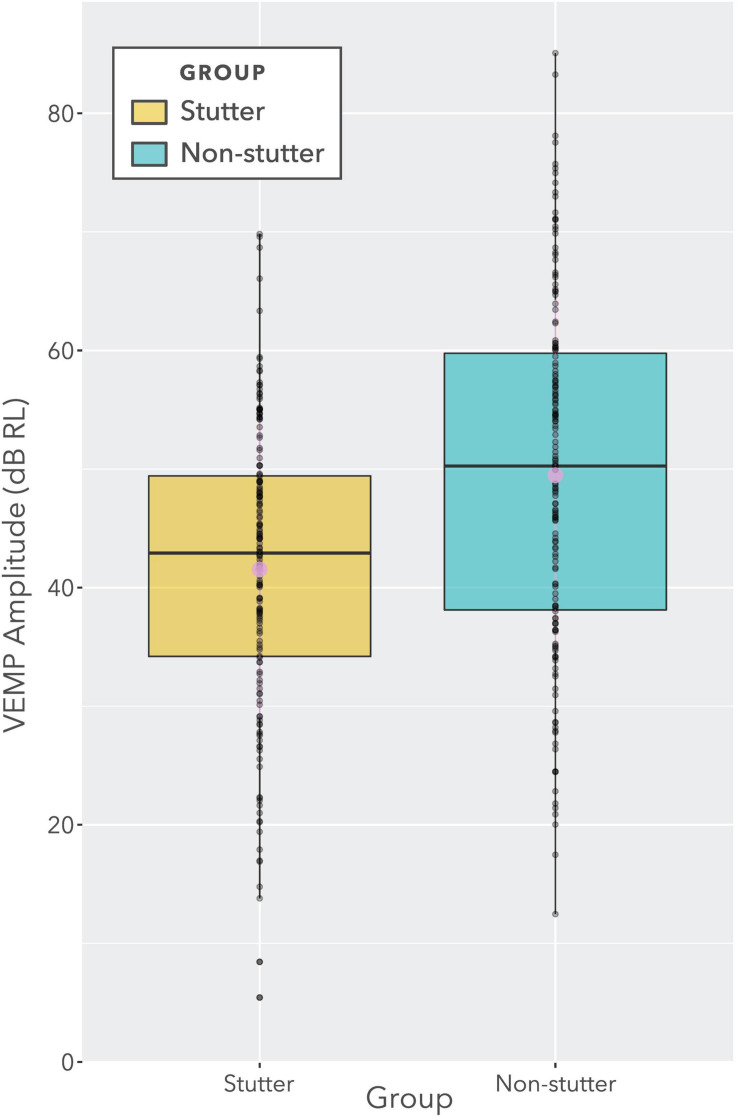
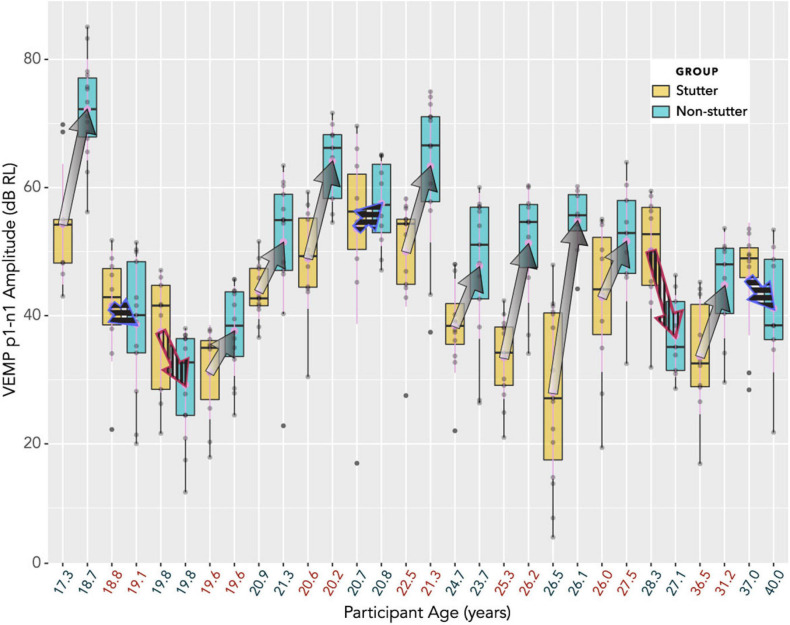
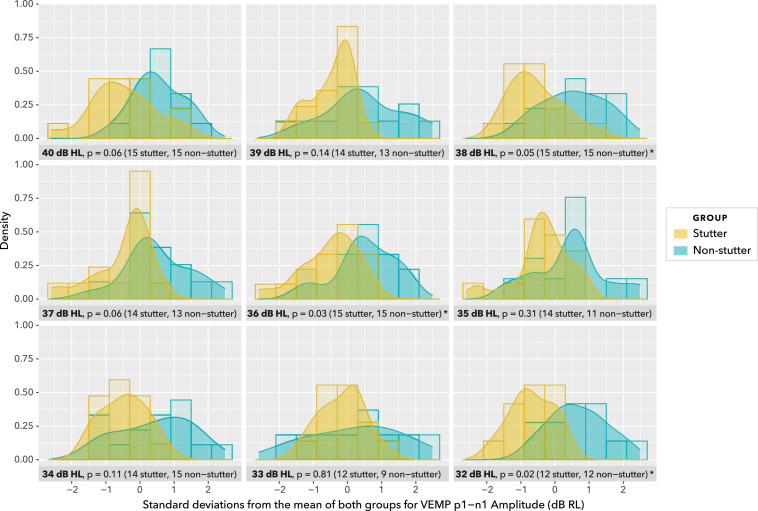
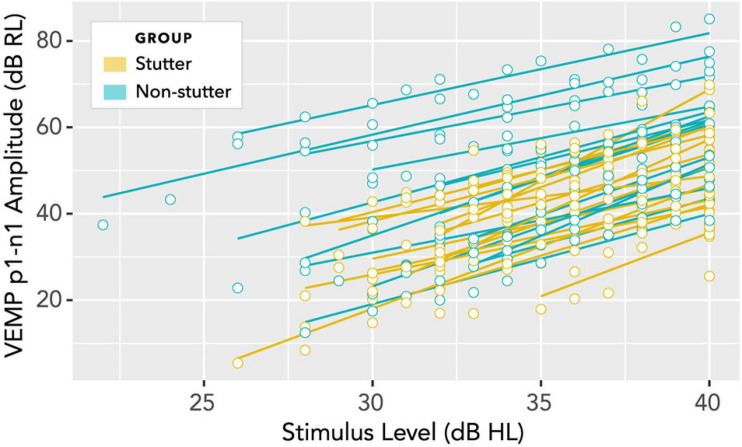
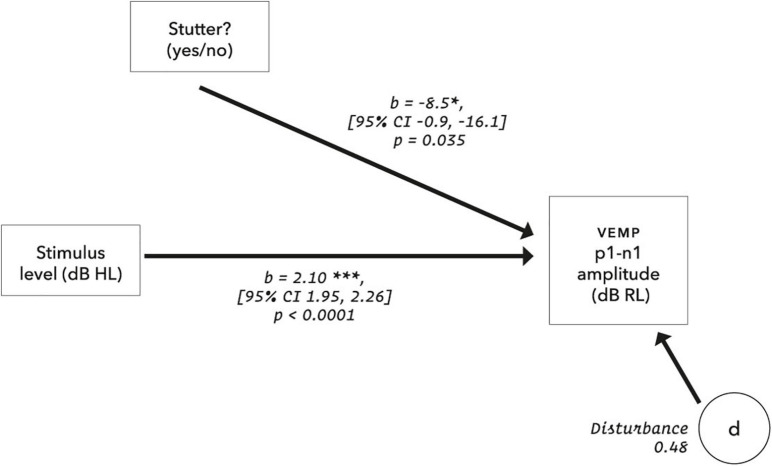
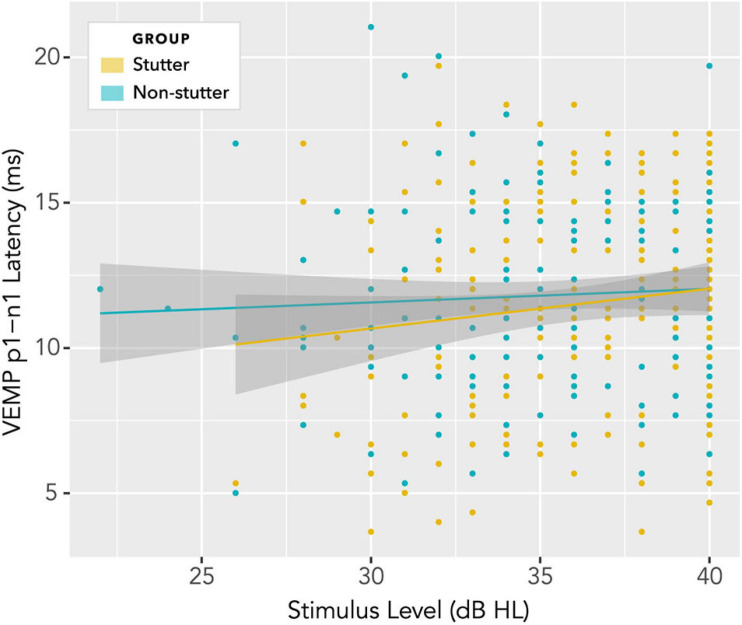
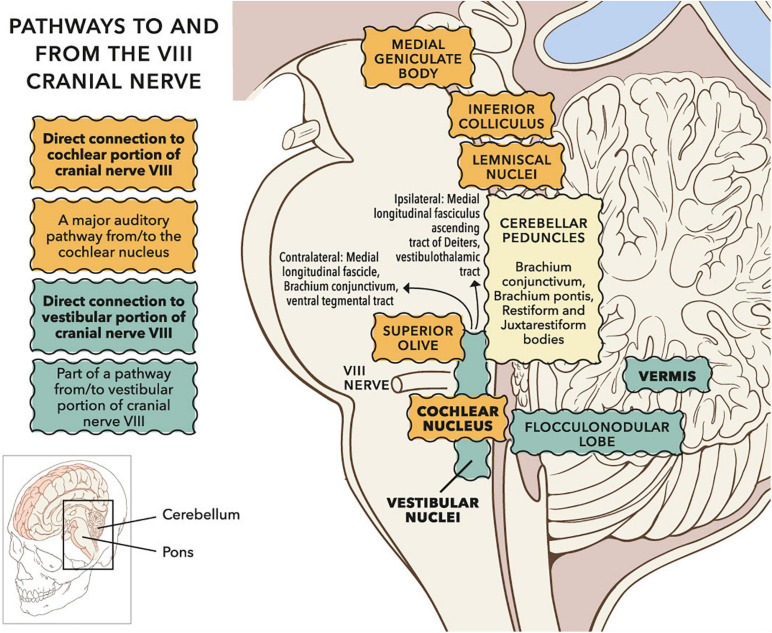
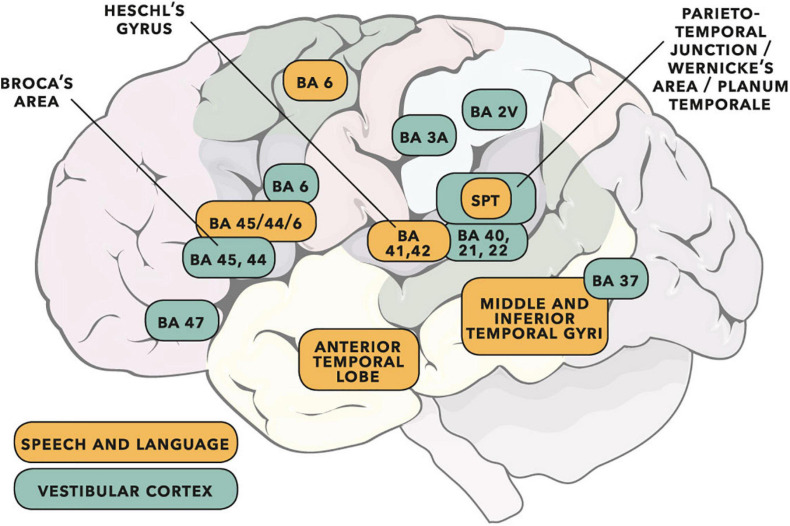
Vibrational energy created at the larynx during speech will deflect vestibular mechanoreceptors in humans (Todd et al., 2008; Curthoys, 2017; Curthoys et al., 2019). Vestibular-evoked myogenic potential (VEMP), an indirect measure of vestibular function, was assessed in 15 participants who stutter, with a non-stutter control group of 15 participants paired on age and sex. VEMP amplitude was 8.5 dB smaller in the stutter group than the non-stutter group (p = 0.035, 95% CI [-0.9, -16.1], t = -2.1, d = -0.8, conditional R 2 = 0.88). The finding is subclinical as regards gravitoinertial function, and is interpreted with regard to speech-motor function in stuttering. There is overlap between brain areas receiving vestibular innervation, and brain areas identified as important in studies of persistent developmental stuttering. These include the auditory brainstem, cerebellar vermis, and the temporo-parietal junction. The finding supports the disruptive rhythm hypothesis (Howell et al., 1983; Howell, 2004) in which sensory inputs additional to own speech audition are fluency-enhancing when they coordinate with ongoing speech.

Keywords: VEMP; own voice identification; speech perception; speech-motor control; stuttering; vestibular.


Conflict of interest statement

The authors declare that the research was conducted in the absence of any commercial or financial relationships that could be construed as a potential conflict of interest.

Figures

FIGURE 1
FIGURE 1
Reflexes evoked by sound or vibration in postural muscles. Circles show sites, laterality and approximate latencies based on air-conducted stimulation. The right ear (solid red headphone) is the stimulated side. Solid circles show reflexes whose polarity has been confirmed with intramuscular recordings (black: excitatory; grey: inhibitory). Open circles show reflexes whose polarity has either not been definitively determined (triceps and gastrocnemius) or is known to depend upon head position (soleus). Reproduced from Rosengren and Colebatch (2018), see original for references to supporting studies. Creative Commons Attribution License (CC-BY).
FIGURE 2
FIGURE 2
Recording arrangement and neural pathways of the electrically evoked vestibulo-collic reflex in monkey and human, reproduced from Forbes et al. (2020). Single motor unit recordings were made from the sternocleidomastoid muscle (SCM) using irregular stimuli, and sine wave stimuli at frequencies up to 300 Hz. Cervical motor unit activity in both human and monkey was modulated by the stimuli. Recording of vestibular afferents in the monkey only showed similar modulation. See Forbes et al. (2020) for detail of filtering and phase locking effects. When evaluated using surface electrodes and sound or vibration stimuli, inhibition of SCM spindles can be measured as the cervical vestibular evoked myogenic potential (VEMP) which is the subject of the current study. INC, interstitial nucleus of Cajal; MN, motoneurons; MRST, medial reticulospinal tract; VN, vestibular nuclei; VST, vestibulospinal tract. Creative Commons Attribution License (CC-BY).
FIGURE 3
FIGURE 3
Custom head bar. Participants were instructed to push against a padded bar using the forehead, such that sternocleidomastoid tension was maintained as close as possible to 50 μV RMS throughout testing. Biofeedback in the Eclipse clinical software enabled participants to monitor sternocleidomastoid tension.
FIGURE 4
FIGURE 4
Grand Average VEMP wave forms at the maximum 40 dB HL stimulus level. The horizontal axis shows the time course of each epoch in milliseconds, with the stimulus always presented at time zero during an epoch. The 8 ms interval immediately after stimulus presentation is adjusted to have an amplitude of zero for all recordings, to remove stimulus artefact from the bone conductor. The vertical axis shows response amplitude. Wave forms in this figure have been averaged per participant and per group. On a per participant basis, the 300 epochs per stimulus level per participant were averaged together; these averages of 300 epochs (see the “Procedure” and “Data Processing” sections) are referred to as a “sequence”. Normalisation was then carried out on a per participant basis, and is in addition to the tight control of background electromyographic tension (target of 50 μV for all participants) using a custom head bar and biofeedback. In the normalisation routine, the VEMP amplitude of the wave form in microvolts was divided by the root mean square VEMP amplitude in microvolts of an 18 ms pre-stimulus interval. VEMP amplitudes are thus provided in dimensionless units. In the per group averaging to create the grand averages shown in this figure, all normalised sequences at 40 dB HL have been averaged together on a group basis for either the stutter group or the non-stutter control group.
FIGURE 5
FIGURE 5
Initial statistical model for VEMP p1-n1 response amplitude. Neck tension was a root mean square of the pre-stimulus VEMP p1-n1 amplitude based on each presentation sequence of 300 stimulus repetitions. Age was calculated in days at the time of testing. The dB RL units used for vestibular response are a log transformation of the VEMP p1-n1 amplitude, such that zero dB RL corresponds to vestibular threshold (although, see note in Figure 11). Possible disturbances include neck size, pulse rate and crossed response.
FIGURE 6
FIGURE 6
Histogram of VEMP p1-n1 amplitudes for stutter and control groups. The histogram does not show detail of participant or stimulus level, and contains repeated measurements for the two groups of 15 participants per group. As such, it suggests shape of distribution and direction of group difference, but is not appropriate for statistical comparison (statistical comparison is by linear mixed-effects regression modelling).
FIGURE 7
FIGURE 7
Boxplot showing VEMP p1-n1 amplitudes for stutter and non-stutter groups collapsed across stimulus level (i.e., identical data to Figure 6). Log transformation on the ordinate is such that a doubling of the VEMP p1-n1 amplitude in normalised microvolts (i.e., with unity RMS background) corresponds to a 6 dB increase. The two slightly larger circles near the medians denote means. The ratio of difference between medians to overall spread (i.e., to the difference between the lower quartile for the stutter group and the upper quartile for the non-stutter group) is approximately 30%. However, this data presentation is for illustration purposes only. The data contain repeat readings with asymmetries between groups. The actual statistical analysis is via linear mixed-effects regression modelling, and is described in the sections “Statistical Model” and “VEMP p1-n1 Amplitude”.
FIGURE 8
FIGURE 8
Box plots showing distributions of VEMP p1-n1 amplitude, with participants who stutter and paired non-stutter control participants arranged adjacently in order of age. The box plot does not show detail of stimulus level (although, larger VEMP p1-n1 amplitude almost invariably corresponds to higher stimulus level). Log transformation on the ordinate is such that a 6 dB increase corresponds to a doubling of the VEMP p1-n1 amplitude in normalised microvolts (i.e., with unity RMS background). Arrows link the mean VEMP p1-n1 amplitudes of participants who stutter with those of their paired controls. The control participant without stuttering is always shown at the point of the arrow, whilst the participant with stuttering is where fletching would appear. In 10 cases (arrows with gradients) VEMP p1-n1 amplitudes are overall markedly higher for non-stutter than stutter participants. In three cases (blue outline arrows with horizontal stripes) there is a partial overlap, which will be evaluated in the statistical analysis. In two cases (red outline arrows with vertical stripes) VEMP p1-n1 amplitudes are overall clearly higher for the stutter than the non-stutter participants. These two participants who stutter differed from the remaining 13 in the stutter group (one had a possible psychogenic onset, the other had both cluttering and stuttering). All 15 participants in the stutter group, along with the 15 control participants in the non-stutter group, were included in the linear mixed-effects regression analysis.
FIGURE 9
FIGURE 9
Density plots at stimulus levels between 40 dB HL and 32 dB HL. Histograms are shown in the background. Uncorrected t-tests show group differences at p ≤ 0.05 for 38, 36, and 32 dB HL, and p = 0.06 for 40 and 37 dB HL. Group sizes are unbalanced at 35 and 33 dB HL. This view of data with uncorrected t-tests is for illustration purposes only. Repeated measures at the same stimulus level are excluded, as are data at stimulus levels below 32 dB HL, and no account is made of trends in participants across stimulus levels. The actual statistical analysis is by linear mixed-effects regression modelling, and is described in the sections “Statistical Model” and “VEMP p1-n1 Amplitude.”
FIGURE 10
FIGURE 10
Per participant slopes of stimulus level (dB HL) versus VEMP p1-n1 amplitude (dB RL). Log transformation on the ordinate is such that a 6 dB increase corresponds to a doubling of the VEMP p1-n1 amplitude in normalised microvolts (i.e., with unity RMS background). A fixed slope, varying intercept model is supported if the least squares fit lines shown in this diagram are considered approximately parallel. Analyses of varying slope linear mixed models for these data are available in the Supplementary Material.
FIGURE 11
FIGURE 11
Final model for VEMP amplitude. The disturbance represents influences other than those measured in the model, and is the square root of (1 – R2), where the conditional R2 is calculated according to Nakagawa et al. (2017) using the MuMIn package (version 1.43.17). For the control group, using the calibrations and data transformations in this report, the y-axis intercept is −24.9 dB RL (95% CI [−32.6, −17.2]). The suggestion is of VEMP thresholds at 20.3 dB HL for the stutter group and 11.8 dB HL for the non-stutter group. However, VEMP thresholds projected in this way (extrapolation to 0 dB RL) assume a linear relationship between stimulus level and VEMP amplitude over a wider range of stimulus levels than was tested in this study. Such projections are dissimilar to VEMP thresholds evaluated by clinical search procedures (e.g., as per British Society of Audiology, 2012). Clinical VEMP thresholds refer to the smallest VEMP p1-n1 amplitudes which can be recorded against electromyographic background in a particular laboratory, and are used for differential diagnosis as part of a test battery (Rosengren et al., 2019).
FIGURE 12
FIGURE 12
Histogram of VEMP p1-n1 latencies for stutter and control groups. The histogram does not show detail of participant or stimulus level, and contains repeated measurements for the two groups of 15 participants per group. As such, it suggests shape of distribution and direction of group difference, but is not appropriate for statistical comparison (statistical comparison is by linear mixed-effects regression modelling).
FIGURE 13
FIGURE 13
Variation of VEMP p1-n1 latency with stimulus level. There is no statistically significant interaction, and no indication of a group difference.
FIGURE 14
FIGURE 14
Sagittal view of subcortical pathways to and from the VIII cranial nerve. Whilst the auditory pathway ascending from the cochlear nucleus is relatively well established (Irvine, 1992), pathways to and from vestibular nuclei remain under investigation (Pierrot-Deseilligny and Tilikete, 2008; Zwergal et al., 2009). Projections to vestibular cortex via the thalamus have been investigated in humans through clinical observation and lesion studies (Conrad et al., 2014; Hitier et al., 2014; Wijesinghe et al., 2015). Vestibular nuclei also project down the spine (not shown). © Portions of this figure were adapted from illustrations by Patrick J. Lynch, http://patricklynch.net/. Creative Commons 2.5 license.
FIGURE 15
FIGURE 15
Cortical areas important for speech and language (adapted from the dual-stream model of Hickok and Poeppel, 2007) shown with vestibular cortical areas identified in cats, monkeys and humans (adapted from Ventre-Dominey, 2014; see also Frank and Greenlee, 2018). Cortical activity following vestibular input has wide interpretation (e.g., see reviews of cognition in Hitier et al., 2014, and audition/rhythm/timing in Todd and Lee, 2015). Some of the vestibular areas identified will be predominantly related to gravitoinertial function (see discussion in Ferrè and Haggard, 2020). Numbers are Brodmann areas – see primary literature for more exact location detail. Spt is the Sylvian temporo-parietal region proposed by Hickok and Poeppel (2007) as a sensorimotor integration area. Vestibular sites in humans have been identified as such when direct electrical stimulation of the cortex gives rise to gravitoinertial illusion. When vestibular sites are identified within BA 21 (lateral temporal lobe) or BA 22 (Wernicke’s area), auditory illusion is found to accompany gravitoinertial illusion (Kahane et al., 2003; Fenoy et al., 2006). © Portions of this illustration were adapted from Servier Medical Art, https://smart.servier.com. Creative Commons 3.0 license.

Similar articles

Cited by

References

    1. Abdalla S. (2011). Low frequency dielectric properties of human blood. IEEE Trans. NanoBiosci. 10 113–120. 10.1109/TNB.2011.2159734 - DOI - PubMed
    1. Alm P. A. (2004). Stuttering and the basal ganglia circuits: a critical review of possible relations. J. Commun. Disord. 37 325–369. 10.1016/j.jcomdis.2004.03.001 - DOI - PubMed
    1. Alm P. A. (2006). Stuttering and sensory gating: a study of acoustic startle prepulse inhibition. Brain Lang. 97 317–321. 10.1016/j.bandl.2005.12.001 - DOI - PubMed
    1. Alm P. A., Karlsson R., Sundberg M., Axelson H. W. (2013). Hemispheric lateralization of motor thresholds in relation to stuttering. PLoS One 8:e76824. 10.1371/journal.pone.0076824 - DOI - PMC - PubMed
    1. Alm P. A., Risberg J. (2007). Stuttering in adults: the acoustic startle response, temperamental traits, and biological factors. J. Commun. Disord. 40 1–41. 10.1016/j.jcomdis.2006.04.001 - DOI - PubMed