Comparative Study
. 2021 Sep 14:12:711980.
doi: 10.3389/fimmu.2021.711980. eCollection 2021.

Characterization of Organ-Specific Regulatory B Cells Using Single-Cell RNA Sequencing

Affiliations
Comparative Study

Characterization of Organ-Specific Regulatory B Cells Using Single-Cell RNA Sequencing

Si-Yu Yang et al. Front Immunol. .

Abstract

Regulatory B cells (Breg) are considered as immunosuppressive cells. Different subsets of Breg cells have been identified both in human beings and in mice. However, there is a lack of unique markers to identify Breg cells, and the heterogeneity of Breg cells in different organs needs to be further illuminated. In this study, we performed high-throughput single-cell RNA sequencing (scRNA-seq) and single-cell B-cell receptor sequencing (scBCR-seq) of B cells from the murine spleen, liver, mesenteric lymph nodes, bone marrow, and peritoneal cavity to better define the phenotype of these cells. Breg cells were identified based on the expression of immunosuppressive genes and IL-10-producing B (B10) cell-related genes, to define B10 and non-B10 subsets in Breg cells based on the score of the B10 gene signatures. Moreover, we characterized 19 common genes significantly expressed in Breg cells, including Fcrl5, Zbtb20, Ccdc28b, Cd9, and Ptpn22, and further analyzed the transcription factor activity in defined Breg cells. Last, a BCR analysis was used to determine the clonally expanded clusters and the relationship of Breg cells across different organs. We demonstrated that Atf3 may potentially modulate the function of Breg cells as a transcription factor and that seven organ-specific subsets of Breg cells are found. Depending on gene expression and functional modules, non-B10 Breg cells exhibited activated the TGF-β pathway, thus suggesting that non-B10 Breg cells have specific immunosuppressive properties different from conventional B10 cells. In conclusion, our work provides new insights into Breg cells and illustrates their transcriptional profiles and BCR repertoire in different organs under physiological conditions.

Keywords: B10 cells; BCR; Breg cells; scRNA-Seq; transcription factor.


Conflict of interest statement

The authors declare that the research was conducted in the absence of any commercial or financial relationships that could be construed as a potential conflict of interest.

Figures
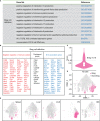
Figure 1
Figure 1
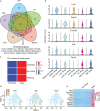
Breg cells analysis by high-throughput scRNA-seq in different organs. (A) Gene sets from GO, BioGPS, and GEO databases. (B) List of selected genes for identifying Breg cells. (C) Evaluation of the Breg cell module score. (D) t-SNE plot of Breg cell distribution in total B cells from all organs. (E) t-SNE plot of Breg cell distribution in spleen, liver, mLN, PC, and BM.
Figure 2
Figure 2
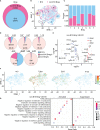
Common marker genes and transcription factors in Breg cells. (A) Venn diagram showed the overlap of upregulated DEGs by comparing Breg cells with non-Breg cells in different organs. (B) Violin plots represented the normalized expression of Fcrl5, Zbtb20, Ccdc28b, Cd9, and Ptpn22 in Breg cells and non-Breg cells across different organs. (C) Heat map of the activation scores of 500 randomly selected Breg cells and 500 non-Breg cells from all organs for expression regulated by transcription factors (TFs). (D) Feature plot of Atf3, Myc, and Sox5 expression of three TFs on total B cells from all organs. (E) Heat map of Atf3-related gene expression between Breg cells and non-Breg cells in total B cells from all organs.
Figure 3
Figure 3
Subsets of Breg cells. (A) t-SNE plot of identified Breg cells from all organs showing seven clusters. (B) Heat map of top 50 genes in each subset of Breg cells from all organs. (C) Violin plots showed the normalized expression of the marker genes in each Breg cell subset from all organs. (D) GSVA analysis of immunoregulation pathways in Breg cell clusters from all organs. (E) Distribution of Breg cell subsets in spleen, liver, mLN, PC, and BM. (F) The proportion of Breg cell subsets in spleen, liver, mLN, PC, and BM.
Figure 4
Figure 4
Clonal expansion and potential migration of Breg cells subsets at scBCR-seq. (A) The distribution of top 10 BCR clonotypes in Breg cells clusters of all organs. (B) t-SNE plot of top 10 BCR clonotypes of Breg cells in each organ. (C) Sharing of Breg cell BCR clonotypes across pairwise organs. (D) Sharing of Breg cell and BCR cell counts across pairwise organs. (E) Heat map of transition-index scores for the pairwise Breg cell clusters from all organs. (F) Expansion-index scores of each Breg cluster from all organs calculated using STARTRAC. (G) Migration-index scores of each Breg cluster from all organs calculated using STARTRAC.
Figure 5
Figure 5
Functionally specific non-B10 versus B10 cells among Breg cells. (A) Venn diagram showed the B10 and non-B10 cells in Breg cells of all organs. (B) t-SNE plots of the B10 and non-B10 cells in Breg cells. (C) Proportion of B10 and non-B10 Breg cells in every Breg cell cluster. (D) Percent of B10 and non-B10 Breg cells in spleen, liver, mLN, PC, and BM. (E) Volcano plot displayed the DEGs between B10 and non-B10 Breg cells from all organs. (F) t-SNE plots of the normalized expression of Il10, Tgfb1, Ebi3, and Il12a in non-B10 Breg cells of all organs. (G) GSEA analysis of B10 and non-B10 Breg cells of all organs.

References

    1. Rosser EC, Mauri C. Regulatory B Cells: Origin, Phenotype, and Function. Immunity (2015) 42(4):607–12. doi: 10.1016/j.immuni.2015.04.005 - DOI - PubMed
    1. Miyagaki T, Fujimoto M, Sato S. Regulatory B Cells in Human Inflammatory and Autoimmune Diseases: From Mouse Models to Clinical Research. Int Immunol (2015) 27(10):495–504. doi: 10.1093/intimm/dxv026 - DOI - PubMed
    1. Braza F, Chesne J, Durand M, Dirou S, Brosseau C, Mahay G, et al. . A Regulatory CD9(+) B-Cell Subset Inhibits HDM-Induced Allergic Airway Inflammation. Allergy (2015) 70(11):1421–31. doi: 10.1111/all.12697 - DOI - PubMed
    1. Bankoti R, Gupta K, Levchenko A, Stager S. Marginal Zone B Cells Regulate Antigen-Specific T Cell Responses During Infection. J Immunol (2012) 188(8):3961–71. doi: 10.4049/jimmunol.1102880 - DOI - PubMed
    1. Xiao X, Lao XM, Chen MM, Liu RX, Wei Y, Ouyang FZ, et al. . PD-1(Hi) Identifies a Novel Regulatory B-Cell Population in Human Hepatoma That Promotes Disease Progression. Cancer Discovery (2016) 6(5):546–59. doi: 10.1158/2159-8290.Cd-15-1408 - DOI - PubMed

Publication types

MeSH terms

Substances