

The CRL4DCAF1 cullin-RING ubiquitin ligase is activated following a switch in oligomerization state
- PMID: 34595758
- PMCID: PMC8591539
- DOI: 10.15252/embj.2021108008
The CRL4DCAF1 cullin-RING ubiquitin ligase is activated following a switch in oligomerization state
Abstract
The cullin-4-based RING-type (CRL4) family of E3 ubiquitin ligases functions together with dedicated substrate receptors. Out of the ˜29 CRL4 substrate receptors reported, the DDB1- and CUL4-associated factor 1 (DCAF1) is essential for cellular survival and growth, and its deregulation has been implicated in tumorigenesis. We carried out biochemical and structural studies to examine the structure and mechanism of the CRL4DCAF1 ligase. In the 8.4 Å cryo-EM map of CRL4DCAF1 , four CUL4-RBX1-DDB1-DCAF1 protomers are organized into two dimeric sub-assemblies. In this arrangement, the WD40 domain of DCAF1 mediates binding with the cullin C-terminal domain (CTD) and the RBX1 subunit of a neighboring CRL4DCAF1 protomer. This renders RBX1, the catalytic subunit of the ligase, inaccessible to the E2 ubiquitin-conjugating enzymes. Upon CRL4DCAF1 activation by neddylation, the interaction between the cullin CTD and the neighboring DCAF1 protomer is broken, and the complex assumes an active dimeric conformation. Accordingly, a tetramerization-deficient CRL4DCAF1 mutant has higher ubiquitin ligase activity compared to the wild-type. This study identifies a novel mechanism by which unneddylated and substrate-free CUL4 ligases can be maintained in an inactive state.
Keywords: CRL4/DCAF1; E3 ligases; Oligomerization; Ubiquitin; VprBP.
© 2021 The Authors. Published under the terms of the CC BY NC ND 4.0 license.
Conflict of interest statement
The authors declare that they have no conflict of interest.
Figures
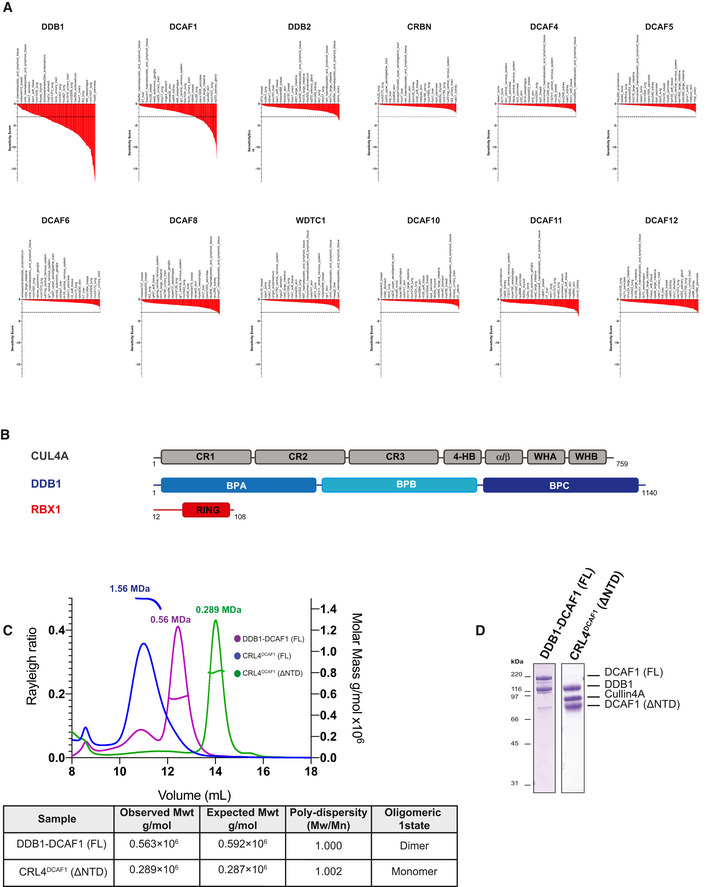
Sensitivity score profiles adapted from the DRIVE data for DDB1, DCAF1, DDB2, CRBN, DCAF4, DCAF5, DCAF6, DCAF8, WDTC1, DCAF10, DCAF11, and DCAF12. The dropout score in the shRNA screen was converted into log fold‐change (logFC) per shRNA per cell line. The logFC was then normalized per sample to obtain a shRNA level sensitivity score. The shRNA level scores are further aggregated to gene level sensitivity scores using either the ATARiS algorithm (Shao et al, 2013) or the RSA algorithm (König et al, 2007). These give a measure of the statistical significance of the dropout of those 20 shRNAs used per gene compared to the remainder shRNAs in the screen (McDonald et al, 2017).
Domain organization of human CUL4A, DDB1, and RBX1. CR, cullin repeat; UFD, ubiquitin‐fold domain; RING, really interesting new gene; WH, winged helix; BP, β‐propeller.
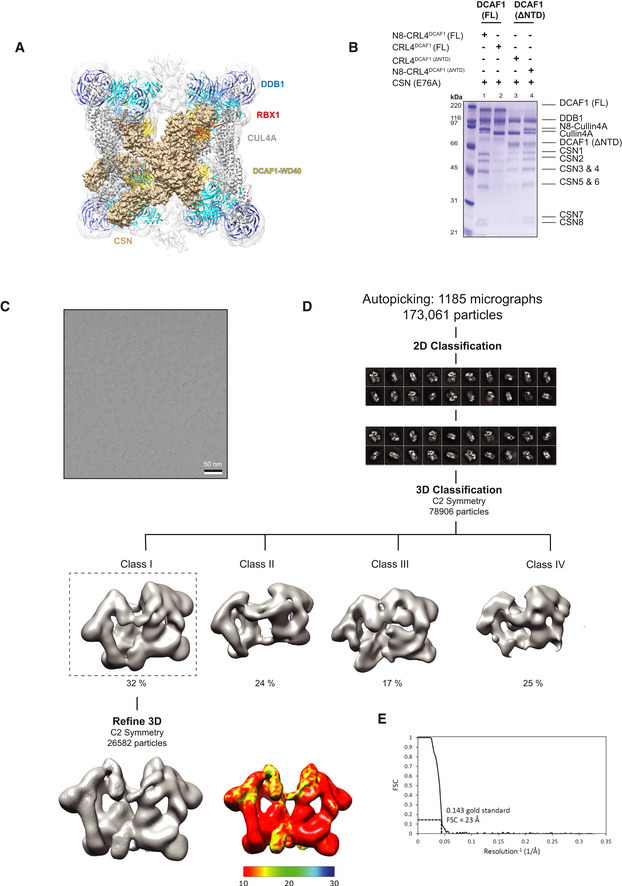
SEC‐MALS analysis, the chromatogram shows the Rayleigh ratio curves of CRL4DCAF1 (FL), CRL4DCAF1(ΔNTD), and DDB1‐DCAF1 (FL) together with the molar mass (MDa) of the main peaks determined by MALS. The table summarizes the SEC‐MALS observed molecular weights, the calculated molecular weight, polydispersity values, and oligomeric states of the tested complexes.
SDS–PAGE of the corresponding complexes.
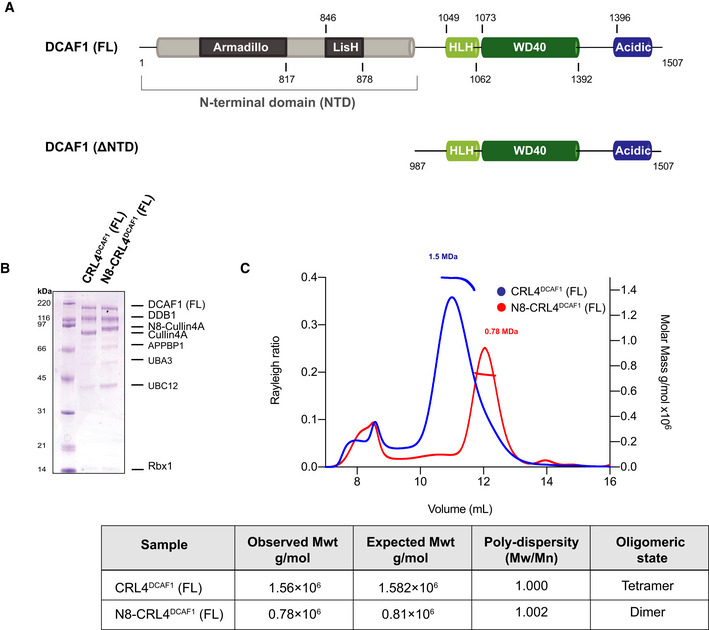
Predicted domain organization of the human DCAF1 (FL).
SDS–PAGE Coomassie gel of the neddylation reaction of CRL4DCAF1 at time 0 h and the fully neddylated N8‐CRL4DCAF1 after 2 h.
SEC‐MALS analysis of CRL4DCAF1 and N8‐CRL4DCAF1. The chromatogram displays Rayleigh ratio curves for CRL4DCAF1 (blue) and N8‐CRL4DCAF1 (red) together with the molar mass (MDa) of the main peaks calculated by MALS. The table summarizes the SEC‐MALS observed molecular weights in the main peaks, the calculated molecular weights, polydispersity values, and oligomeric states of the tested complexes.
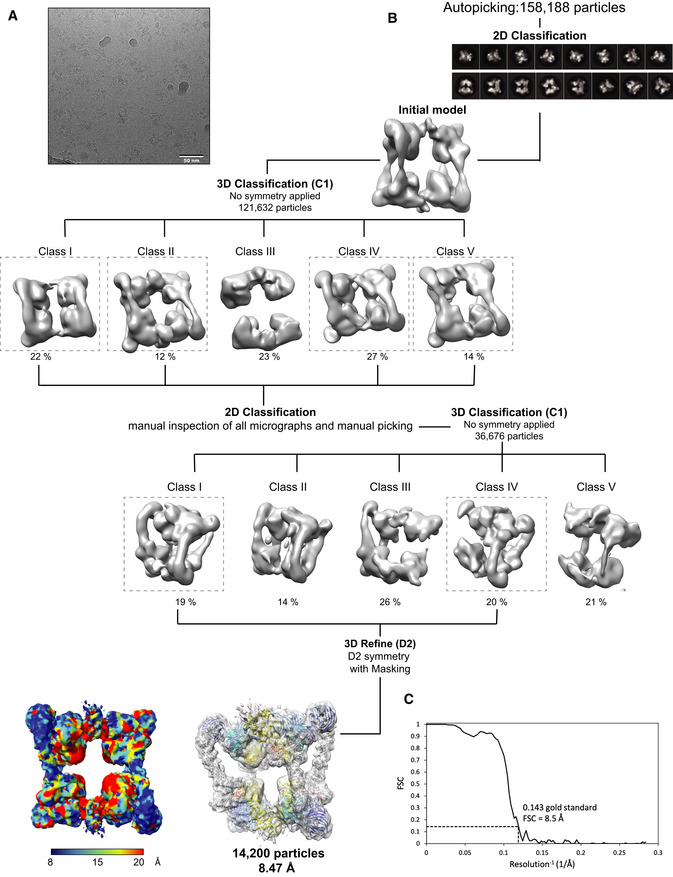
Representative micrograph for CRL4DCAF1 complex.
Workflow of cryo‐EM classification and refinement.
Fourier shell correlation curve (FSC). The resolution values reported for all reconstructions are based on the gold‐standard Fourier shell correlation curve (FSC) at 0.143 criterion and all the related FSC curves are corrected for the effects of soft masks using high‐resolution noise substitution.
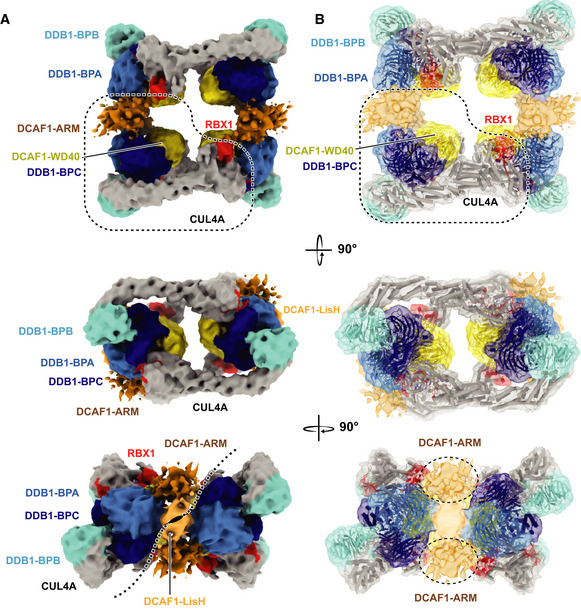
- A, B
Different views of CRL4DCAF1 cryo‐EM map (8.4 Å) with fitted crystal structures of CUL4A (gray), RBX1 (red) (PDB
2HYE ), DDB1 BPA (light blue), BPB (cyan), and BPC (dark blue), DCAF1 WD40 domain (yellow) (PDB5JK7 ), LisH domain (orange), and ARM domain (brown) in (A) surface representation, and (B) cartoon representation.
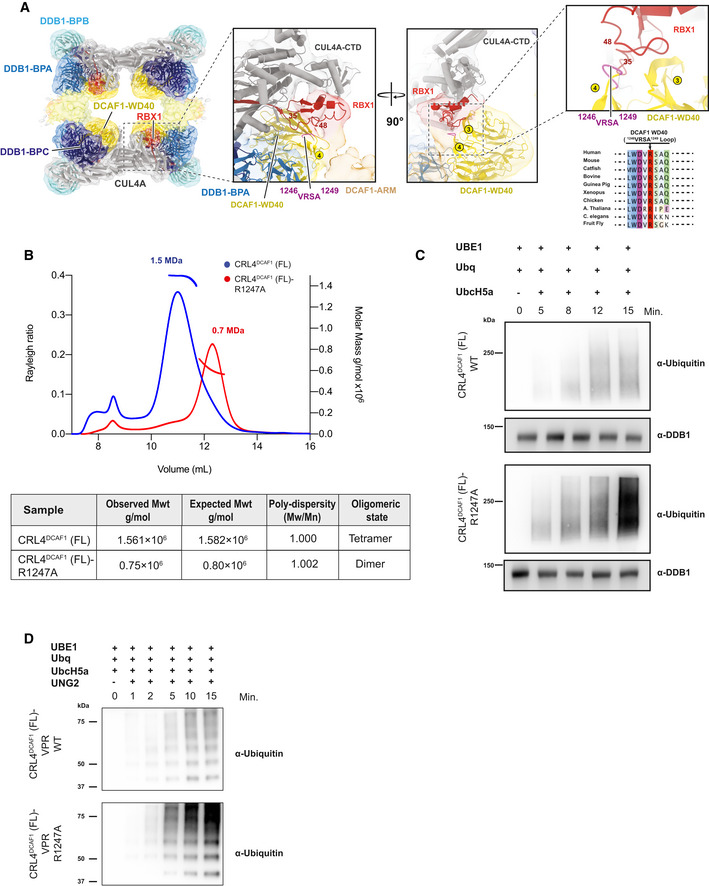
CRL4DCAF1 cryo‐EM map (8.4 Å) with fitted model (left), and a close‐up view of the CRL4DCAF1 map shows the interaction between DCAF1 (WD40) in yellow and RBX1 in red. The loop in DCAF1 (WD40) that contains the mutated arginine (R1247) is colored in violet. Circled numbers indicate the respective blades in the WD40 β‐propeller. The RBX1 segment potentially contacting the VRSA loop in DCAF1 is indicated by flanking residue numbers. Conservation plot in the region around the residue R1247 in DCAF1 is shown to the lower right.
SEC‐MALS analysis of CRL4DCAF1 and CRL4DCAF1 (R1247A) mutant. The chromatogram displays Rayleigh ratio curves of CRL4DCAF1 WT (blue) and mutant CRL4DCAF1 (R1247A) (red) together with the molar mass (MDa) of the main peaks calculated by MALS. The table summarizes the SEC‐MALS observed molecular weights in the main peaks, the calculated molecular weight, polydispersity values, and oligomeric states of the tested complexes.
Autoubiquitination of DCAF1 by wild‐type CRL4DCAF1 (FL) (top) or mutant CRL4DCAF1 (FL) (R1247A) (bottom) observed after incubation with UBA1, UbcH5a, Ubiquitin (WT), at 30°C for 0 to 15 min as indicated (n = 3).
Ubiquitination of UNG2 by wild‐type CRL4DCAF1‐VPR (FL) (top) or mutant CRL4DCAF1‐VPR (FL) (R1247A) (bottom) observed after incubation with UBA1, UbcH5a, Ubiquitin (WT), at 30°C for 0 to 15 min as indicated (n = 3).
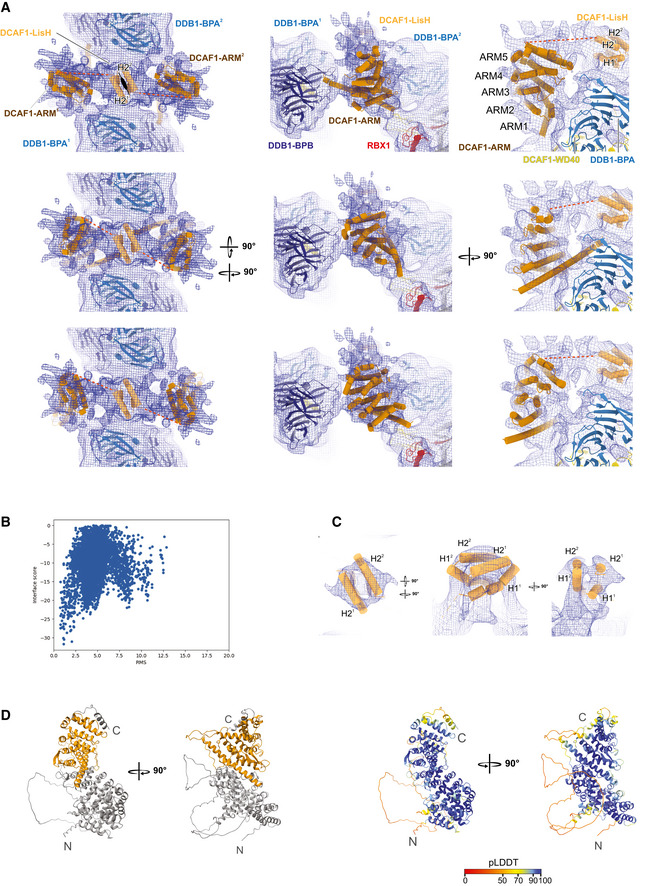
Different rotation views of DCAF1 ARM domain (brown) and LisH domain (light orange) modeled into the CRL4DCAF1 cryo‐EM map. Three potential docking poses of the ARM domain are shown in the upper, middle, and lower panels. The correlations between simulated 8.4 Å model maps and the experimental map are 0.53, 0.59, and 0.59 (from top to bottom). LisH helices are labeled as H21, H31 from one molecule and H22, H32 from the other protomer. The resolved part of the ARM repeats spanning residues (507–817) and excluding insertions are labeled as ARM (1 to 5). The unmodeled linker between DCAF1‐ARM and LisH domains is indicated by a red dashed line. The map contour level is 0.00934.
Symmetric docking of LisH homodimer. The root mean square (r.m.s.) deviation was calculated by comparing the decoys against the modeled homodimer based on the LisH domain extracted from coordinates with PDB ID 6IWV.
Fitting of the LisH domain. The map contour level is 0.0132.
Initial ARM domain model from the Alphafold pipeline. The part fitted into the density is colored in orange (left). In the right panel, the ARM domain is colored according to pLDDT values (predicted local distance difference test; scale 0–100, low to high confidence, Jumper et al, 2021).
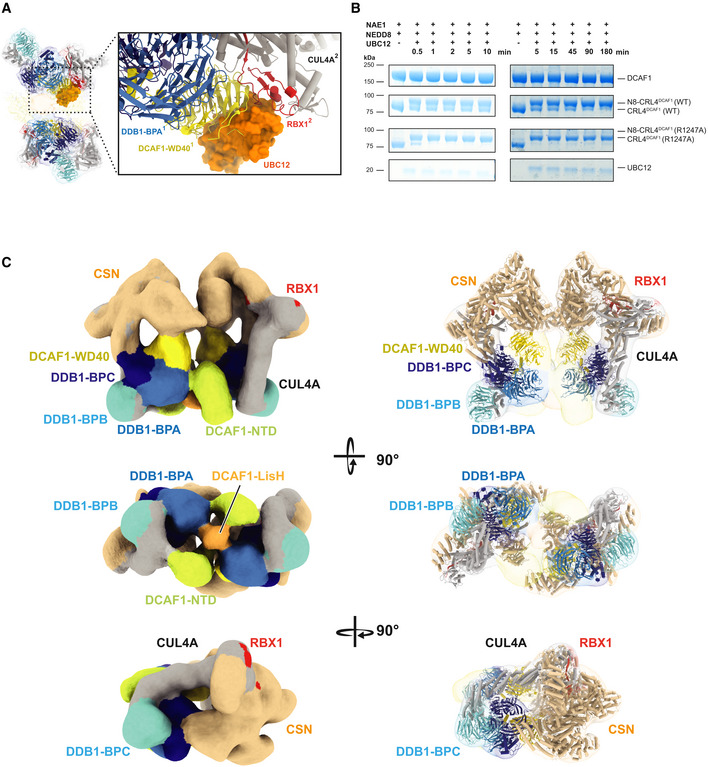
CRL4DCAF1 cryo‐EM map and a close‐up view of fitted UBC12‐RBX1 structure (PDB
4P5O ) that shows steric clashes with DCAF1 (WD40)1 of one CRL4DCAF1 molecule (yellow) (PDB5JK7 ) and RBX12 of the second CRL4DCAF1 molecule (red), UBC12 is shown in orange (PDB4P5O ), DDB1 BPA (light blue), BPB (cyan), and BPC (dark blue), CUL4A in gray. Molecules belonging to different protomers are indicated by superscripts (1 or 2).SDS–PAGE showing the neddylation reaction time course of CRL4DCAF1 (FL) WT and CRL4DCAF1 (FL) (R1247A) mutant in the presence of 1 μM UBC12 for 0 to 180 min as indicated. Left panel with t = 0 to 10 min, and right panel with t = 5 to 180 min (n = 3).
Different views of CRL4DCAF1‐CSN cryo‐EM map with fitted crystal structures of CUL4A (gray) (PDB
2HYE ), RBX1 (red), DDB1 BPA (light blue), BPB (cyan), BPC (dark blue), DCAF1 WD40 (yellow), DCAF1 NTD (yellow‐green), and CSN (PDB4D10 ) (wheat).
Fitting the crystal structure of CSN (PDB
4D10 ) (wheat) into CRL4DCAF1 cryo‐EM map.Strep pull‐down assay of untagged CSN (E76A) complex on strep‐tagged N8‐CRL4DCAF1(FL) (lane1), CRL4DCAF1(FL) (lane2), CRL4DCAF1(ΔNTD) (lane3), and N8‐CRL4DCAF1(ΔNTD) (lane 4) (n = 2).
A representative cryo‐EM micrograph for CRL4DCAF1‐CSN complex.
Workflow of cryo‐EM classification and refinement.
Fourier shell correlation curve (FSC). The resolution values reported for all reconstructions are based on the gold‐standard Fourier shell correlation curve (FSC) at 0.143 criterion and all the related FSC curves are corrected for the effects of soft masks using high‐resolution noise substitution.
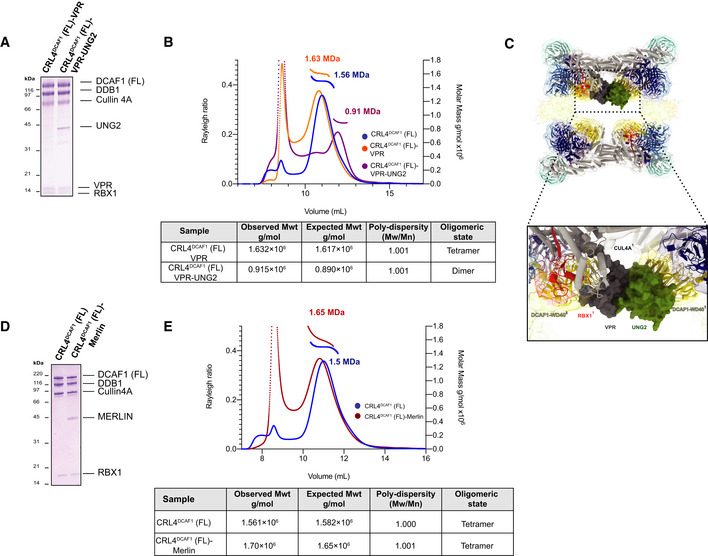
SDS–PAGE of the purified CRL4DCAF1 (FL)‐VPR and CRL4DCAF1 (FL)‐VPR‐UNG2 complexes.
SEC‐MALS analysis, the chromatogram shows Rayleigh ratio curves of CRL4DCAF1 (FL), CRL4DCAF1 (FL)‐VPR, and CRL4DCAF1 (FL)‐VPR‐UNG2, together with the molar mass (MDa) of the main peaks determined by MALS. The table summarizes the observed molecular weight in the main peaks by SEC‐MALS, listing the calculated molecular weight, polydispersity values, and oligomeric states of the tested complexes. The peaks eluting close to the void volume were shown to contain heterogeneous large aggregates (Fig EV5A and B).
CRL4DCAF1 cryo‐EM map with the fitted model, and a close‐up view of fitted crystal structures of CUL4A (gray), RBX1 (red) (PDB
2HYE ), DDB1 BPA (light blue), BPB (cyan), and BPC (dark blue), DCAF1 (WD40) (yellow), VPR (dark gray), and UNG2 (green) (PDB5JK7 ).SDS–PAGE of the purified CRL4DCAF1 and CRL4DCAF1(FL)‐MERLIN complexes.
SEC‐MALS analysis, the chromatogram shows the Rayleigh ratio curves of CRL4DCAF1(FL) (blue) and CRL4DCAF1(FL)‐MERLIN (red) together with the molar mass (MDa) of the main peaks calculated by MALS. The table summarizes the SEC‐MALS observed molecular weights, the calculated molecular weights, polydispersity values, and oligomeric states of the tested complexes. The peak eluting close to the void volume contains large unspecific aggregates (Fig EV5C).
- A–C
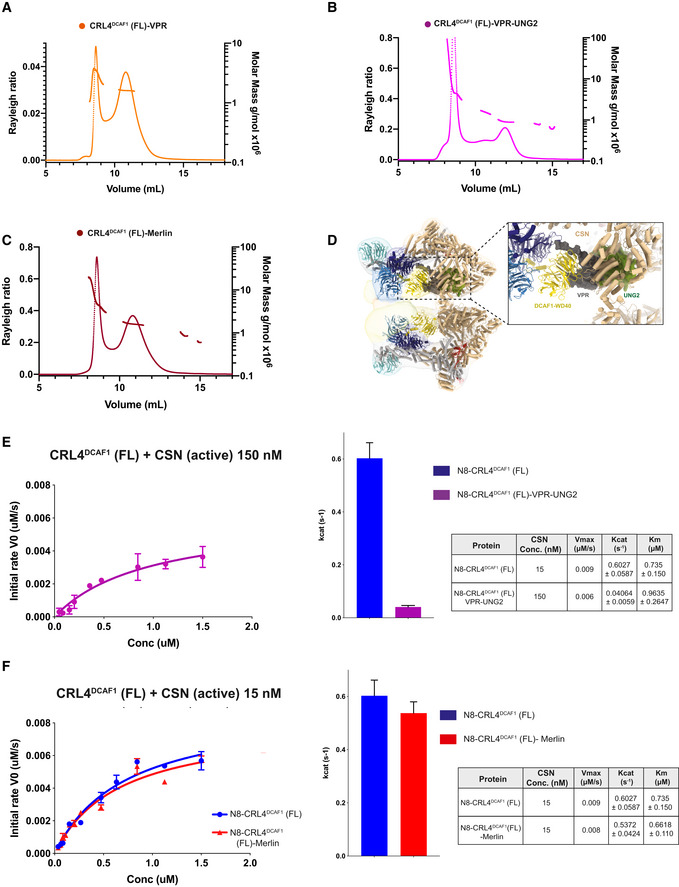
SEC‐MALS analysis including the peaks eluting near the SEC column void volume of (A) CRL4DCAF1‐VPR, (B) CRL4DCAF1‐VPR‐UNG2, and (C) CRL4DCAF1‐MERLIN. The chromatogram shows the Rayleigh ratio curves together with the molar mass (MDa) determined by MALS.
- D
A close‐up view of The CRL4DCAF1‐CSN cryo‐EM map with fitted crystal structures of CUL4A (gray), RBX1 (red) (PDB
2HYE ), DDB1 (blue)‐DCAF1 (WD40) (yellow), VPR (dark gray), and UNG2 (green) (PDB5JK7 ). - E, F
Fluorescence polarization assay investigating the catalytic activity of CSN on N8‐CRL4DCAF1(FL) when bound to (E) VPR‐UNG2 or (F) MERLIN. Initial rates (M/s) are plotted versus concentrations (M) of N8‐CRL4DCAF1(FL)‐VPR‐UNG2 (magenta), N8‐CRL4DCAF1(FL) (blue), and N8‐CRL4DCAF1(FL)‐MERLIN (red). Column representation of Kcat values, and table summarizes KM, Kcat, and Vmax values calculated from the curves (biological replicates, n = 3, mean ± SD).
References
-
- Angers S, Li T, Yi X, MacCoss MJ, Moon RT, Zheng N (2006) Molecular architecture and assembly of the DDB1‐CUL4A ubiquitin ligase machinery. Nature 443: 590–593 - PubMed
Publication types
MeSH terms
Substances
Associated data
- Actions
LinkOut - more resources
Full Text Sources
