. 2022 Jan;35(1):e4615.
doi: 10.1002/nbm.4615. Epub 2021 Oct 1.

Whole-brain high-resolution metabolite mapping with 3D compressed-sensing SENSE low-rank 1 H FID-MRSI

Affiliations

Whole-brain high-resolution metabolite mapping with 3D compressed-sensing SENSE low-rank 1 H FID-MRSI

Antoine Klauser et al. NMR Biomed. 2022 Jan.

Abstract

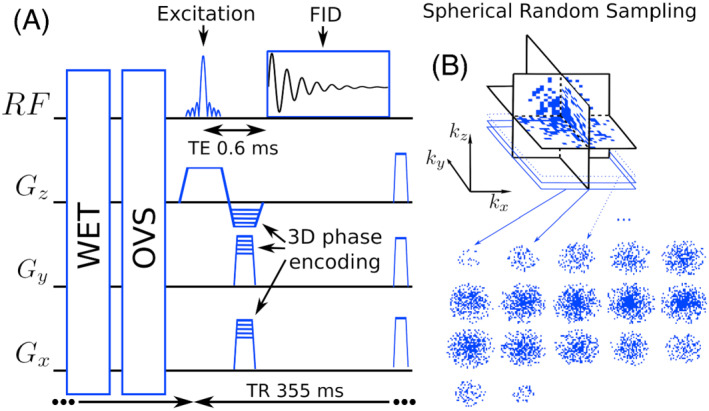
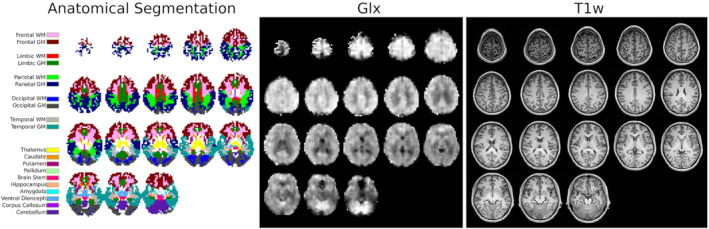
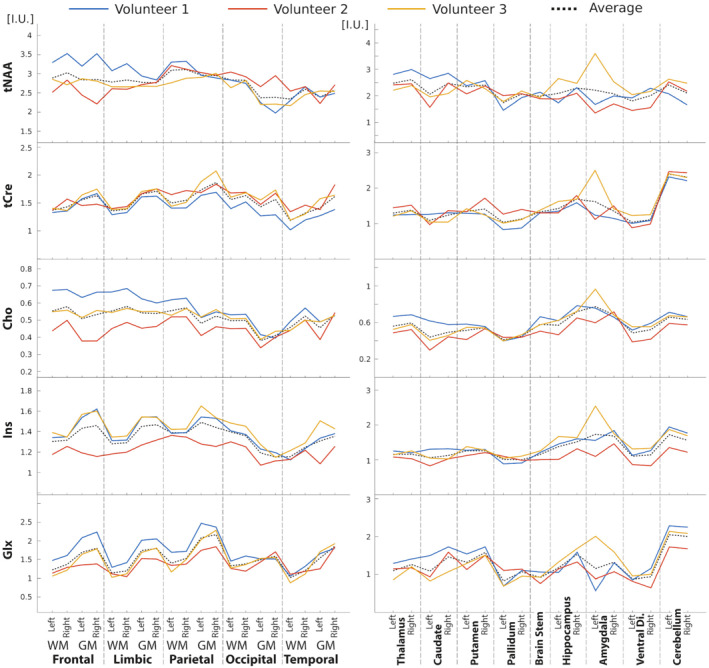
There is a growing interest in the neuroscience community to map the distribution of brain metabolites in vivo. Magnetic resonance spectroscopic imaging (MRSI) is often limited by either a poor spatial resolution and/or a long acquisition time, which severely restricts its applications for clinical and research purposes. Building on a recently developed technique of acquisition-reconstruction for 2D MRSI, we combined a fast Cartesian 1 H-FID-MRSI acquisition sequence, compressed-sensing acceleration, and low-rank total-generalized-variation constrained reconstruction to produce 3D high-resolution whole-brain MRSI with a significant acquisition time reduction. We first evaluated the acceleration performance using retrospective undersampling of a fully sampled dataset. Second, a 20 min accelerated MRSI acquisition was performed on three healthy volunteers, resulting in metabolite maps with 5 mm isotropic resolution. The metabolite maps exhibited the detailed neurochemical composition of all brain regions and revealed parts of the underlying brain anatomy. The latter assessment used previous reported knowledge and a atlas-based analysis to show consistency of the concentration contrasts and ratio across all brain regions. These results acquired on a clinical 3 T MRI scanner successfully combined 3D 1 H-FID-MRSI with a constrained reconstruction to produce detailed mapping of metabolite concentrations at high resolution over the whole brain, with an acquisition time suitable for clinical or research settings.

Keywords: 3D magnetic resonance spectroscopic imaging; SENSE; acceleration; brain metabolites; compressed sensing; high-field MRI; low rank; whole-brain spectroscopy.


Figures

FIGURE 1
FIGURE 1
Left, schematic of the FID‐MRSI sequence with 3D phase encoding preceded by the WET and OVS sequence blocks. Right, an example of 3D k‐space undersampled by a factor of 3.5
FIGURE 2
FIGURE 2
Top, 3D FID‐MRSI reconstructed metabolite volumes with retrospective acceleration. The fully sampled acquisition (No acceleration) was acquired in 70 min and acceleration factors correspond to k‐space undersampling and reducing acquisition time accordingly (e.g. ×3, 24 min; ×6, 12 min). The color map was scaled individually for each metabolite range from 0 to the 95th percentile. Bottom, the normalized RMSE and SSIM computed for each metabolite map at all acceleration factors relative to the unaccelerated result. Sample spectra from two distinct locations are displayed and exhibit very little variation with the acceleration (no, 3, 5). The LCModel fits are shown with the fitting residuals. Bottom left, the RMS of the residuals averaged over the whole brain remains constant with the acceleration
FIGURE 3
FIGURE 3
CS‐SENSE‐LR 3D FID‐MRSI measured on a healthy volunteer (Volunteer 1) with 5 mm isotropic resolution in 20 min with acceleration factor 3.5 resulted in tNAA, tCre, Cho, Ins, and Glx maps. The color scale for each map is given in I.U. The sagittal T 1‐weighted image (bottom right) shows the location of the excitation slab (blue overlay)
FIGURE 4
FIGURE 4
Comparison of high‐contrast Cho and Glx 3D maps measured with CS‐SENSE‐LR FID‐MRSI on three healthy volunteers (Volunteers 1, 2, and 3) with 5 mm isotropic resolution in 20 min (acceleration factor 3.5). The color scale is given in I.U. for the respective metabolite concentrations. Sample spectra originating from four distinct locations are shown for each volunteer. Cho and Glx signal amplitudes in the spectra match the metabolite distribution observable on the maps. Metabolite ratio maps of the same volunteers and the corresponding CRLB and SNR maps estimated using LCModel are shown in Supporting Information Figure S10
FIGURE 5
FIGURE 5
Left, the anatomical atlas registered to Volunteer 1 is shown with voxel labeling corresponding to the dominant partial volume. Center, the Glx concentration 3D map is shown for qualitative comparison in a gray scale. Right, the MPRAGE T 1‐weighted images used to segment the volunteer anatomic parts
FIGURE 6
FIGURE 6
Atlas metabolite content across three healthy volunteers based on anatomical segmentation (Figure 5). Lines correspond to the metabolite concentration estimated for all anatomical area for each of the three volunteers. The dashed line represents the mean values across the three volunteers. Metabolite levels are expressed in I.U. Left‐hand plots represent concentrations in WM or GM in each cerebral lobe while right‐hand plots show concentrations in the deep GM
FIGURE 7
FIGURE 7
Comparison of the atlas metabolite‐ratio content with previously published results. Line‐connected points correspond to the metabolite average ratio from Volunteers 1 to 3 (individual data presented in Figure 6). The legend indicates the corresponding study and the type of acquisition: whole‐brain MRSI or single‐voxel spectroscopy (SVS)

Similar articles

Cited by

References

    1. Duyn JH, Gillen J, Sobering G, Zijl PC, Moonen CT. Multisection proton MR spectroscopic imaging of the brain. Radiology. 1993;188:277‐282. - PubMed
    1. Tedeschi G, Bertolino A, Righini A, et al. Brain regional distribution pattern of metabolite signal intensities in young adults by proton magnetic resonance spectroscopic imaging. Neurology. 1995;45:1384‐1391. - PubMed
    1. Posse S, DeCarli C, Le Bihan D. Three‐dimensional echo‐planar MR spectroscopic imaging at short echo times in the human brain. Radiology. 1994;192:733‐738. - PubMed
    1. Adalsteinsson E, Irarrazabal P, Topp S, Meyer C, Macovski A, Spielman DM. Volumetric spectroscopic imaging with spiral‐based k‐space trajectories. Magn Reson Med. 1998;39:889‐898. - PubMed
    1. Ebel A, Maudsley AA. Improved spectral quality for 3D MR spectroscopic imaging using a high spatial resolution acquisition strategy. Magn Reson Imaging. 2003;21:113‐120. - PubMed

Publication types