. 2021 Oct;6(64):eabg7836.
doi: 10.1126/sciimmunol.abg7836. Epub 2021 Sep 2.

A reservoir of stem-like CD8+ T cells in the tumor-draining lymph node preserves the ongoing antitumor immune response

Affiliations

A reservoir of stem-like CD8+ T cells in the tumor-draining lymph node preserves the ongoing antitumor immune response

Kelli A Connolly et al. Sci Immunol. 2021 Oct.

Abstract

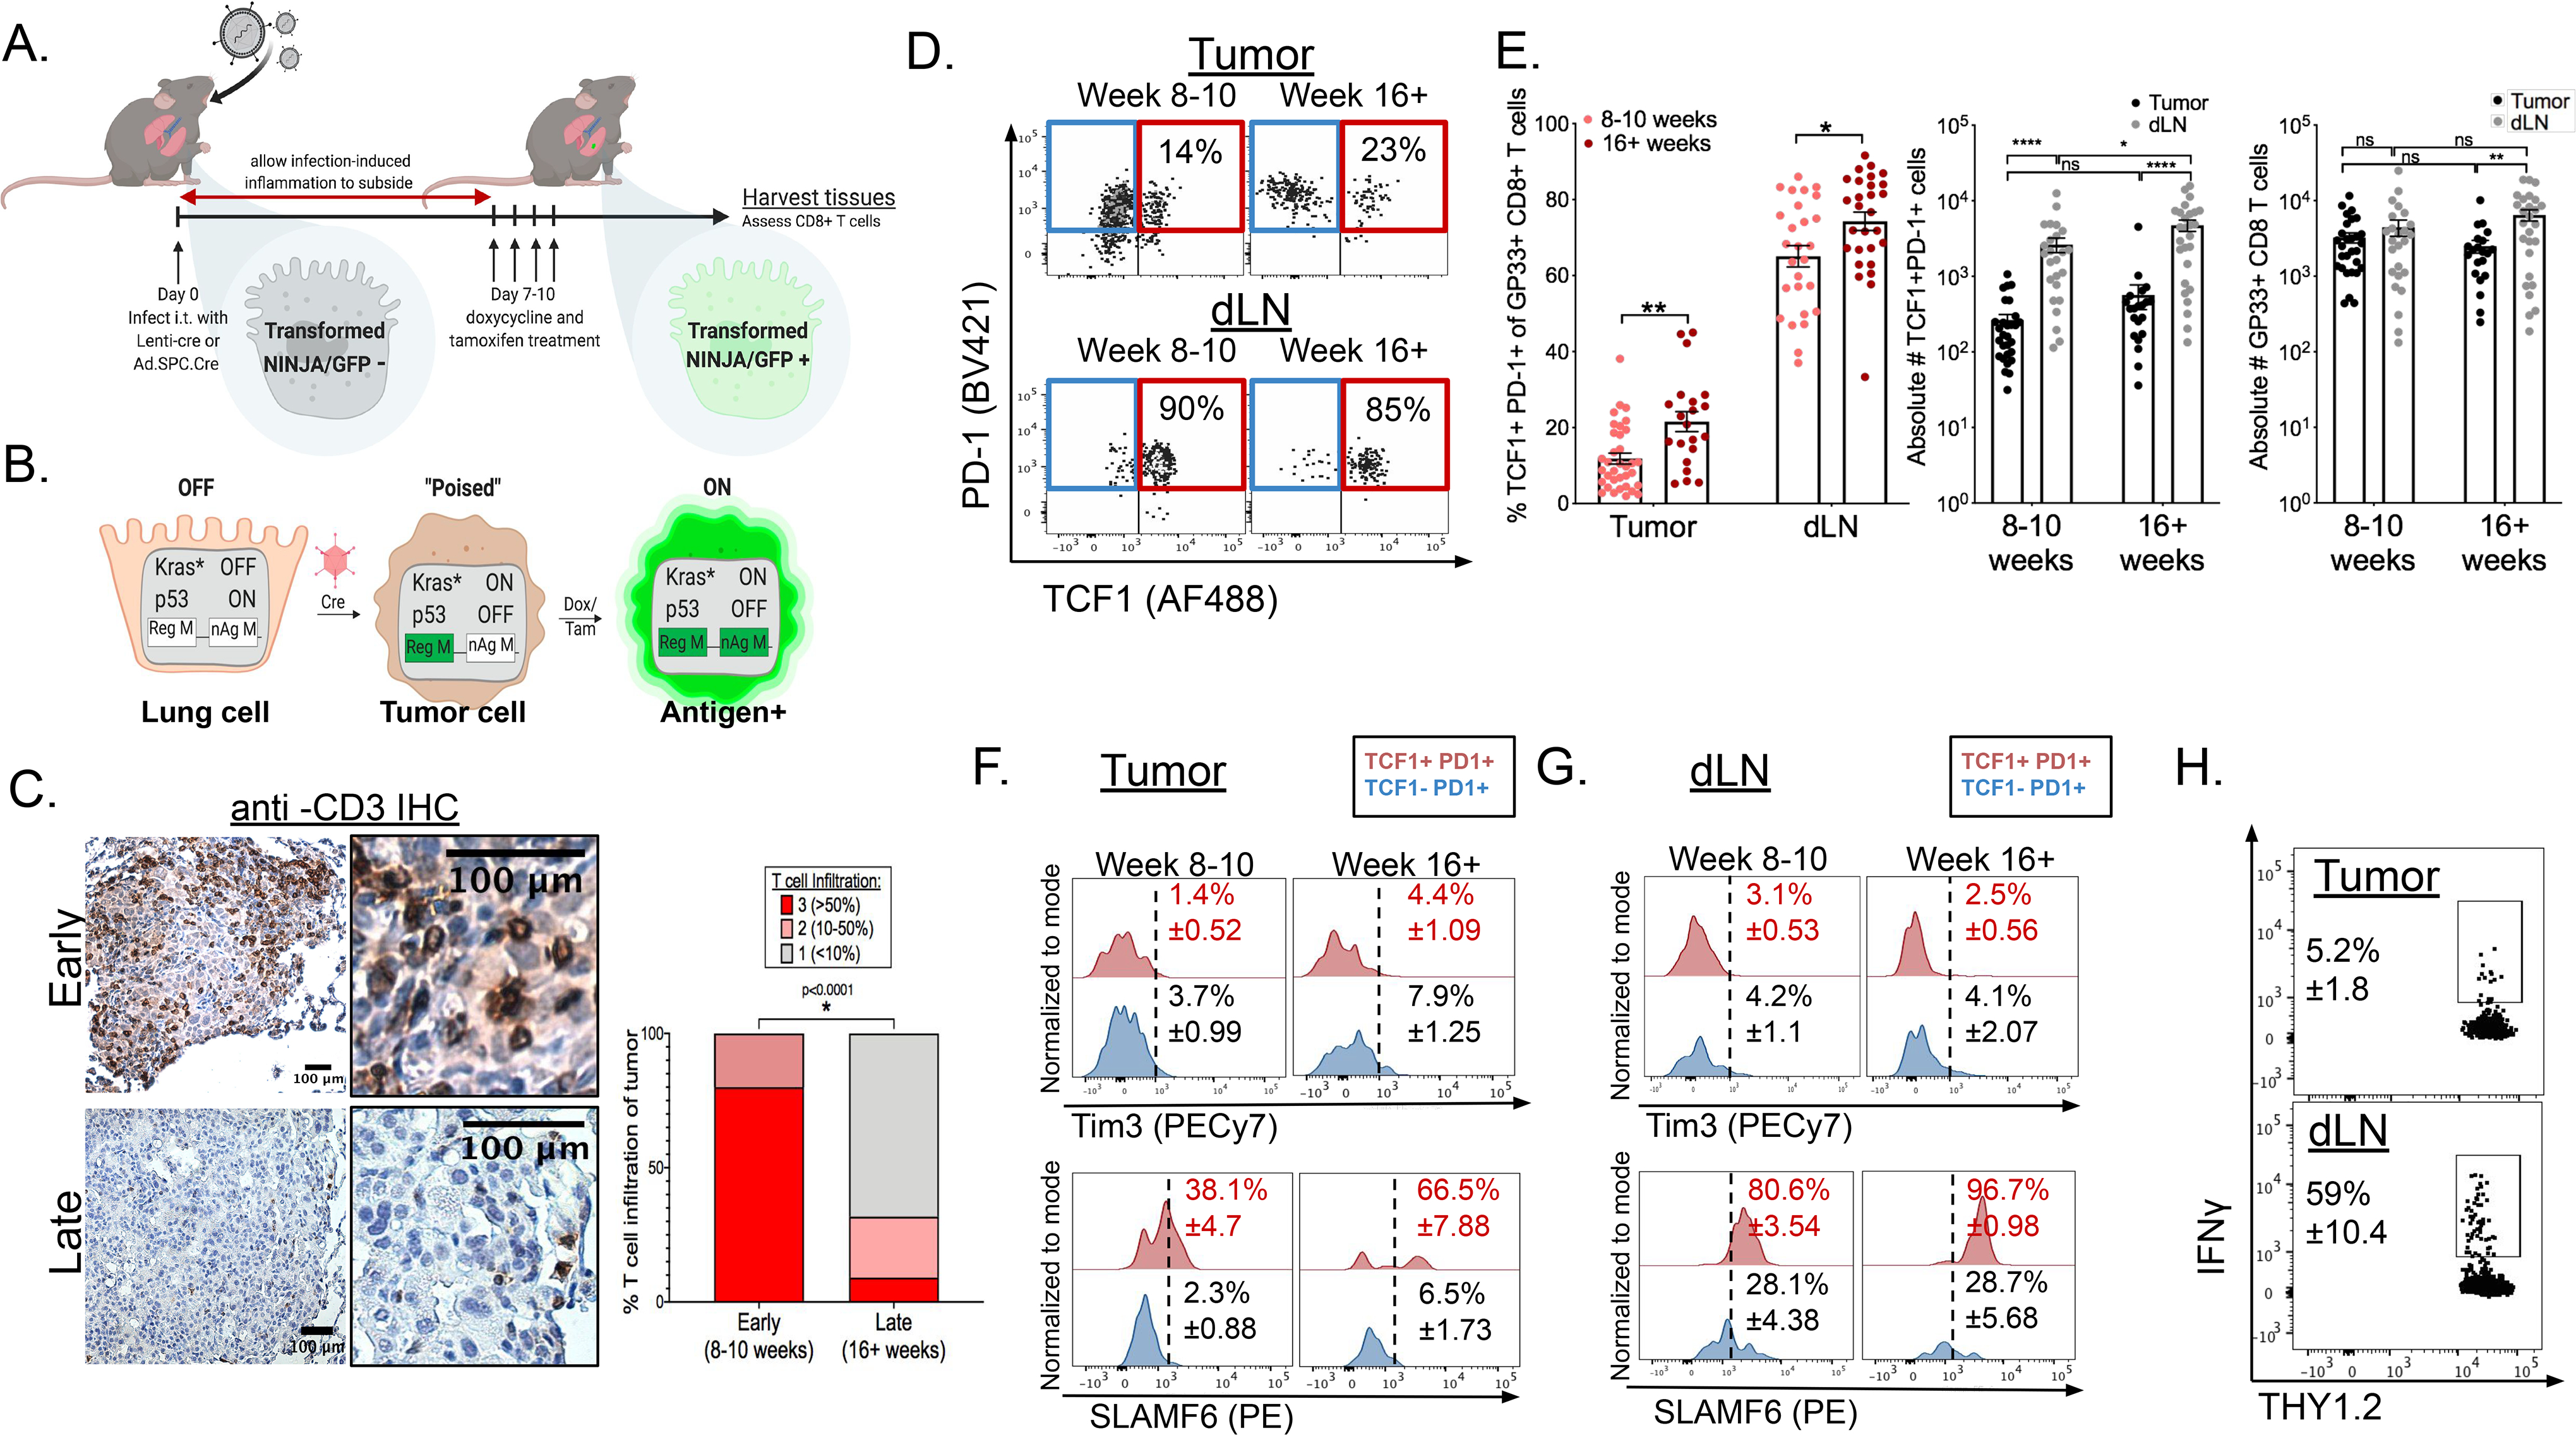
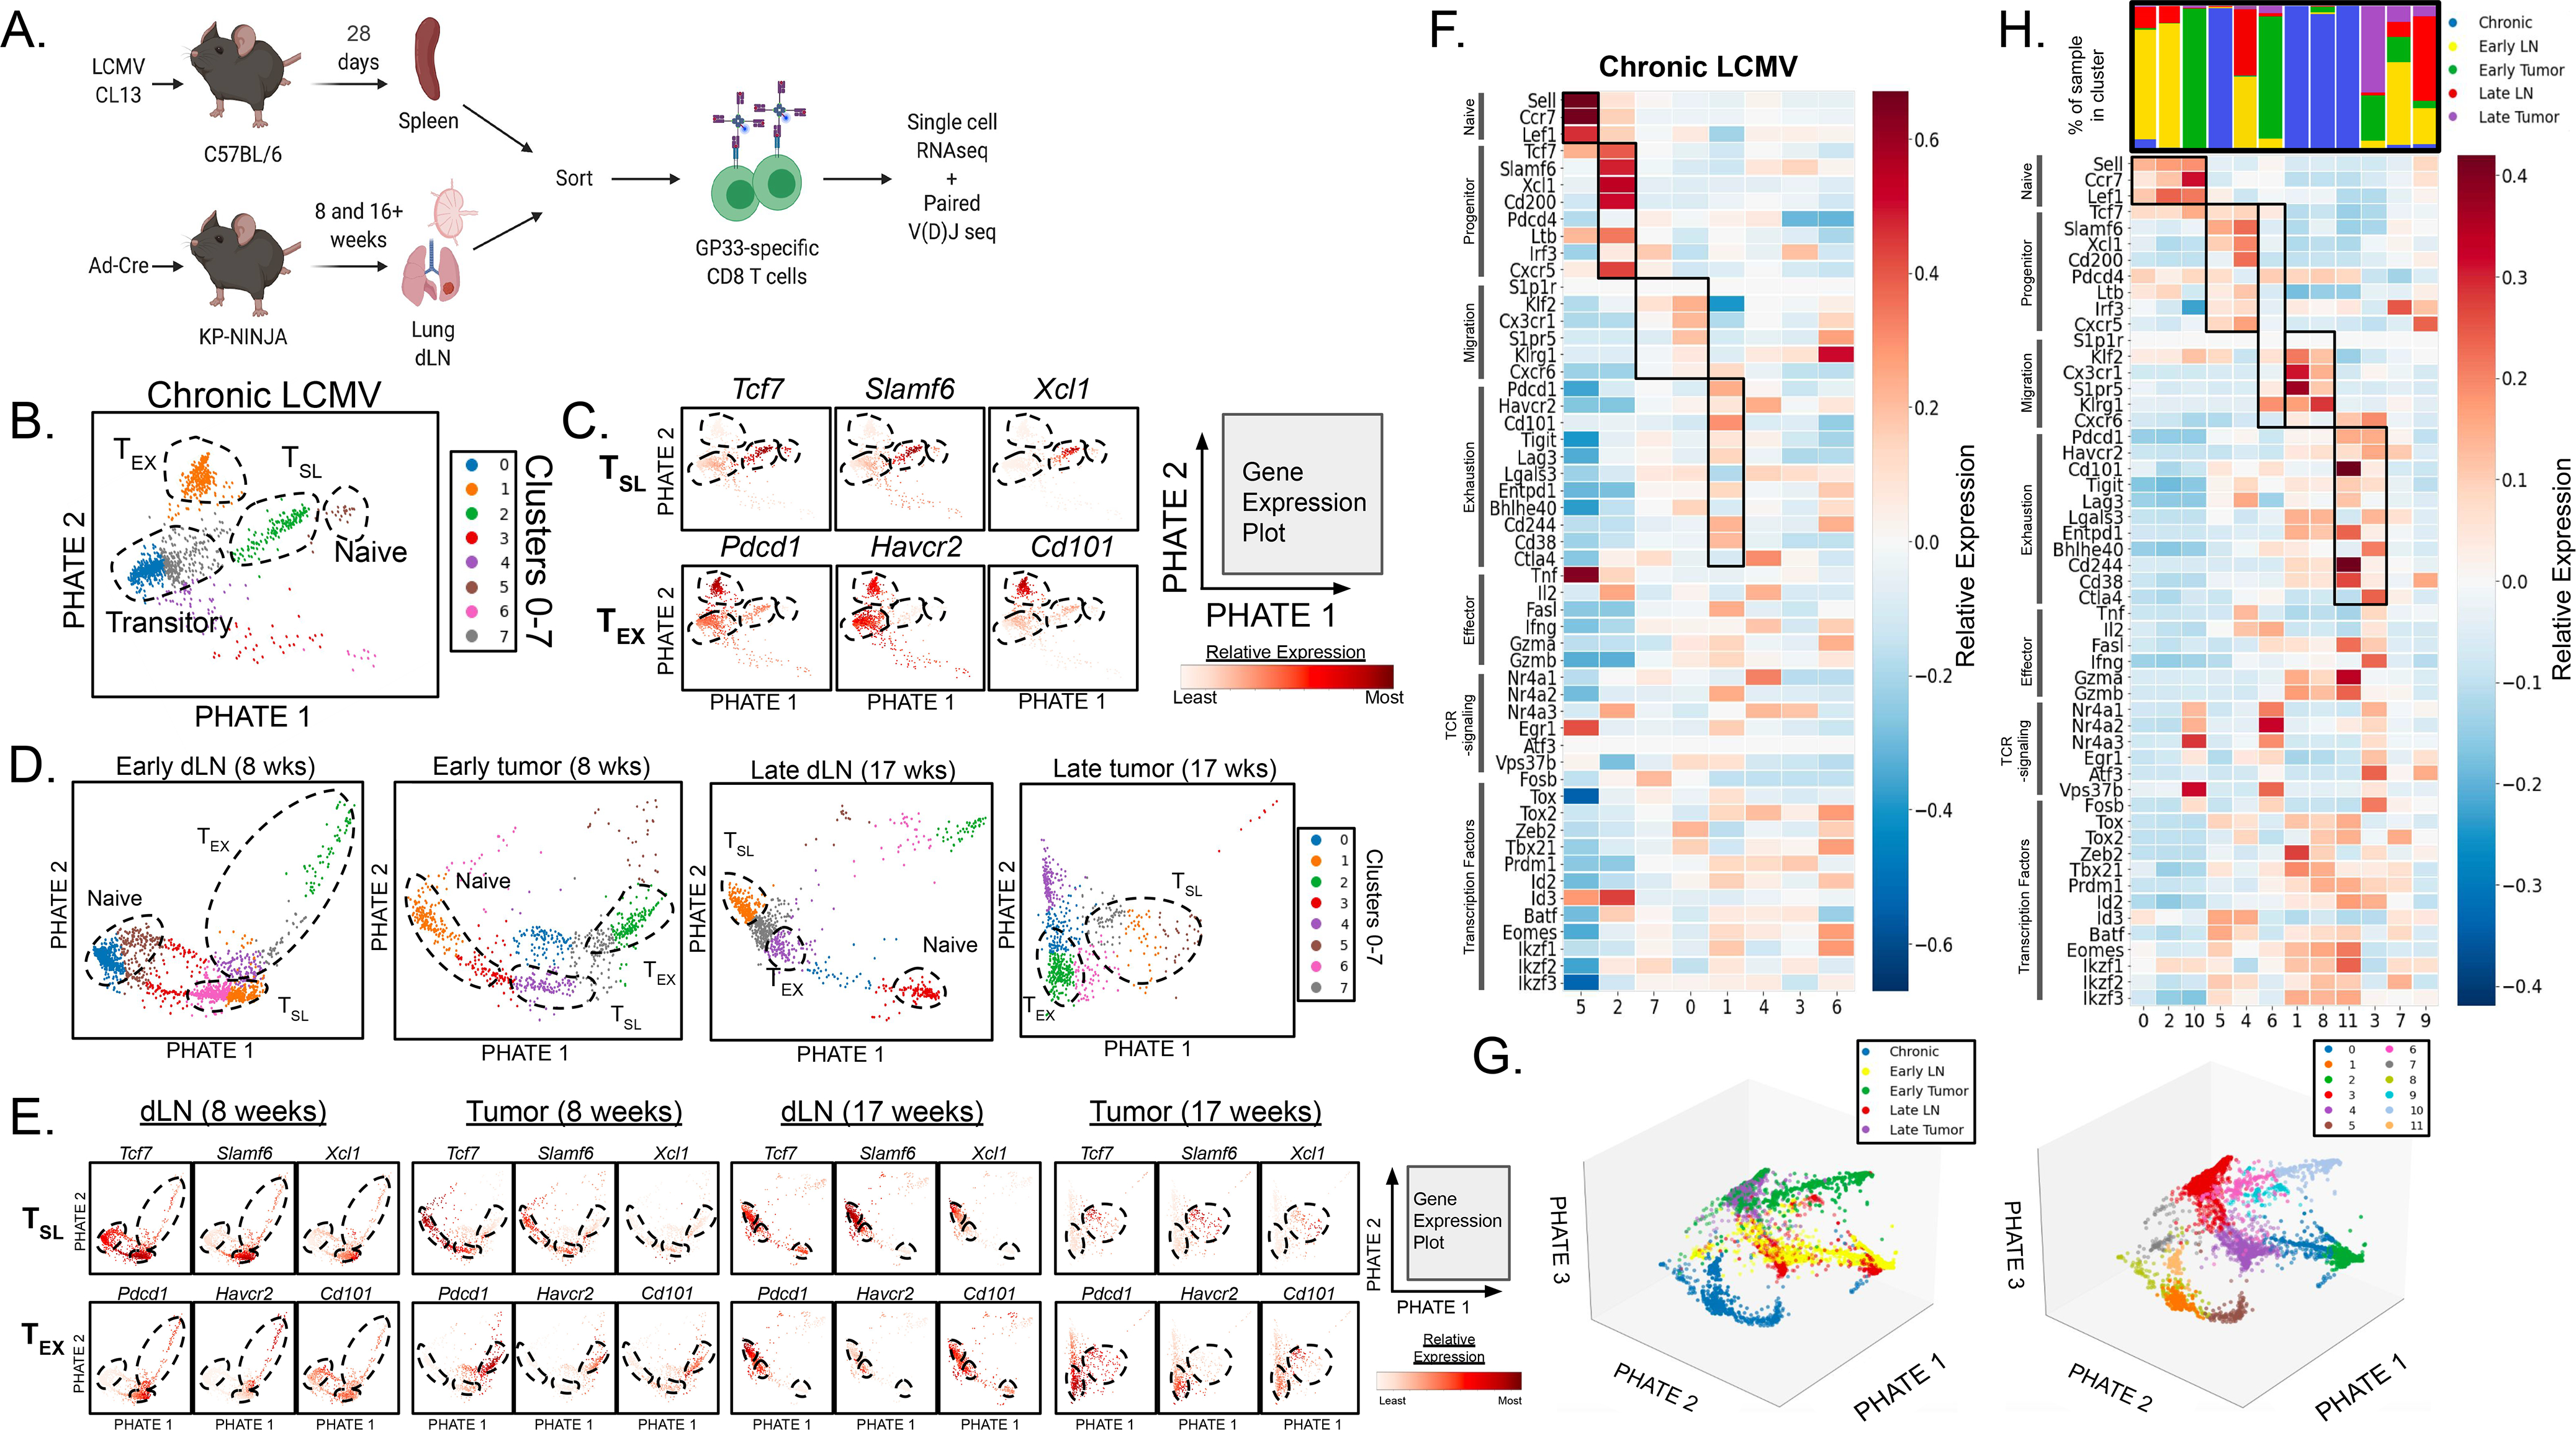
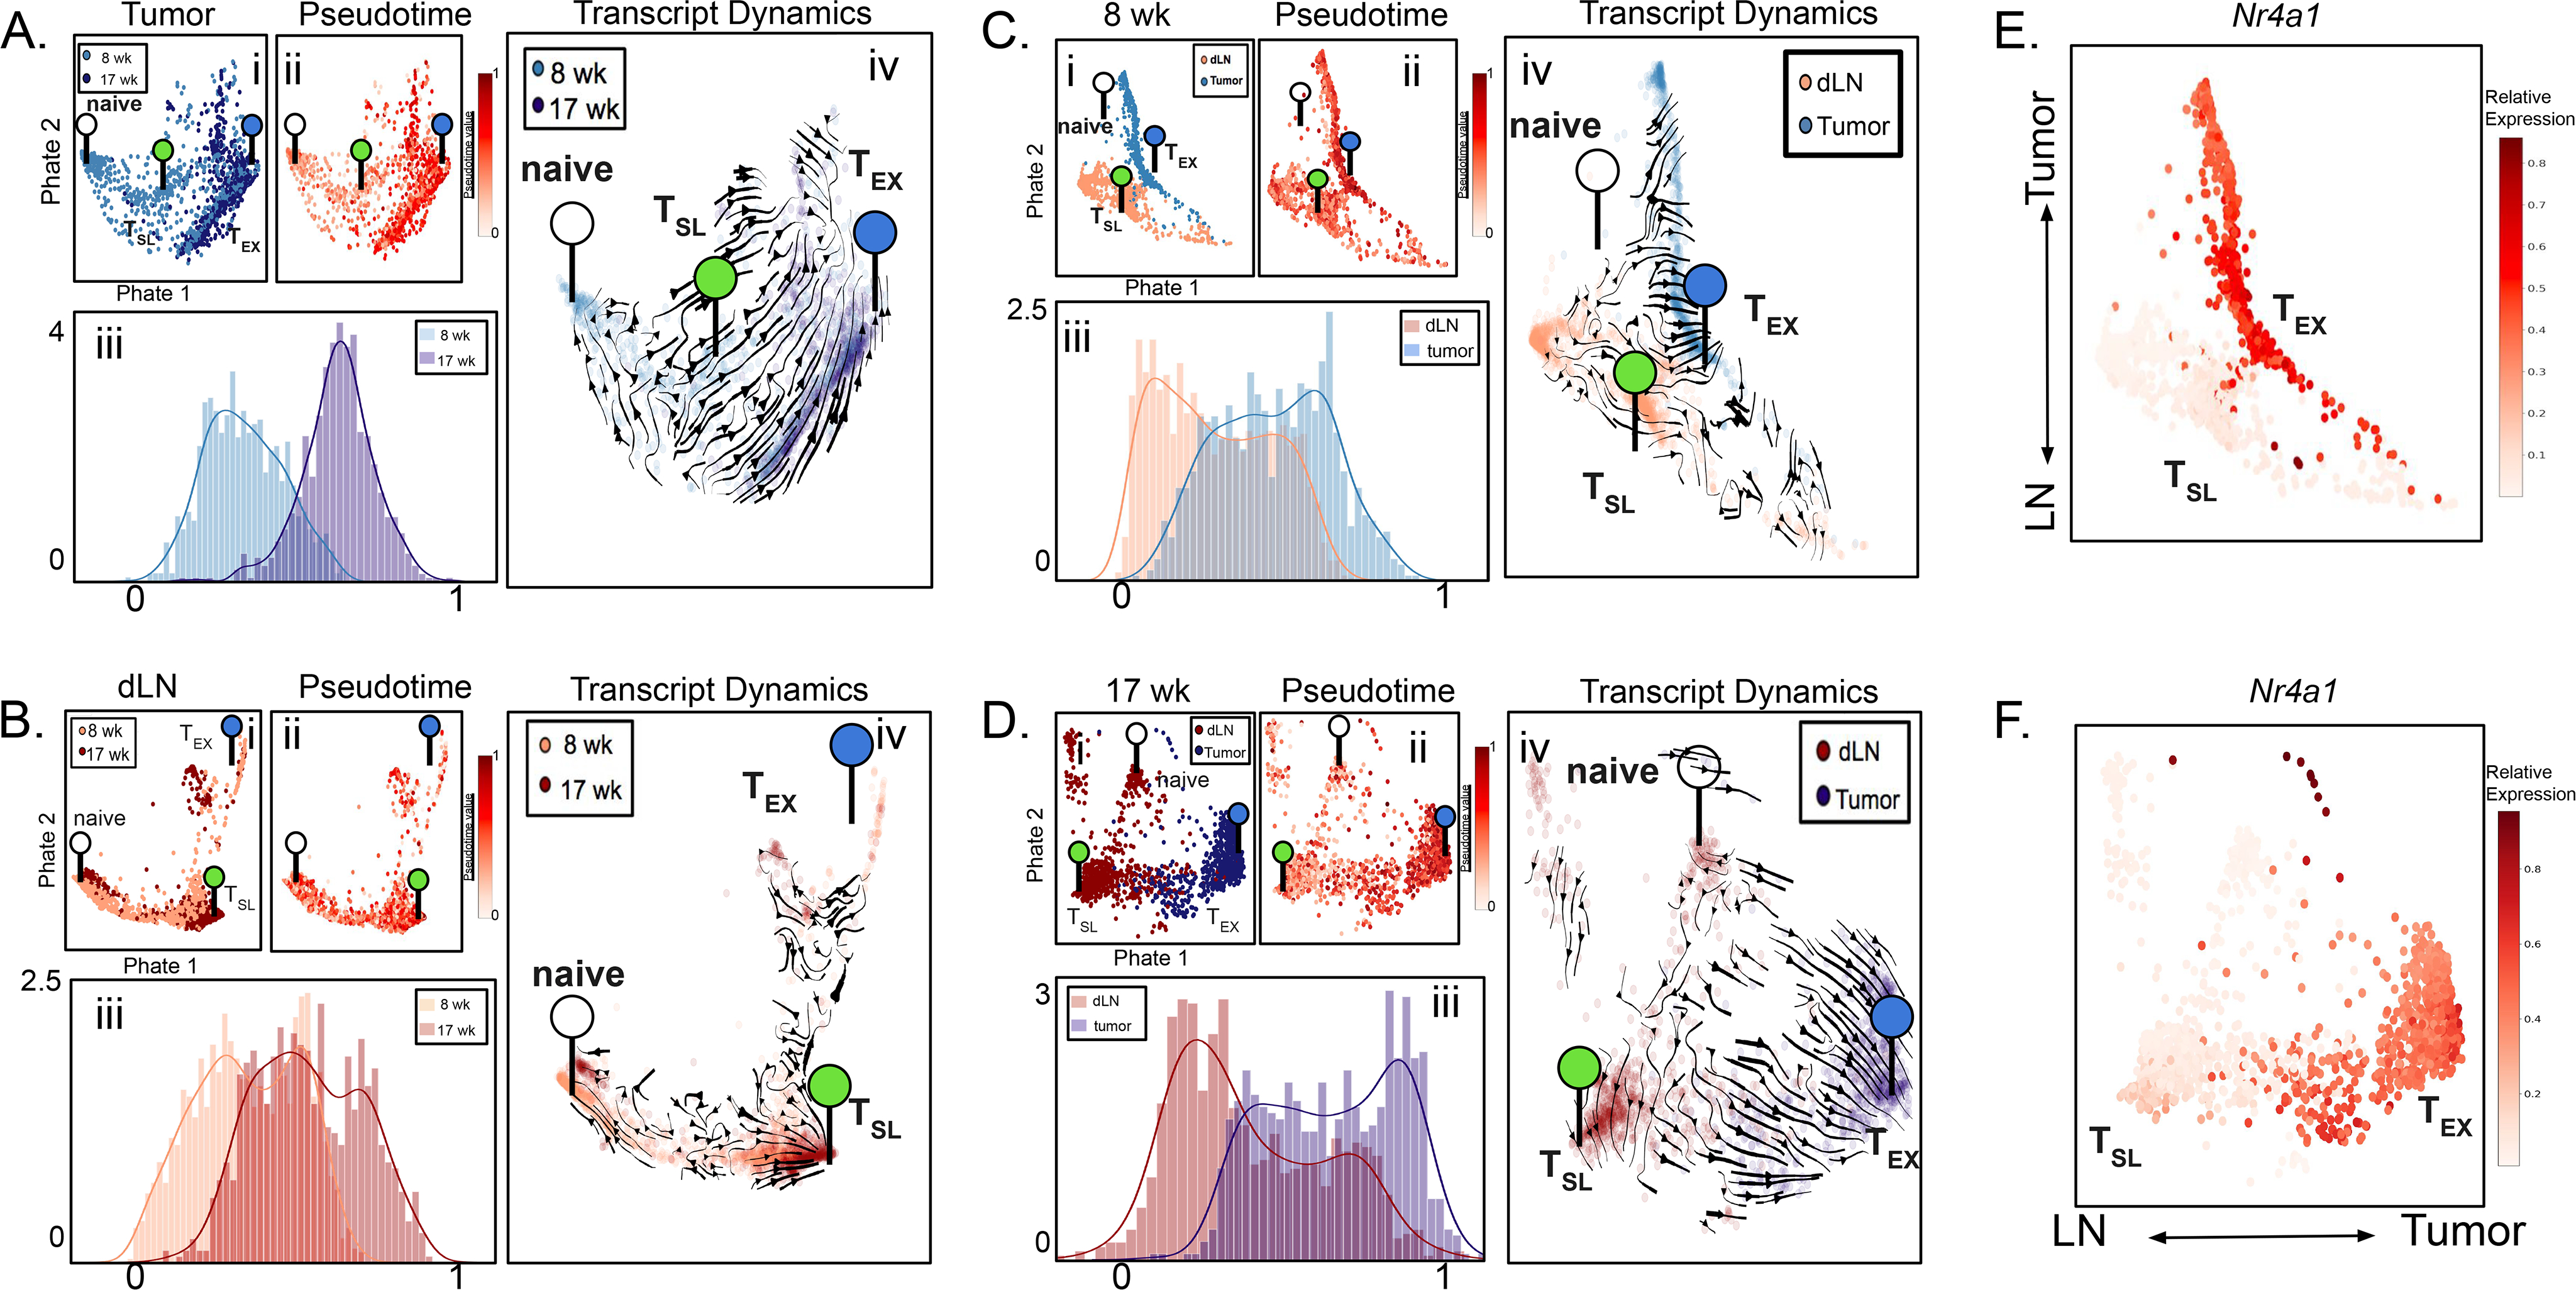
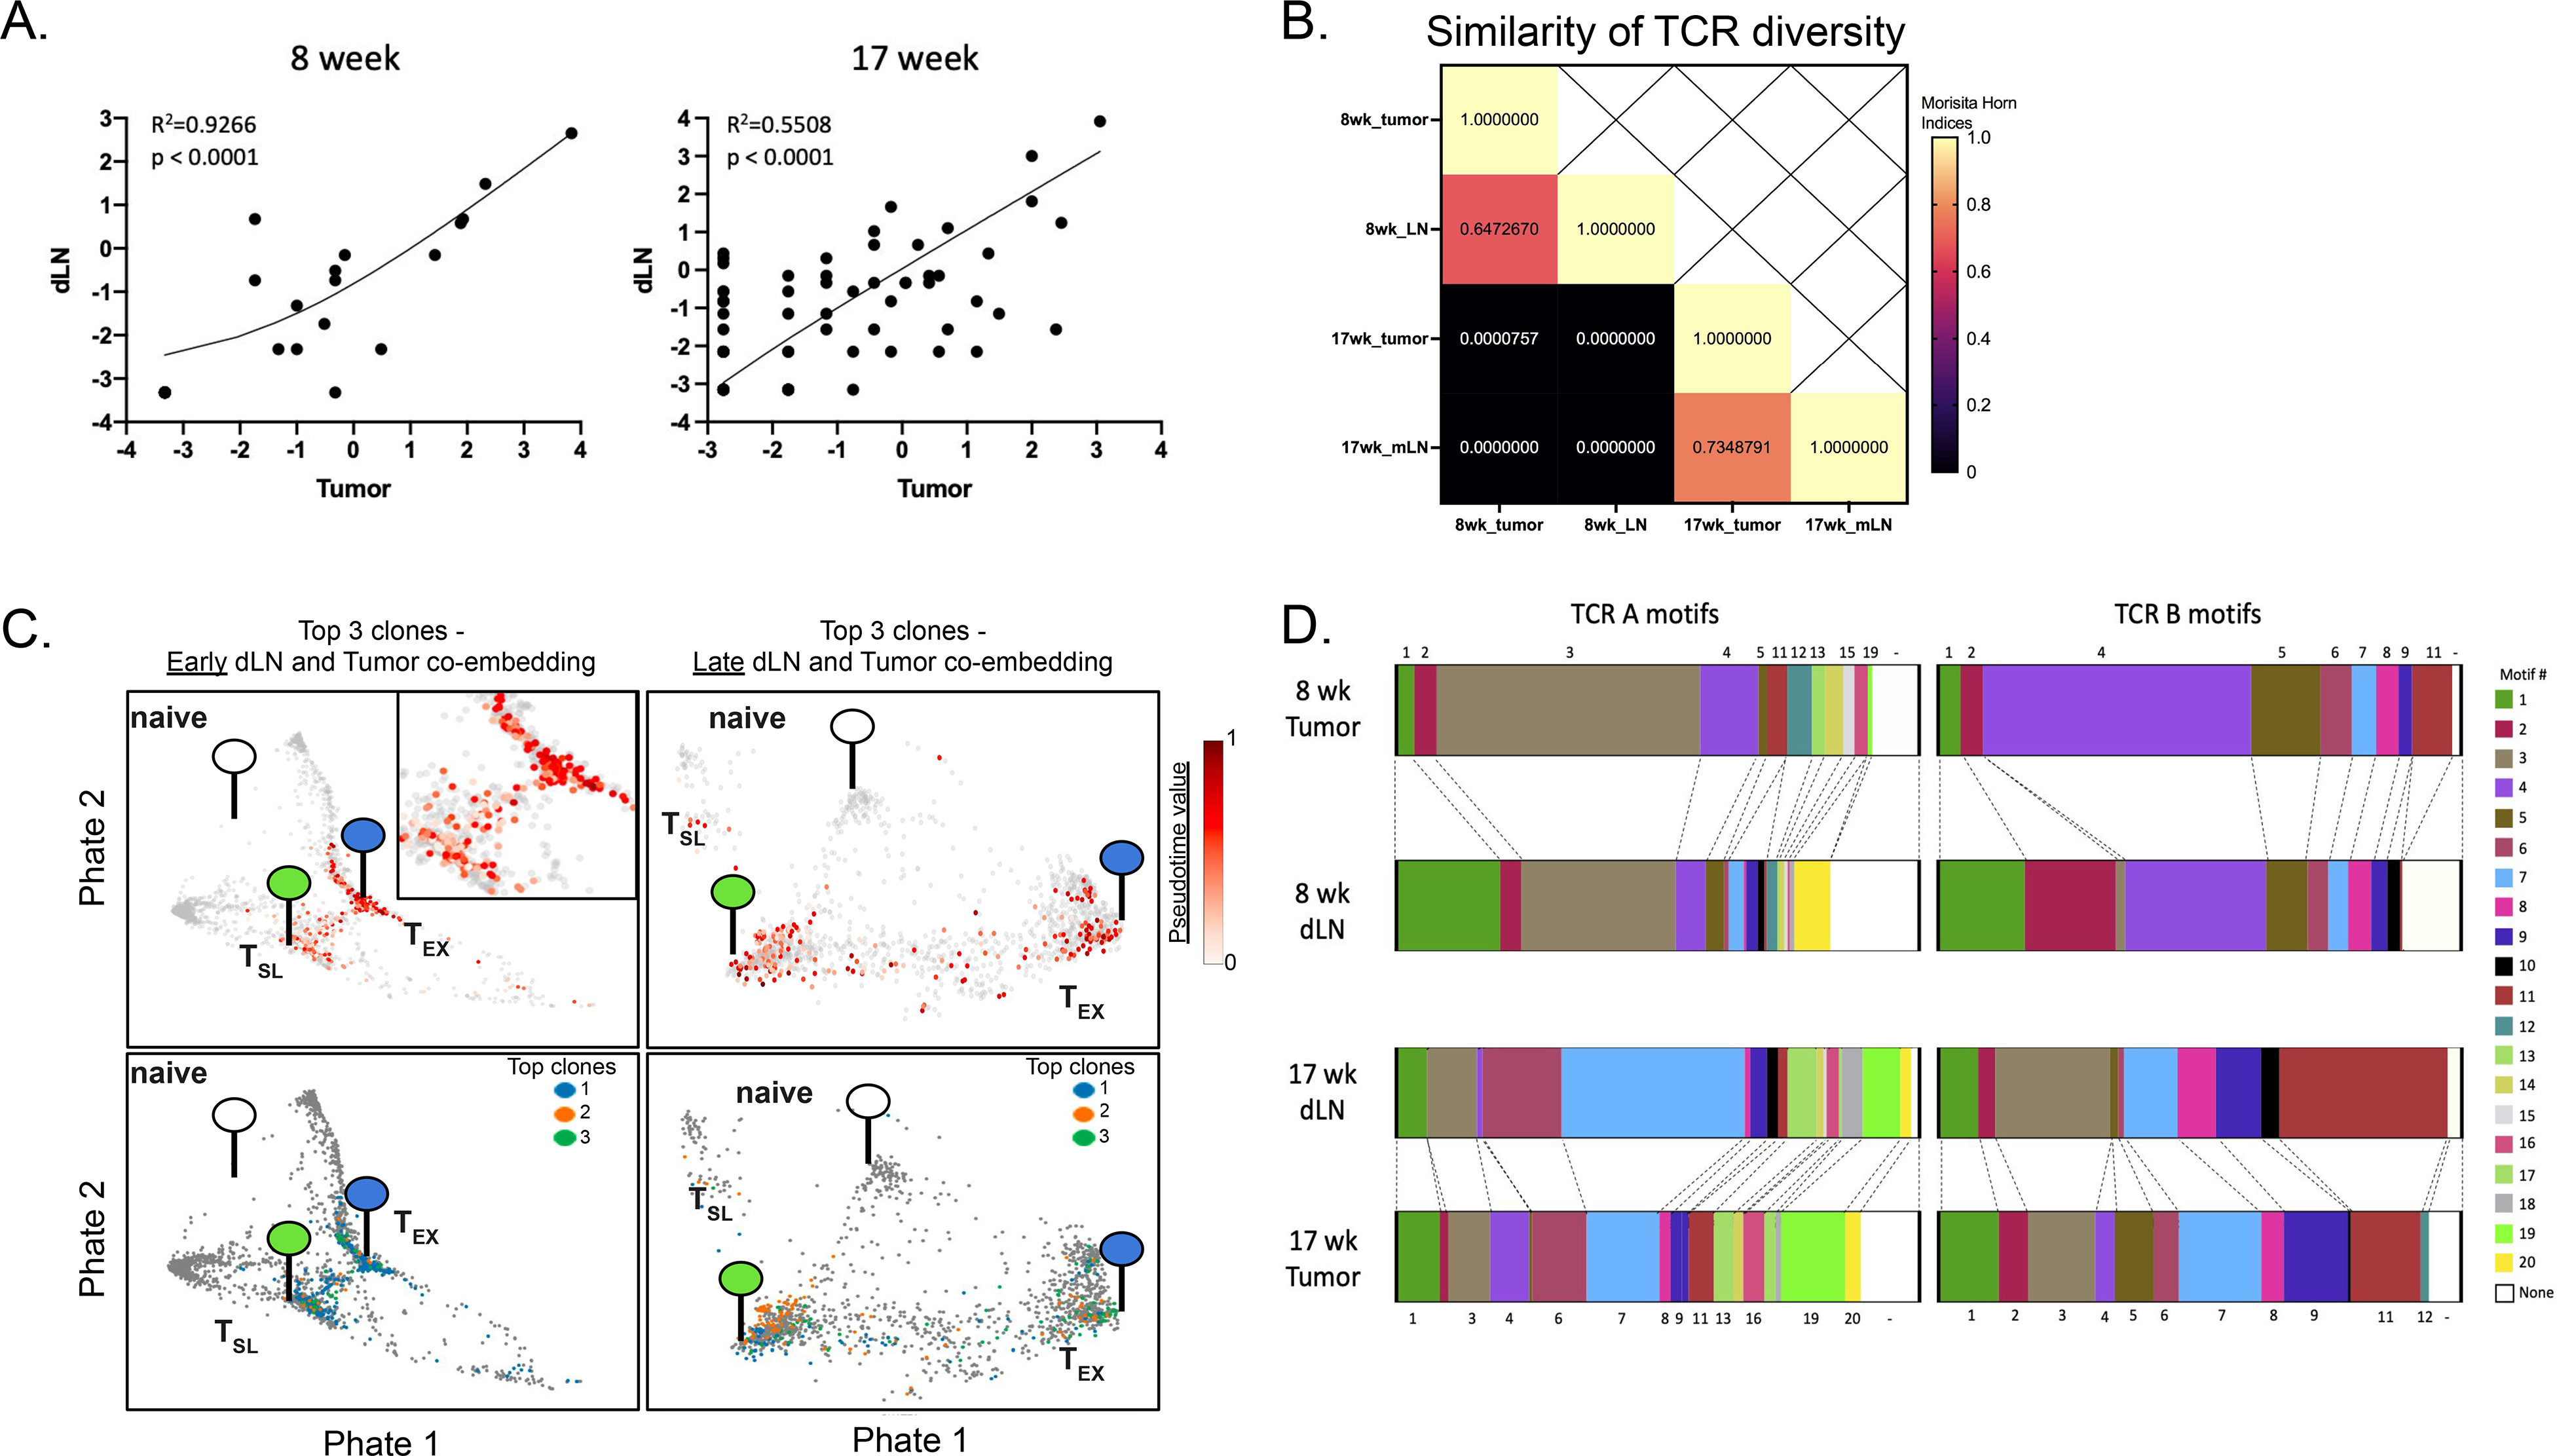
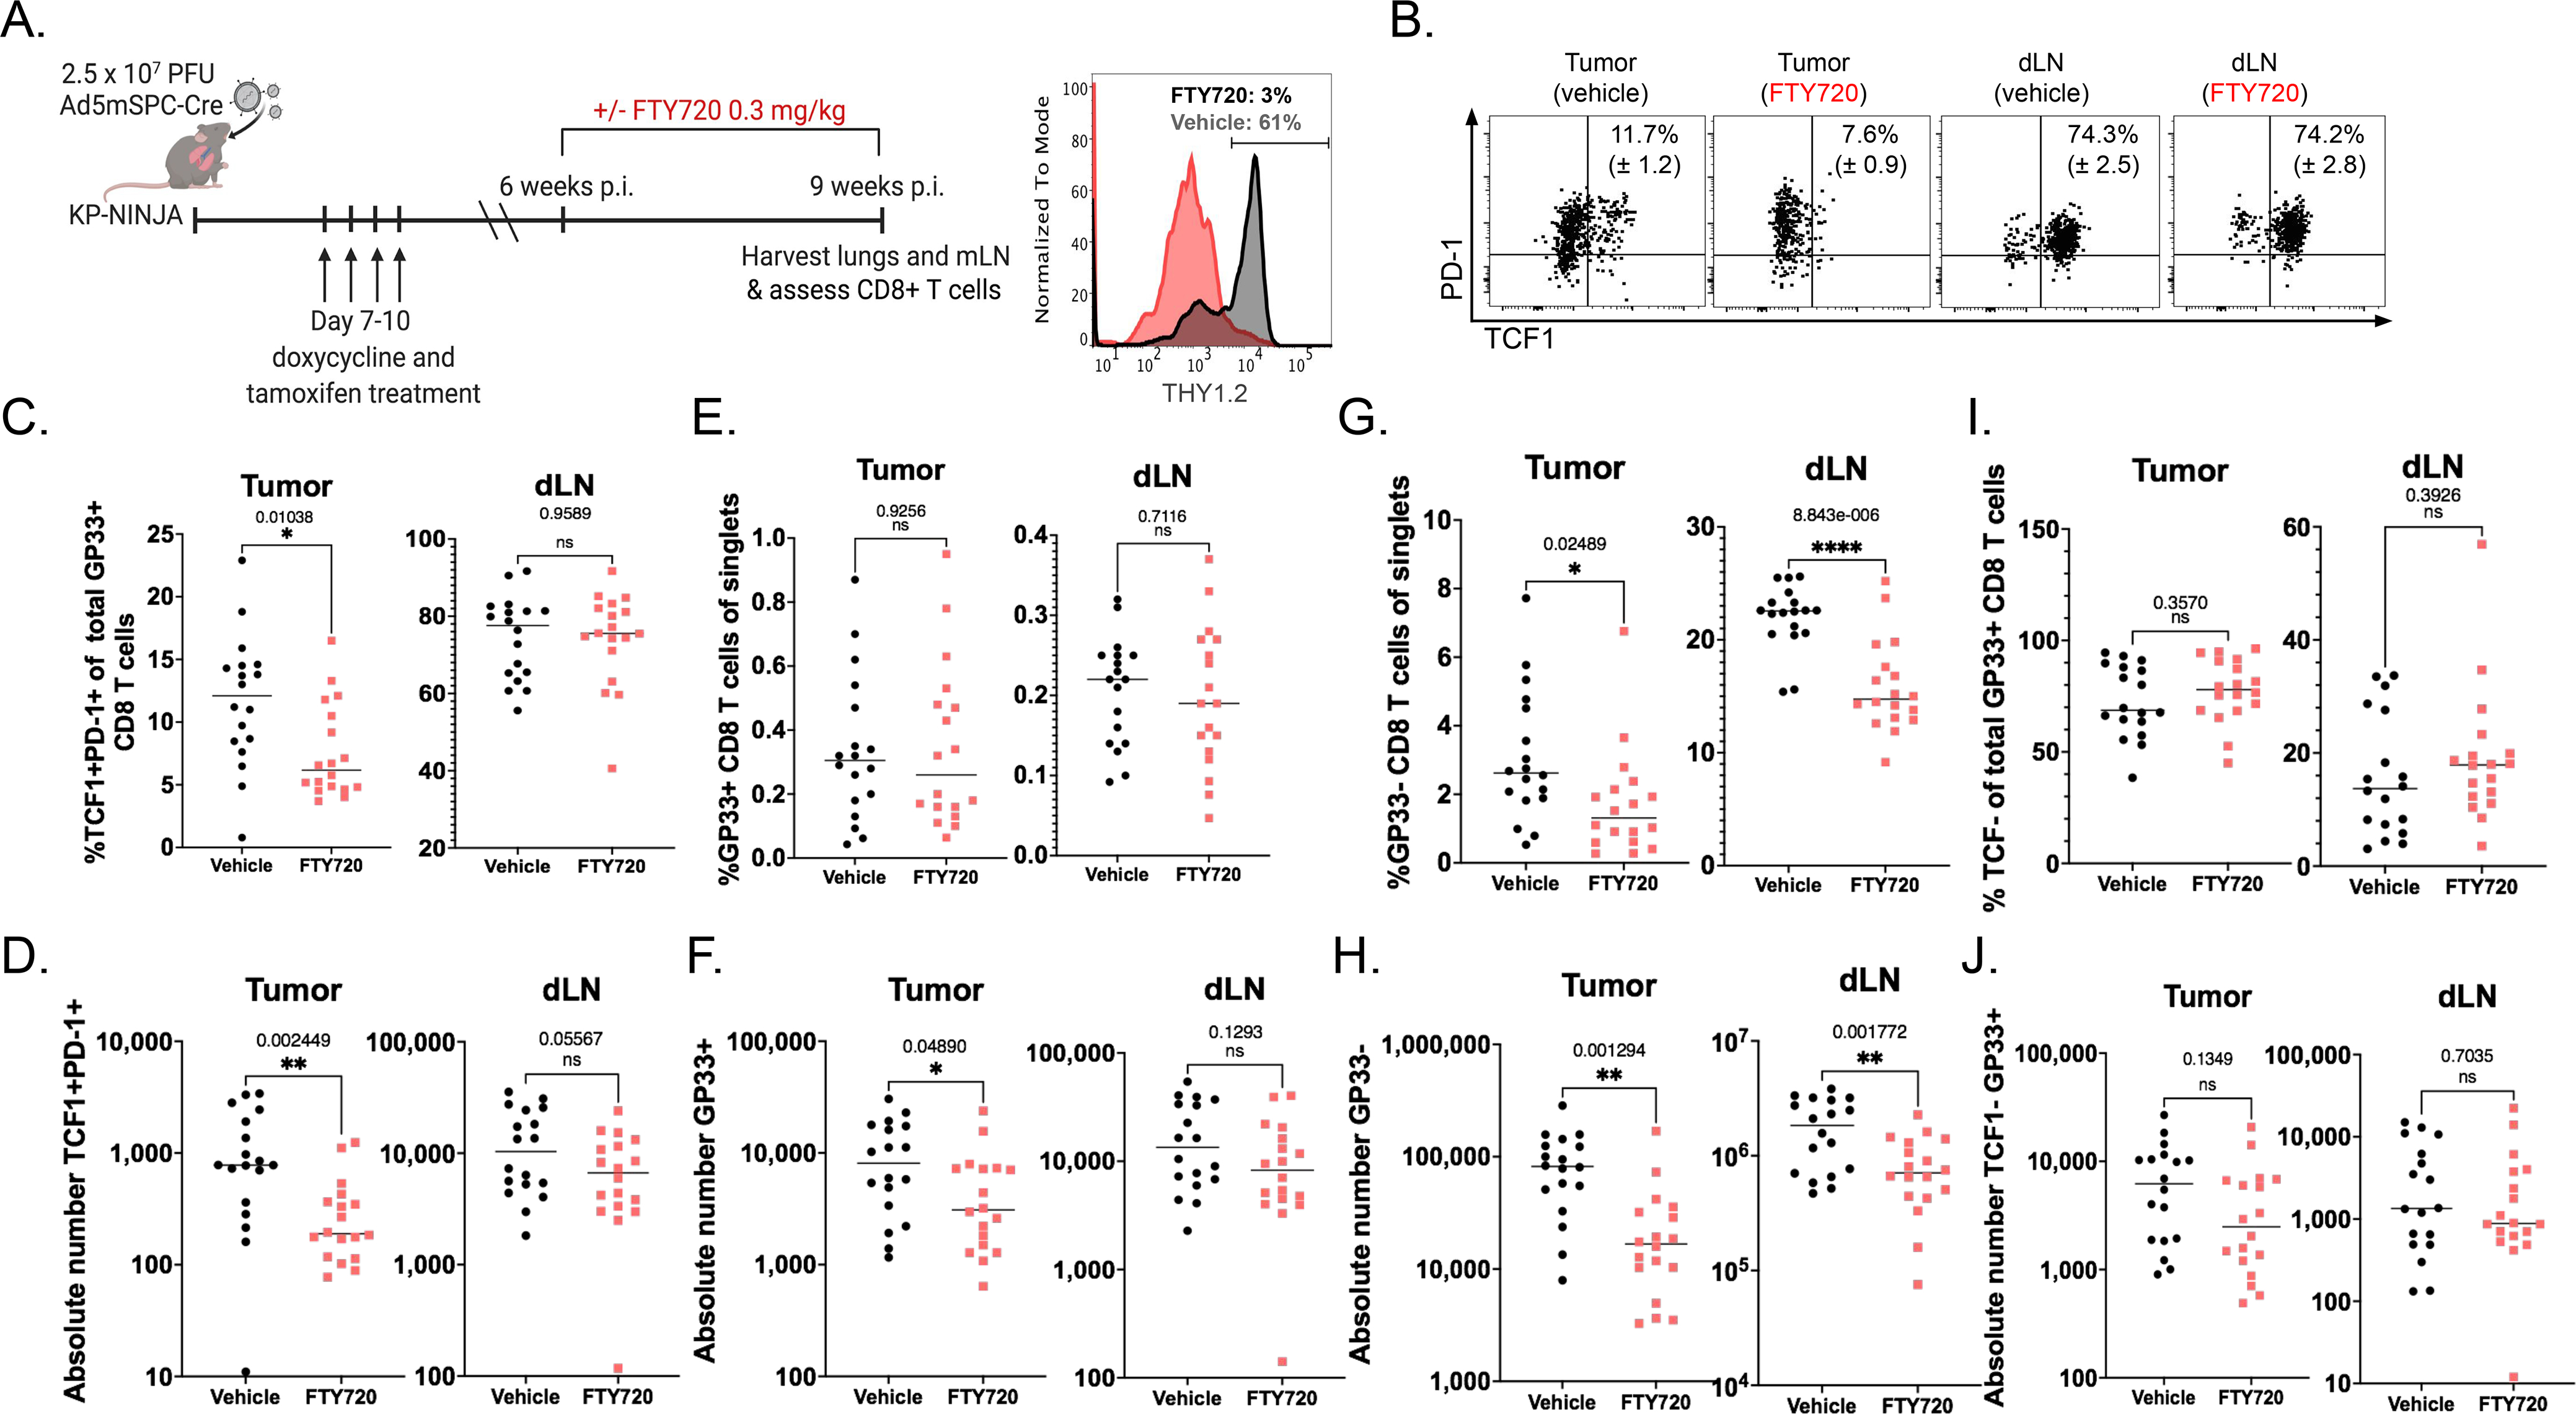
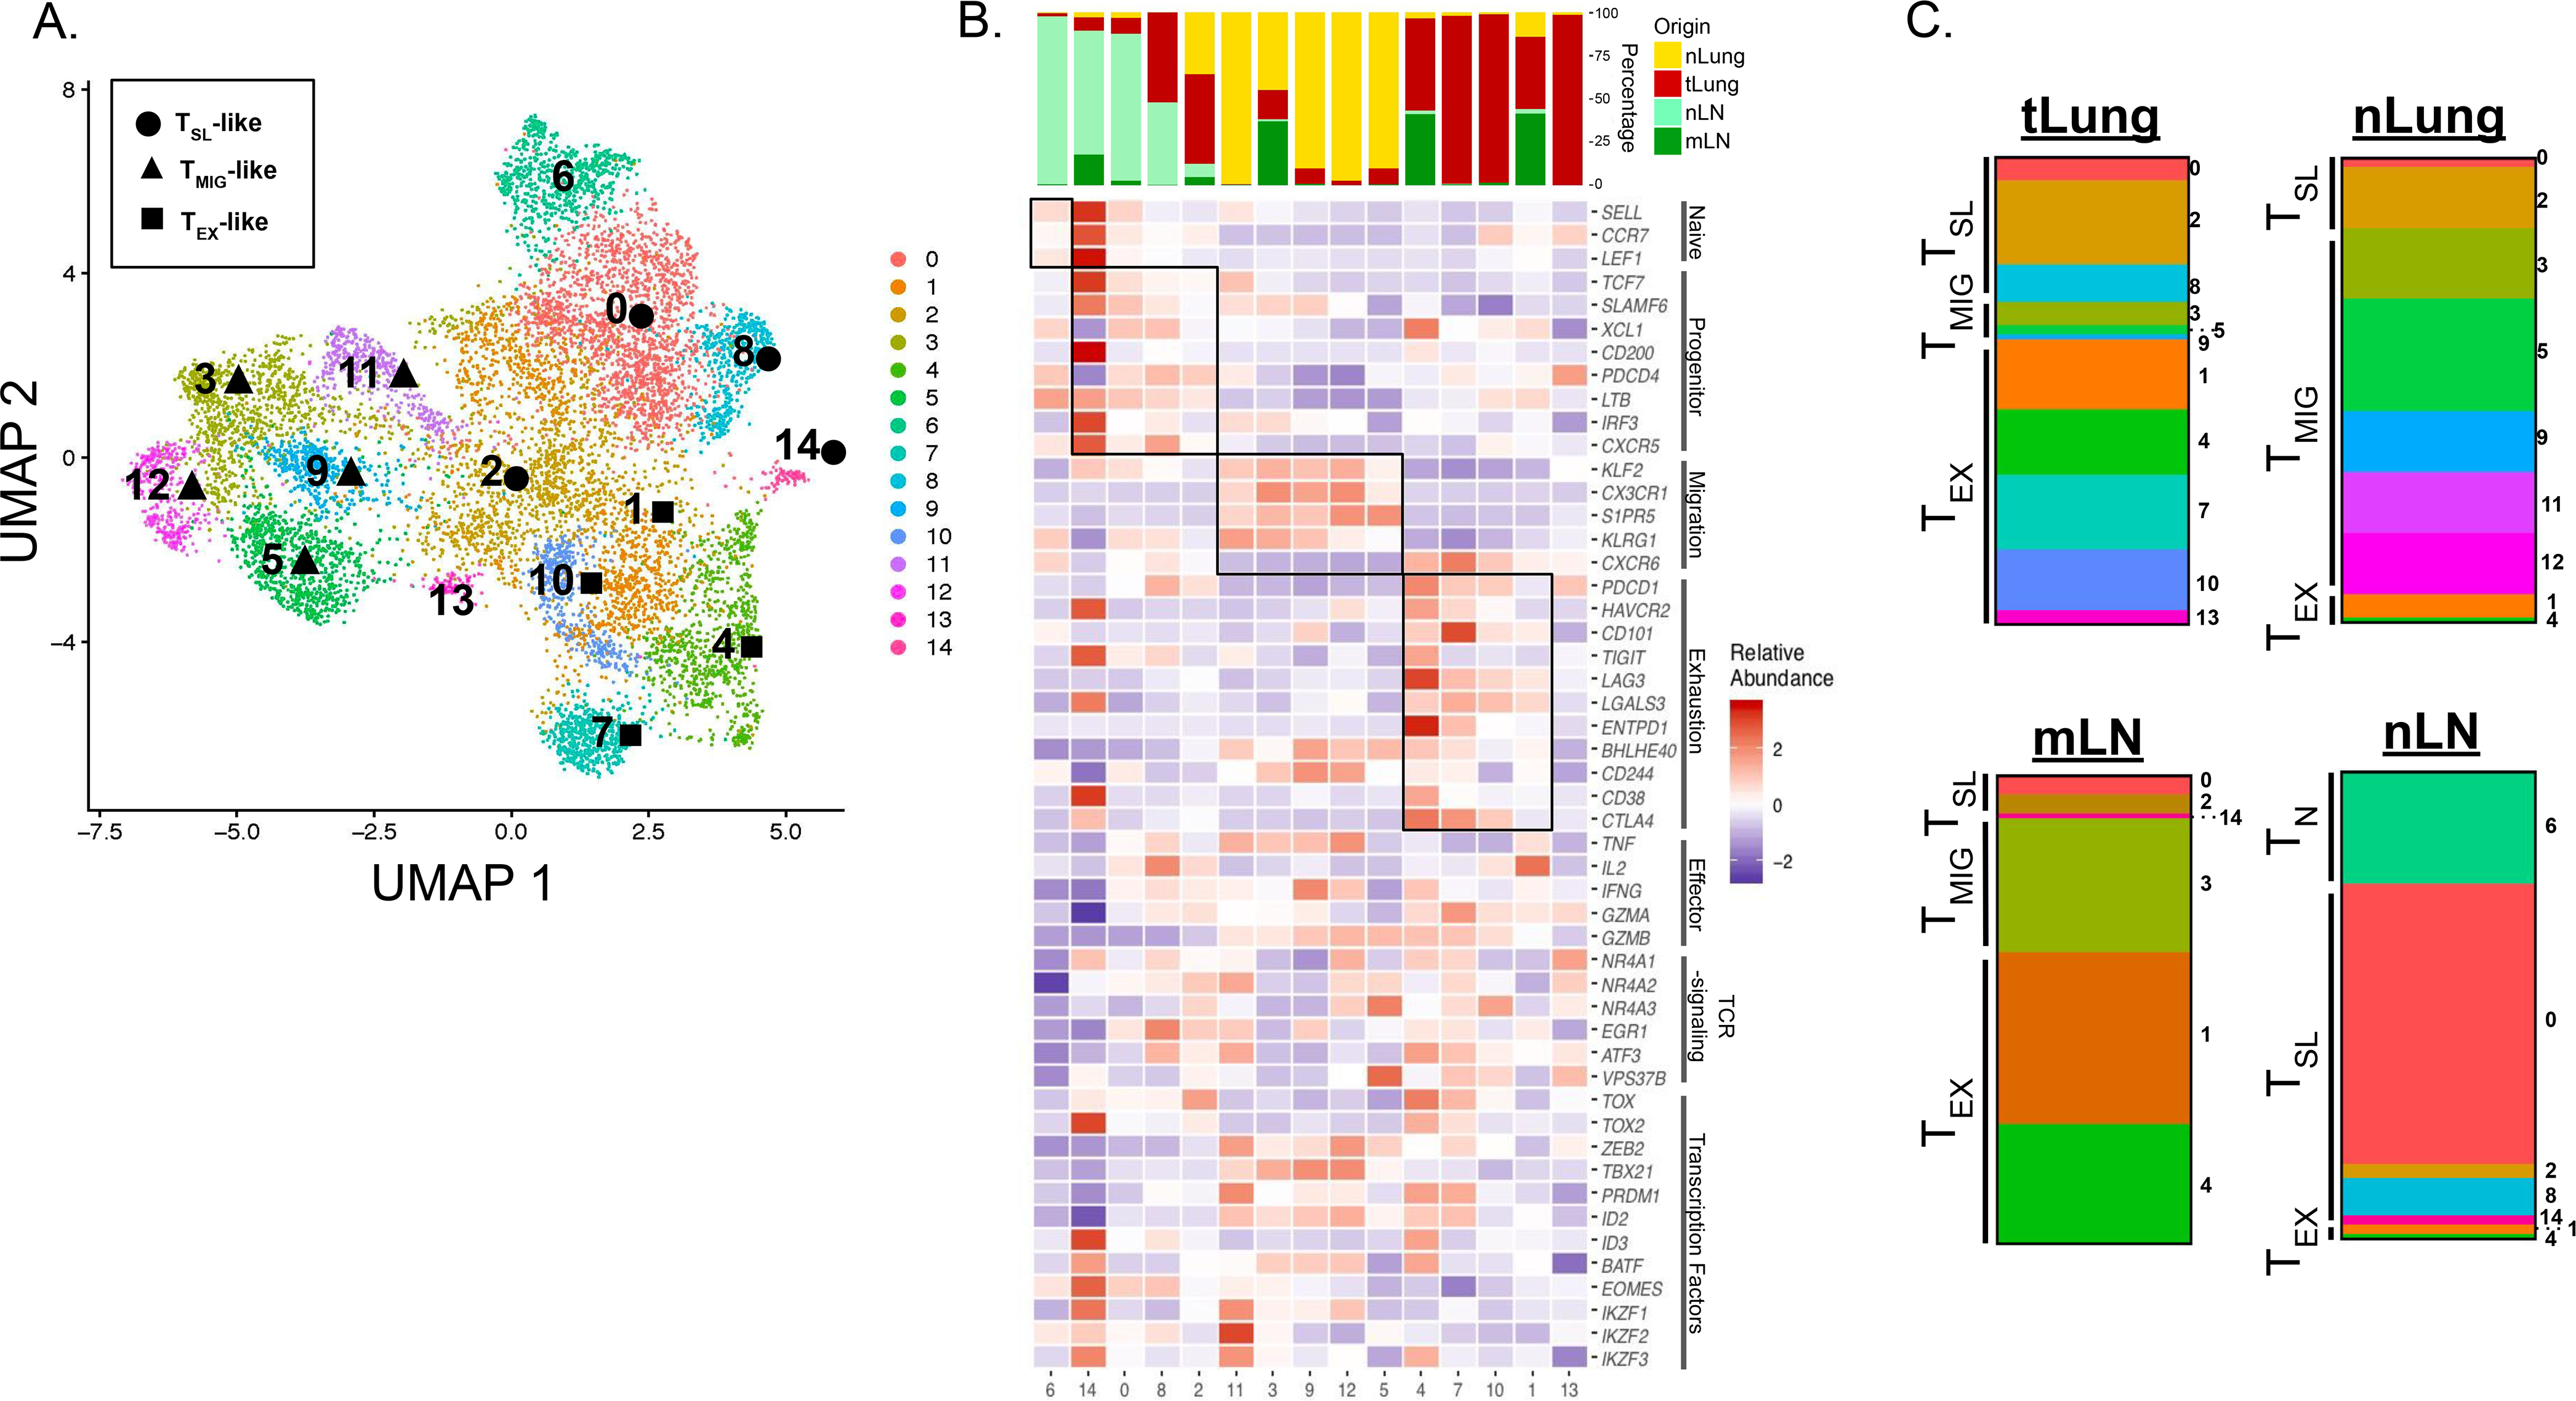
“Stem-like” TCF1+ CD8+ T (TSL) cells are necessary for long-term maintenance of T cell responses and the efficacy of immunotherapy, but, as tumors contain signals that should drive T cell terminal differentiation, how these cells are maintained in tumors remains unclear. In this study, we found that a small number of TCF1+ tumor-specific CD8+ T cells were present in lung tumors throughout their development. Yet, most intratumoral T cells differentiated as tumors progressed, corresponding with an immunologic shift in the tumor microenvironment (TME) from “hot” (T cell inflamed) to “cold” (non–T cell inflamed). By contrast, most tumor-specific CD8+ T cells in tumor-draining lymph nodes (dLNs) had functions and gene expression signatures similar to TSL from chronic lymphocytic choriomeningitis virus infection, and this population was stable over time despite the changes in the TME. dLN T cells were the developmental precursors of, and were clonally related to, their more differentiated intratumoral counterparts. Our data support the hypothesis that dLN T cells are the developmental precursors of the TCF1+ T cells in tumors that are maintained by continuous migration. Last, CD8+ T cells similar to TSL were also present in LNs from patients with lung adenocarcinoma, suggesting that a similar model may be relevant in human disease. Thus, we propose that the dLN TSL reservoir has a critical function in sustaining antitumor T cells during tumor development and in protecting them from the terminal differentiation that occurs in the TME.


Conflict of interest statement

Competing interests: S.K. is a paid advisor for ImmuneAI. This relationship did not influence the work performed in this study. The other authors declare that they have no competing interests.

Figures

Figure 1:
Figure 1:. Tumor-specific TCF1+CD8+ T cells are present throughout disease progression in autochthonous KP-NINJA lung tumors
(A) Experimental setup of KP-NINJA tumor induction in which doxycycline and tamoxifen treatment is administered on days 7–10 after initial infection. (B) Schematic detailing the genetic recombination events in KP-NINJA system. (C) De-identified, anti-CD3 immunohistochemistry stained KP-NINJA tumor-bearing lungs were scored blindly for level of T cell infiltration (3=>50%;2=10–50%;1=<10%). Scores were compared between early (8–10 weeks post infection; n=10) and late (16+ weeks post infection; n=22) tumors. p=<0.0001 by unpaired t-test. (D) Representative flow cytometry dot plots displaying extracellular expression of PD-1 and intracellular expression of TCF1 on tissue GP33-specific CD8+ T cells from the tumors (top) and dLNs (bottom) at early (8–10 weeks) and late (16+ weeks) time points after infection, cells pre-gated on singlets and THY1.2+CD8+i.v.CD45GP33-loaded MHCI tetramer+ as shown in Figure S1A. (E) Left panel: Percent TCF1+PD-1+CD8+ T cells of total GP33-specific CD8+ T cells (**p=0.0008 tumor; *p=0.0160 dLN). Center panel: Absolute numbers of TCF1+PD-1+CD8+ T cells (*p=0.0415; ****p=<0.0001), and absolute number of total GP33-specific (GP33 loaded MHC I tetramer+) CD8+ T cells (**p=0.0041) in tumors (black) and dLNs (gray). Mean number of TSL= 264 ± 48 in tumor vs. 2,630 ± 573 in dLN 8–10 weeks p.i. and 567 ± 204 in tumor vs. 4,730 ± 807 in dLN at 16+ weeks p.i. (F-G) Representative histograms displaying extracellular Tim3 expression (top) and SLAMF6 expression (bottom) of TCF1PD-1+ vs. TCF1+PD-1+ tumor-specific CD8+ T cells at early (8–10 weeks) and late (16+ weeks) after infection in tumors (F) and dLNs (G). Data from 8 (early) and 5 (late) independent experiments: n=29 tumors at 8–10 weeks p.i.;n=21 tumors at 16+ weeks p.i.; n=25 dLN at 8–10 weeks p.i.;n=27 dLN at 16+ weeks p.i. Statistics based on two-tailed, unpaired t-test. Mean and SEM reported in text. (H) Representative dot plots showing ex vivo IFNγ production of tumor (top) and dLN (bottom) cells following GP33–41 peptide re-stimulation, pre-gated on intravascular CD45- singlets, CD45.1THY1.2+ CD8+. Data normalized to the frequency of GP33-loaded Tetramer+ CD8+ T cells in lung tissue or dLN. Representative of 2 independent experiments; n=7 **p=0.005.
Figure 2:
Figure 2:. Tumor-specific TCF1+PD1+ CD8+ T cells in tumor and dLN resemble TSL cells in chronic LCMV
(A) Experimental protocol schematic. (B) Single-cell RNAseq data from GP33-specific CD8+ T cells in chronic LCMV Clone 13 infection were analyzed. 1,185 cells analyzed and 11,595 genes detected. (C) Naïve-, TSL-, and TEX-like populations (dotted lines) were identified based on the expression profiles of key genes associated with naïve, stem-like precursor, and terminally exhausted CD8+ T cells. (D) Individual data sets were visualized with PHATE maps displaying arbitrary clusters (1–7) and (E) CD8+ T cell populations were similarly identified among GP33-loaded MHC I tetramer+CD8+ T cells in the dLN and tumor from early (8 weeks p.i.) and late (17 weeks p.i.) KP-NINJA tumor-bearing mice. (F) Heat map of scRNAseq data from chronic LCMV-Clone 13 showing gene expression of naïve related, progenitor-related, migration-related, exhaustion-related, as well as key effector cell-associated genes, genes associated with intracellular TCR signaling, and key transcription factors. (G) 3-dimensional PHATE map of GP33-specific CD8+ T cells from chronic LCMV infection, early dLN, late dLN, early tumor, and late tumor were combined (left) and divided into 12 (0–11) clusters (right; refer to Figure S3G–H). (H) Heat map from combined analysis of all samples with distribution of samples for each clusters shown above. Gene expression of naïve related, progenitor-related, migration-related genes, exhaustion-related, as well as key effector cell-associated genes, genes associated with intracellular TCR signaling, and key transcription factors are included. For early dLN, 1,742 cells were analyzed and 12,116 genes were detected. For late dLN, 876 cells were analyzed and 11,595 genes were detected. For early tumor, 806 cells were analyzed and 11,749 genes were detected. For late tumor, 731 cells were analyzed and 11,150 genes were detected. Single cell RNA-sequencing data is representative of n=3 pooled samples.
Figure 3:
Figure 3:. Progressive CD8+ T cell differentiation occurs in tumors but not dLNs over the course of disease
(A-D) Single-cell transcriptomics of tumor-specific CD8+ T cells from early (8 weeks p.i.) tumors and late (17 weeks p.i.) tumors (A), early dLNs and late dLNs (B), late dLNs and late tumors (C), and early dLNs and early tumors (D) from KP-NINJA mice were co-embedded and expression profiles were visualized by PHATE maps (i). Pseudotime analysis was also visualized by PHATE maps (ii) as well as histograms (iii). Transcript dynamics (iv) between each co-embedded sample pair are illustrated by the direction of arrowheads. The location of transcriptional signatures for the major cell states identified (Naïve (white), TSL (green), and TEX (blue)) are indicated by markers on pseudotime visualizations. (E-F) The gene expression profile for Nr4a1 visualized by PHATE map on the dLN and tumor co-embeddings at early (E) and late (F) time points.
Figure 4:
Figure 4:. Clonal dominance is maintained throughout disease between dLN and tumors
(A) Paired single cell TCR-sequencing from tumor-specific CD8+ T cells (i.v.CD45CD8+GP33-loaded MHC I tetramer+) in early (8 weeks p.i.; left) and late (17 weeks p.i.; right) dLNs and tumors was used to identify the correlation between CD8+ T cell clones shared between tissues. Abundance of each shared clone (≥2 cells/sample with shared sequence) is reported as a percent of total shared clones between tissues at either timepoint and displayed on log2 axes (R2=0.9226 and 0.5508 at early and late timepoints, respectively). (B) The Morisita-Horn overlap index was calculated between early dLN (1,098 shared TCR sequences/clones; 1,734 cells with shared TCR sequence; Simpson’s Index = 0.009194539), early tumor (448 clones; 767 cells with shared TCR sequence; Simpson’s index = 0.02845659), late dLN (346 clones; 886 cells with shared TCR sequence; Simpson’s Index = 0.03669475), and late tumor (216 clones; 675 cells with shared TCR sequence; Simpson’s Index = 0.02416547) samples in order to compare overlap of TCR sequences. (C) Differentiation status of top 3 shared clones from tumor-specific CD8+ T cells in dLN and tumor at early (top left; with area of interest enlarged in top right corner) and late (top right) time points were determined by pseudotime analysis and visualized by PHATE. Distribution of each of the three clones are shown below at early (bottom left) and late (bottom right) time points, with each top clone differently colored. The location of transcriptional signatures for the major cell states identified (Naïve (white), TSL (green), and TEX (blue)) are indicated by markers on pseudotime visualizations. (D) TCRA and TCRB motifs were determined from single-cell TCR-sequencing of tumor specific CD8+ T cells and motifs shared between tissues at either time point are shown.
Figure 5:
Figure 5:. A reservoir of tumor-specific CD8+ TSL cells in dLN maintains the anti-tumor immune response
(A) Experimental schematic (left) with representative histogram (right) showing THY1.2+ events from whole blood 24 hours following 0.3mg/kg FTY720 treatment (gray) and vehicle-treated control (black). (B) Representative dots plots reporting mean and SEM of %TCF1+PD-1+ of GP33-specific cells, pre-gated on singlets, THY1.2+, CD8+ in the tissue (intravascular CD45) in tumor and dLN ± FTY720. (C-D) The percent and absolute number of TCF1+ PD-1+ TSL in tumors (C, *p=0.01; D, **p=0.002) and dLNs (C, p=0.96; D, p=0.056) in vehicle-treated (black) vs. FTY720-treated (red). (E-F) Percent and absolute number of GP-33 specific CD8+ T cells in tumors (E, p=0.93; F, *p=0.049) and dLN (E, p=0.71; F, p=0.13) in vehicle-treated (black) vs. FTY720-treated (red). (G-H) Percent and number of non-GP-33-specific (GP33-loaded MHC I tetramer-) CD8+ T cells in tumors (G, *p=0.025; H, **p=0.001) and dLN (G, ****p=8.8−6; H, **p=0.002) in vehicle-treated (black) vs. FTY720-treated (red). Representative of 2 independent experiments containing 4 technical repeats. Statistics based on two tailed, unpaired t-tests; n=18 vehicle and n=18 FTY720 for tumor. (I-J) The percent and absolute number of TCF1 PD-1+ TSL in tumors (I, p=0.357; J, p=0.135) and dLNs (I, p=0.393; J, p=0.704) in vehicle-treated (black) vs. FTY720-treated (red).
Figure 6:
Figure 6:. TSL-like populations are prevalent in non-metastatic LN of lung cancer patients
(A) UMAP displaying CD8+ T cell clusters 0–14 in treatment naïve LUAD patients from primary sites (tLung) and metastatic LN (mLN), normal lung tissue (nLung) and non-metastatic, normal LNs (nLN) (GSE131907; (81)). Clusters determined to have a TSL-like, TMIG-like, and TEX signature, based one gene expression, are denoted by ⬤, ▲, or ⬛, respectively. (B) Tissue of origin distributions for each cluster (top) and heatmap displaying relative abundance for naïve related, progenitor-related, migration-related, and exhaustion-related signature genes (bottom). Key effector cell-associated genes, genes associated with intracellular TCR signaling, and key transcription factors are also included. Relative abundance was calculated as Z-scaled average of log-transformed and cell-normalized counts. (C) Bar graphs depicting the make-up of total CD8+ T cells from each tissue showing the distribution of TN-like, TSL-Like, TMIG-like, or TEX-like clusters determined by gene signatures from B.

References

    1. Bailey TL, Boden M, Buske FA, Frith M, Grant CE, Clementi L, Ren J, Li WW, Noble WS, MEME SUITE: tools for motif discovery and searching. Nucleic acids research 37, W202–208 (2009). - PMC - PubMed
    1. Duma N, Santana-Davila R, Molina JR, Non-Small Cell Lung Cancer: Epidemiology, Screening, Diagnosis, and Treatment. Mayo Clin Proc 94, 1623–1640 (2019). - PubMed
    1. Howlader N, Forjaz G, Mooradian MJ, Meza R, Kong CY, Cronin KA, Mariotto AB, Lowy DR, Feuer EJ, The Effect of Advances in Lung-Cancer Treatment on Population Mortality. N Engl J Med 383, 640–649 (2020). - PMC - PubMed
    1. Herbst RS, Soria J-C, Kowanetz M, Fine GD, Hamid O, Gordon MS, Sosman JA, McDermott DF, Powderly JD, Gettinger SN, Kohrt HEK, Horn L, Lawrence DP, Rost S, Leabman M, Xiao Y, Mokatrin A, Koeppen H, Hegde PS, Mellman I, Chen DS, Hodi FS, Predictive correlates of response to the anti-PD-L1 antibody MPDL3280A in cancer patients. Nature 515, 563–567 (2014). - PMC - PubMed
    1. Taube JM, Anders RA, Young GD, Xu H, Sharma R, McMiller TL, Chen S, Klein AP, Pardoll DM, Topalian SL, Chen L, Colocalization of Inflammatory Response with B7-H1 Expression in Human Melanocytic Lesions Supports an Adaptive Resistance Mechanism of Immune Escape. Sci Transl Med 4, (2012). - PMC - PubMed

Publication types