. 2021 Oct;7(40):eabg1850.
doi: 10.1126/sciadv.abg1850. Epub 2021 Oct 1.

YAP drives fate conversion and chemoresistance of small cell lung cancer

Affiliations

YAP drives fate conversion and chemoresistance of small cell lung cancer

Qingzhe Wu et al. Sci Adv. 2021 Oct.

Abstract

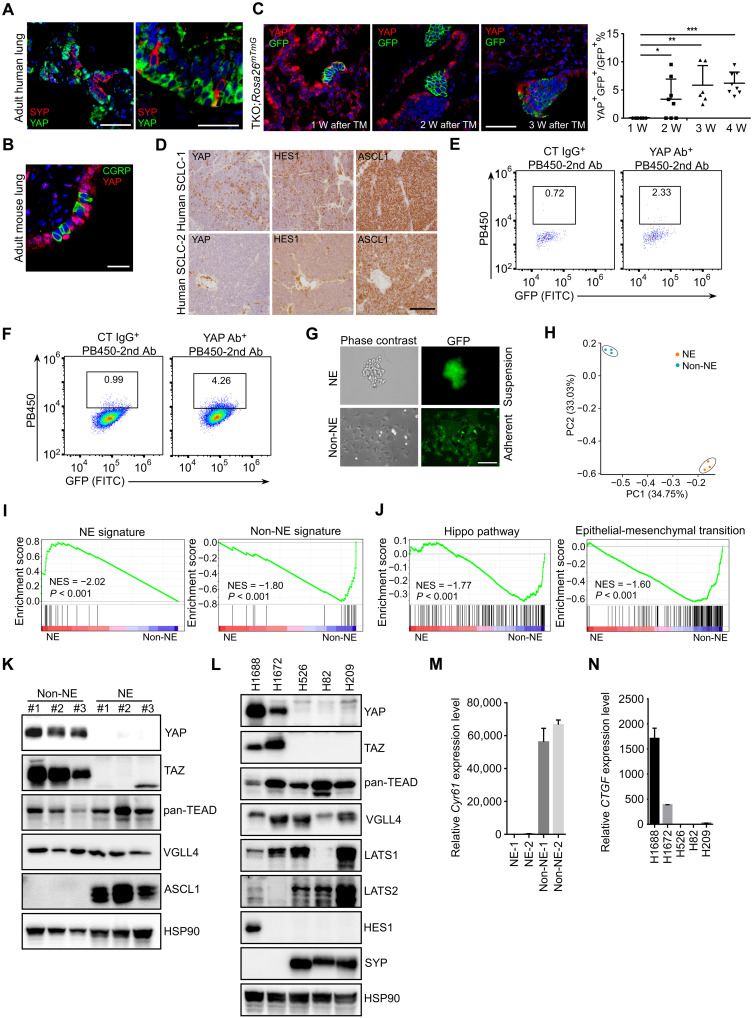
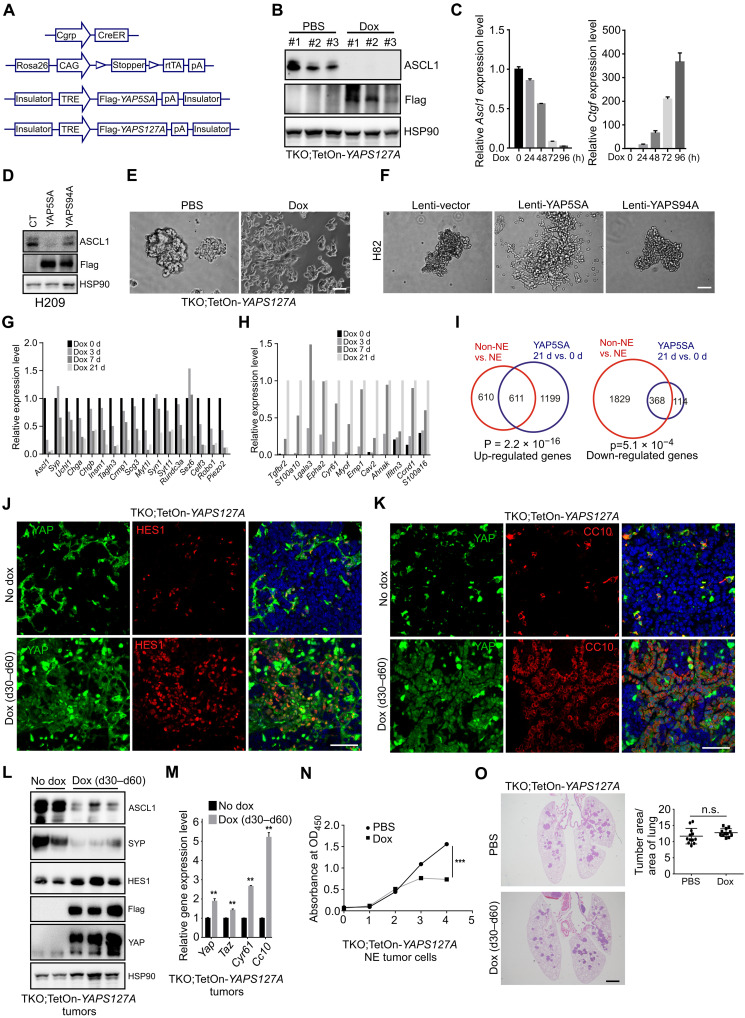
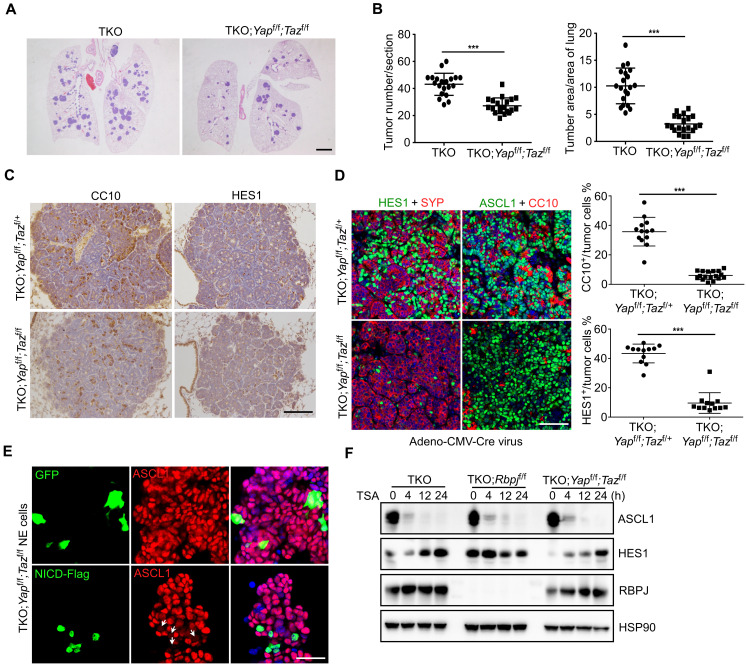
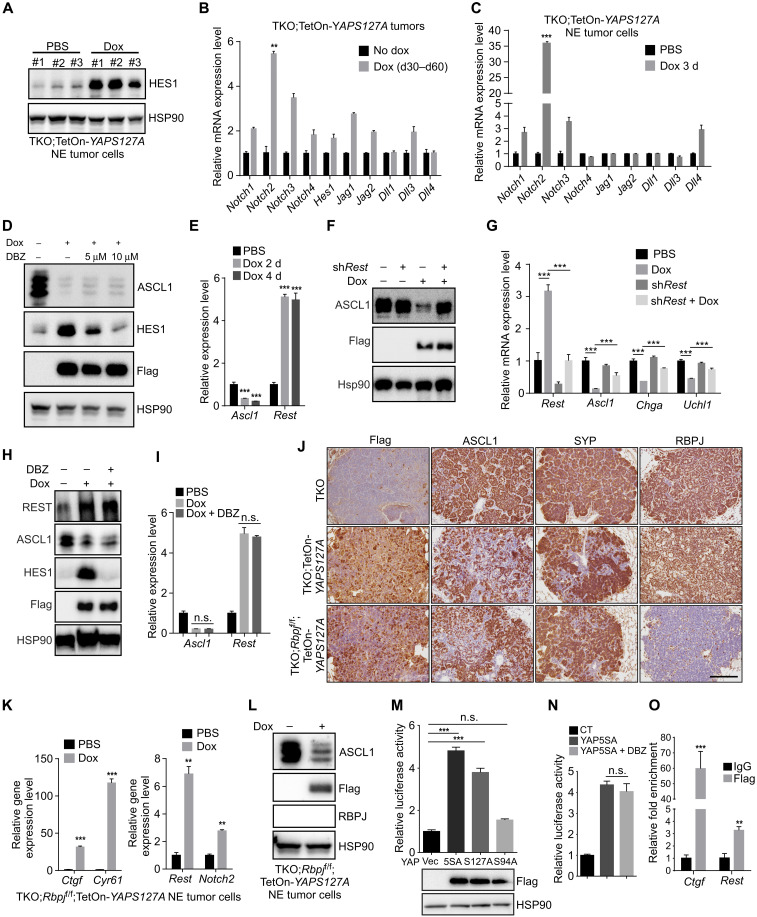
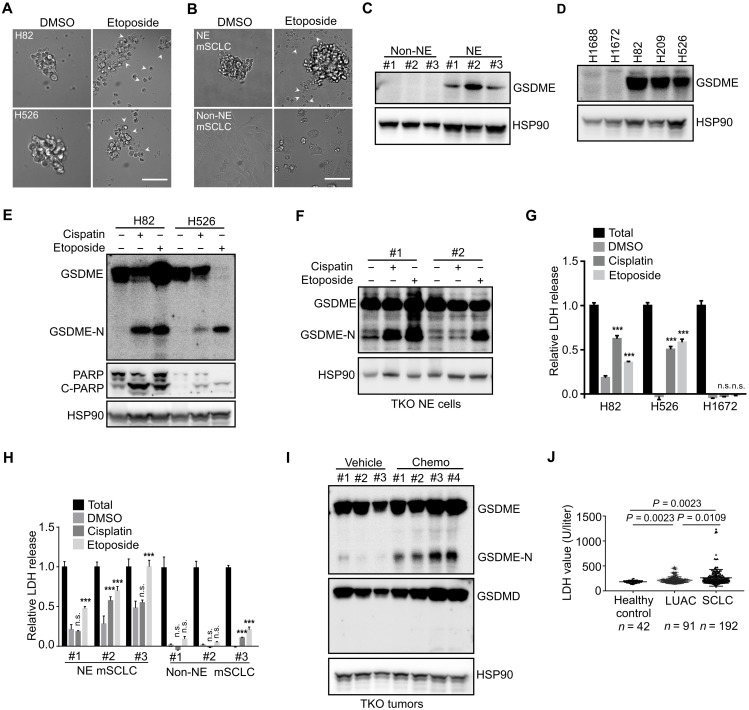
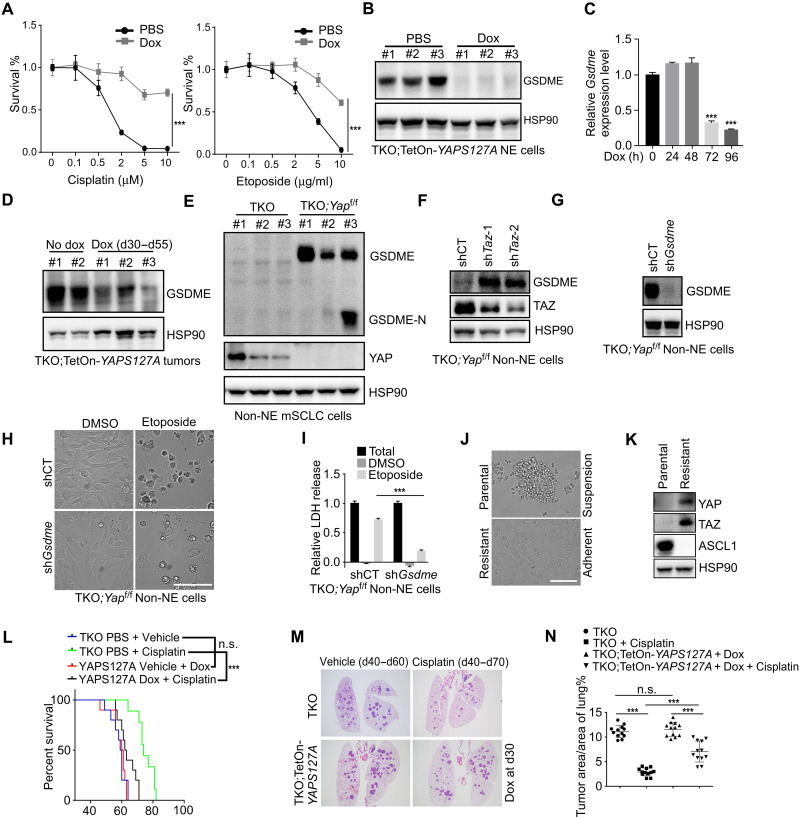
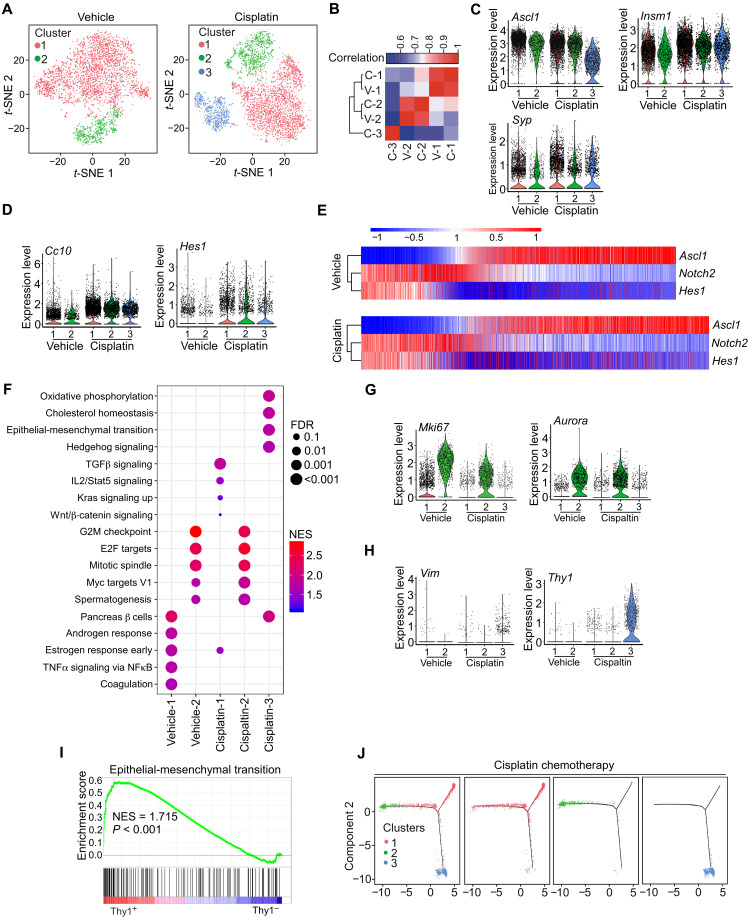
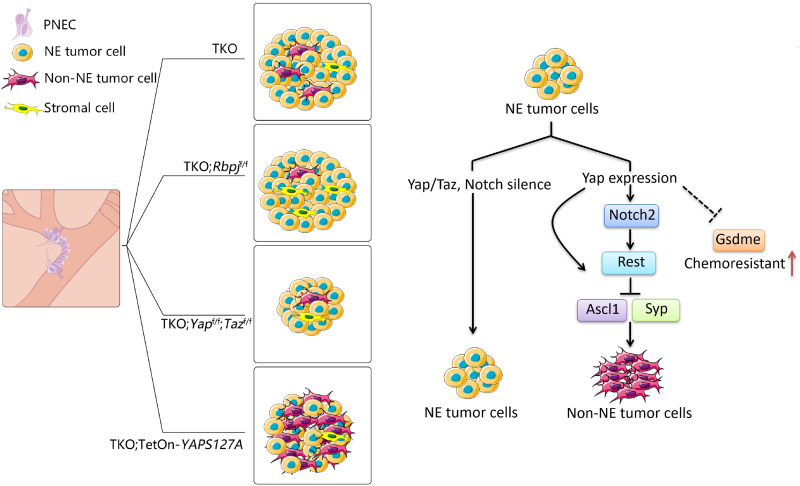
Small cell lung cancer (SCLC) has a high degree of plasticity and is characterized by a remarkable response to chemotherapy followed by the development of resistance. Here, we use a mouse SCLC model to show that intratumoral heterogeneity of SCLC is progressively established during SCLC tumorigenesis. YAP/TAZ and Notch are required for the generation of non-neuroendocrine (Non-NE) SCLC tumor cells, but not for the initiation of SCLC. YAP signals through Notch-dependent and Notch-independent pathways to promote the fate conversion of SCLC from NE to Non-NE tumor cells by inducing Rest expression. In addition, YAP activation enhances the chemoresistance in NE SCLC tumor cells, while the inactivation of YAP in Non-NE SCLC tumor cells switches cell death induced by chemotherapy drugs from apoptosis to pyroptosis. Our study demonstrates that YAP plays critical roles in the establishment of intratumoral heterogeneity and highlights the potential of targeting YAP for chemoresistant SCLC.


Figures

Fig. 1.
Fig. 1.. Non-NE tumor cells gradually occurred during SCLC progression.
(A and B) HES1 (A) and CC10 (B) immunofluorescence staining of SCLC tumors from CgrpCreER;TKO;Rosa26mTmG adult mice at indicated times after tamoxifen (TM) injection. Scale bar, 50 μm. Right panels show statistical analysis of percentage of HES1+ (A) and CC10+ (B) cells. n = 3 mice per group at each time point. *P < 0.05 and ***P < 0.001. n.s., not significant. (C) Representative hematoxylin and eosin (H&E) staining and RBPJ immunostaining on lung sections from CgrpCreER;TKO and CgrpCreER;TKO;Rbpjf/f mice 2 months after tamoxifen injection. Scale bar, 100 μm. (D) Quantification of tumor burden and tumor number in CgrpCreER;TKO and CgrpCreER;TKO;Rbpjf/f mouse lungs 2 months after tamoxifen injection. n = 5 mice per group. (E) Immunofluorescence staining of SCLC tumors from CgrpCreER;TKO and CgrpCreER;TKO;Rbpjf/f mice 2 months after tamoxifen injection. Statistical analysis of percentage of CC10+ cells. n = 5 mice per group. ***P < 0.001. Scale bar, 50 μm. (F) Immunofluorescence staining of SCLC tumors from CgrpCreER;TKO and CgrpCreER;TKO;Rbpjf/f adult mice 2 months after Adeno-CMV-Cre virus administration. The bottom panel shows statistical analysis of percentage of CC10+ cells. n = 5 mice per group. ***P < 0.001. Scale bar, 50 μm.
Fig. 2.
Fig. 2.. YAP is expressed in a subset of SCLC tumor cells.
(A and B) Immunofluorescence staining of adult human (A) and mouse (B) lung sections with indicated antibodies. Scale bars, 50 μm (A) and 20 μm (B). (C) Immunofluorescence staining of lung sections with anti-YAP and anti-GFP antibodies from CgrpCreER;TKO;Rosa26mTmG adult mice at indicated times. Right panel shows the quantification of YAP+ tumor cells. n = 3 mice per group at each time point. *P < 0.05, **P < 0.01, and ***P < 0.001. Scale bar, 50 μm. (D) Immunostaining of human SCLC tumor sections with indicated antibodies. Scale bar, 100 μm. (E and F) Flow cytometry analysis of YAP expression in CgrpCreER;TKO;Rosa26mTmG SCLC tumor cells 2 weeks (E) and 5 weeks (F) after tamoxifen injection. Whole lung cells were proceeded to flow cytometry analysis by control immunoglobulin G (IgG) and anti-YAP antibody (Ab). Tumor cells were genetically labeled by GFP protein from Rosa26mTmG reporter. FITC, fluorescein isothiocyanate. (G) The morphology of SCLC cells derived from CgrpCreER;TKO;Rosa26mTmG lung tumors with suspending aggregates (NE) and attaching (Non-NE) cells. Both of the clones expressed GFP. Scale bar, 50 μm. (H) PCA of RNA-seq from mouse NE and Non-NE tumor cells. (I and J) GSEA for NE and Non-NE signature (I) and Hippo pathway genes and EMT (J) from the RNA-seq data of mouse NE and Non-NE tumor cells. (K) Western blot analysis of a panel of mouse NE and Non-NE SCLC cell lines derived from CgrpCreER;TKO mice. (L) Western blot analysis of a panel of human SCLC cell lines. (M) Quantitative analysis of Cyr61 mRNA levels in mouse NE and Non-NE tumor cell lines. Data shown are representative of three independent experiments. Data are presented as means ± SD. (N) Quantitative analysis of CTGF mRNA levels in human SCLC tumor cells. Data are presented as means ± SD from three independent experiments.
Fig. 3.
Fig. 3.. YAP activation drives NE to Non-NE fate conversion of SCLC.
(A) Schematic representation of the generation of dox-inducible YAPS127A and YAP5SA mouse lines. (B and C) Western blot (B) and quantitative polymerase chain reaction (PCR) (C) analysis of ASCL1 levels in mouse CgrpCreER;TKO;TetOn-YAPS127A NE cells treated without or with dox for 96 hours. Data are presented as means ± SD from three independent experiments. (D) Western blot analysis of ASCL1 protein in Lenti-YAP5SA and Lenti-YAPS94A virus–transduced NCI-H209 cells. (E and F) Phase-contrast photomicrographs of dox-treated CgrpCreER;TKO;TetOn-YAPS127A NE SCLC cells and Lenti-YAP5SA– and Lenti-YAPS94A–transduced NCI-H82 cells for 2 weeks. Scale bars, 20 μm (E), 50 μm (F). (G and H) Histogram representing the relative expression changes of NE (G) and Non-NE (H) signature genes from RNA-seq analysis of YAP5SA-expressing cells. (I) Venn diagram representing the numbers of differentially expressed genes (DEGs) in each indicated paired comparison set. (J and K) Immunofluorescence staining of tumor tissues from CgrpCreER;TKO;TetOn-YAPS127A lungs treated without or with dox. Scale bars, 50 μm. (L and M) Western blot (L) and quantitative PCR (M) analysis of tumor tissues isolated from CgrpCreER;TKO;TetOn-YAPS127A lungs treated without or with dox. n = 3 mice per group. Data are presented as means ± SEM. **P < 0.01. (N) Cell proliferation analysis of CgrpCreER;TKO;TetOn-YAPS127A NE cells treated with or without dox. Data are presented as means ± SD from three independent experiments. ***P < 0.001. (O) Representative H&E staining of CgrpCreER;TKO;TetOn-YAPS127A lungs treated without or with dox. Scale bar, 500 μm. Quantification of tumor burden was shown at the right panel. n = 3 mice per group.
Fig. 4.
Fig. 4.. Loss of YAP and TAZ results in the decreased Non-NE tumor cells in SCLC.
(A) Representative H&E staining of CgrpCreER;TKO and CgrpCreER;TKO;Yapf/f;Tazf/f lungs 2 months after tamoxifen injection. Scale bar, 500 μm. (B) Quantification of tumor burden and tumor number of CgrpCreER;TKO and CgrpCreER;TKO;Yapf/f;Tazf/f mice 2 months after tamoxifen injection. n = 5 mice each genotype. ***P < 0.001. (C) Immunostaining of CC10 and HES1 expression in the lung tumors of CgrpCreER;TKO;Yapf/f;Tazf/+ and CgrpCreER;TKO;Yapf/f;Tazf/f mice 60 days after tamoxifen injection. Scale bar, 100 μm. (D) Immunofluorescence staining of CC10 and HES1 expression in the lung tumors of CgrpCreER;TKO;Yapf/f;Tazf/+ and CgrpCreER;TKO;Yapf/f;Tazf/f mice 70 days after Adeno-CMV-Cre virus administration. n = 5 mice each genotype. Right panels show the statistical analysis of the percentage of HES1- and CC10-positive cells. ***P < 0.001. Scale bar, 50 μm. (E) Immunofluorescence staining of ASCL1 in mouse CgrpCreER;TKO;Yapf/f;Tazf/f NE SCLC cells transfected with GFP or NICD-Flag plasmids. Arrows indicate NICD-Flag–expressing cells. Scale bar, 20 μm. (F) Western blot analysis of various mouse NE tumor cells treated with TSA at indicated times.
Fig. 5.
Fig. 5.. YAP promotes the expression of Notch2 and Rest in SCLC.
(A) Western blot analysis of HES1 expression in CgrpCreER;TKO;TetOn-YAPS127A NE cells treated with dox for 96 hours. The same cell lysates were used as in Fig. 3B. (B and C) Quantitative analysis of Notch signaling components in CgrpCreER;TKO;TetOn-YAPS127A tumor tissues (B) and NE cells (C) as indicated. (D) Western blot analysis of CgrpCreER;TKO;TetOn-YAPS127A NE cells treated with dox and DBZ together for 3 days. (E) Quantitative analysis of Ascl1 and Rest mRNA in CgrpCreER;TKO;TetOn-YAPS127A NE cells as indicated. (F) Western blot analysis of ASCL1 expression in Rest knockdown CgrpCreER;TKO;TetOn-YAPS127A NE cells treated as indicated. (G) Quantitative analysis of gene expression levels in CgrpCreER;TKO;TetOn-YAPS127A NE tumor cells treated with dox and shRest lentivirus. (H and I) Western blot (H) and quantitative PCR (I) analysis of CgrpCreER;TKO;TetOn-YAPS127A NE cells treated with dox and DBZ together for 4 days. (J) Immunostaining of lung tumors from indicated mice treated with dox from days 30 to 60 after tamoxifen injection. Scale bar, 100 μm. (K) Quantitative analysis of gene expression in CgrpCreER;TKO;Rbpjf/f;TetOn-YAPS127A NE cells treated with dox for 4 days. (L) Western blot analysis of ASCL1 expression in CgrpCreER;TKO;Rbpjf/f;TetOn-YAPS127A NE cells treated with dox for 3 days. (M and N) Relative luciferase activity of mouse Rest 2-kb promoter assayed in CgrpCreER;TKO NE cells. (O) ChIP assay in CgrpCreER;TKO;TetOn-YAP5SA NE cells treated with dox for 3 days. There are two YAP/TEAD binding sites in Ctgf ChIP region and one in Rest ChIP region. Data are presented as means ± SD from three independent experiments. **P < 0.01 and ***P < 0.001.
Fig. 6.
Fig. 6.. Chemotherapy drugs induce pyroptosis in NE SCLC cells.
(A and B) Phase-contrast images of human (A) and mouse (B) SCLC cell lines treated with etoposide for 24 hours. Arrowheads indicate pyroptotic cells. Scale bars, 50 μm. DMSO, dimethyl sulfoxide; mSCLC, mouse SCLC. (C and D) Western blot analysis of GSDME expression in mouse SCLC cells (C) and human SCLC cell lines (D). (E and F) Western blot analysis of human (E) and mouse (F) SCLC cells treated with cisplatin or etoposide for 24 hours. (G and H) LDH release assay in human (G) and mouse (H) SCLC cells treated with cisplatin or etoposide for 24 hours. Data shown are representative of three independent experiments. Data are presented as means ± SD. ***P < 0.001. (I) Western blot analysis of SCLC tumor tissues isolated from CgrpCreER;TKO mice treated with an acute cisplatin/etoposide chemotherapy. (J) Serum LDH concentrations of healthy control, patients with LUAC, and patients with SCLC at the diagnosis without any treatment.
Fig. 7.
Fig. 7.. Activation of YAP suppresses GSDME expression and decreases the chemosensitivity in NE SCLC cells.
(A) Viability analysis of CgrpCreER;TKO;TetOn-YAPS127A NE cells without or with dox treatment for 3 days and followed by etoposide and cisplatin treatment for 48 hours. (B) Western blot analysis of GSDME expression in dox-treated CgrpCreER;TKO;TetOn-YAPS127A NE cells. The same cell lysates were used as in Fig. 3B. (C and D) Quantitative PCR (C) and Western blot (D) analysis of GSDME expression in CgrpCreER;TKO;TetOn-YAPS127A NE cells (C) and tumor tissues (D) treated with dox at indicated times. (E and F) Western blot analysis of GSDME expression in indicated Non-NE cells. (G) Western blot analysis of GSDME in CgrpCreER;TKO;Yapf/f Non-NE cells transduced with control or shGsdem lentivirus. (H and I) Phase-contrast images (H) and LDH release assay (I) in CgrpCreER;TKO;Yapf/f Non-NE cells transduced with control or shGsdme lentivirus and exposed to etoposide for 48 hours. Scale bar, 50 μm. (J and K) Phase-contrast images (J) and Western blot analysis (K) of parental (suspension) and chemoresistant (adherent) mouse SCLC cell lines. Scale bar, 50 μm. (L) Survival curves for vehicle- and cisplatin-treated animals. Dox and cisplatin were administrated 30 days after tamoxifen injection. n = 15 mice per group. ***P < 0.001. (M) Representative H&E staining of vehicle- and cisplatin-treated animals. Lungs were collected at 70 days after tamoxifen injection. (N) Quantification of tumor burden of vehicle- and cisplatin-treated animals. Lungs were collected at 70 days after tamoxifen injection. n = 3 mice per group. ***P < 0.001. Data in (A), (C), and (I) are presented as means ± SD from three independent experiments.
Fig. 8.
Fig. 8.. scRNA-seq of mouse SCLC followed by chemotherapy.
(A) t-SNE analysis of control and cisplatin-treated CgrpCreER;TKO;Rosa26mTmG mice. (B) Spearman’s correlation analysis among different clusters. V, vehicle; C, cisplatin. (C and D) Violin plots indicating the range of expression of Ascl1, Insm1, and Syp (C) and Hes1 and Cc10 (D) in single cells from each cluster. Each dot represents one cell, and the violin curves represent the density of cells at different expression levels. (E) Expression patterns of Ascl1, Notch2, and Hes1 genes from scRNA-seq in vehicle- and cisplatin-treated tumor cells. (F) The top five enriched hallmark gene sets in each cluster. NES, normalized enrichment score; FDR, false discovery rate. (G and H) Violin plots indicating the range of expression of Mki67 and Aurora (G) and Vim and Thy1 (H) in single cells from each cluster. (I) GSEA with NES for hallmark gene sets associated with EMT in Thy1+ (cluster 3) and Thy1 population. (J) Pseudo-time trajectory by monocle 2 from cisplatin-treated tumor cells.
Fig. 9.
Fig. 9.. The model shows that YAP/TAZ regulate intertumoral heterogeneity and drug resistance of SCLC.
YAP signals through Notch-dependent and Notch-independent pathways to promote the fate conversion of SCLC from NE to Non-NE tumor cells by inducing REST expression. YAP suppresses GSDME expression in SCLC cells and is associated with acquired resistance to chemotherapy in SCLC.

References

    1. Nicholson A. G., Chansky K., Crowley J., Beyruti R., Kubota K., Turrisi A., Eberhardt W. E. E., van Meerbeeck J., Rami-Porta R.; Staging and Prognostic Factors Committee, Advisory Boards, and Participating Institutions , The international association for the study of lung cancer lung cancer staging project: Proposals for the revision of the clinical and pathologic staging of small cell lung cancer in the forthcoming eighth edition of the TNM classification for lung cancer. J. Thorac. Oncol. 11, 300–311 (2016). - PubMed
    1. Gazdar A. F., Bunn P. A., Minna J. D., Small-cell lung cancer: What we know, what we need to know and the path forward. Nat. Rev. Cancer 17, 725–737 (2017). - PubMed
    1. Sabari J. K., Lok B. H., Laird J. H., Poirier J. T., Rudin C. M., Unravelling the biology of SCLC: Implications for therapy. Nat. Rev. Clin. Oncol. 14, 549–561 (2017). - PMC - PubMed
    1. Horn L., Mansfield A. S., Szczęsna A., Havel L., Krzakowski M., Hochmair M. J., Huemer F., Losonczy G., Johnson M. L., Nishio M., Reck M., Mok T., Lam S., Shames D. S., Liu J., Ding B., Lopez-Chavez A., Kabbinavar F., Lin W., Sandler A., Liu S. V.; IMpower133 Study Group , First-line atezolizumab plus chemotherapy in extensive-stage small-cell lung cancer. N. Engl. J. Med. 379, 2220–2229 (2018). - PubMed
    1. Ready N. E., Ott P. A., Hellmann M. D., Zugazagoitia J., Hann C. L., de Braud F., Antonia S. J., Ascierto P. A., Moreno V., Atmaca A., Salvagni S., Taylor M., Amin A., Camidge D. R., Horn L., Calvo E., Li A., Lin W. H., Callahan M. K., Spigel D. R., Nivolumab monotherapy and nivolumab plus ipilimumab in recurrent small cell lung cancer: Results from the CheckMate 032 randomized cohort. J. Thorac. Oncol. 15, 426–435 (2020). - PubMed