. 2021 Oct;7(40):eabj2485.
doi: 10.1126/sciadv.abj2485. Epub 2021 Oct 1.

GABARAP sequesters the FLCN-FNIP tumor suppressor complex to couple autophagy with lysosomal biogenesis

Affiliations

GABARAP sequesters the FLCN-FNIP tumor suppressor complex to couple autophagy with lysosomal biogenesis

Jonathan M Goodwin et al. Sci Adv. 2021 Oct.

Abstract

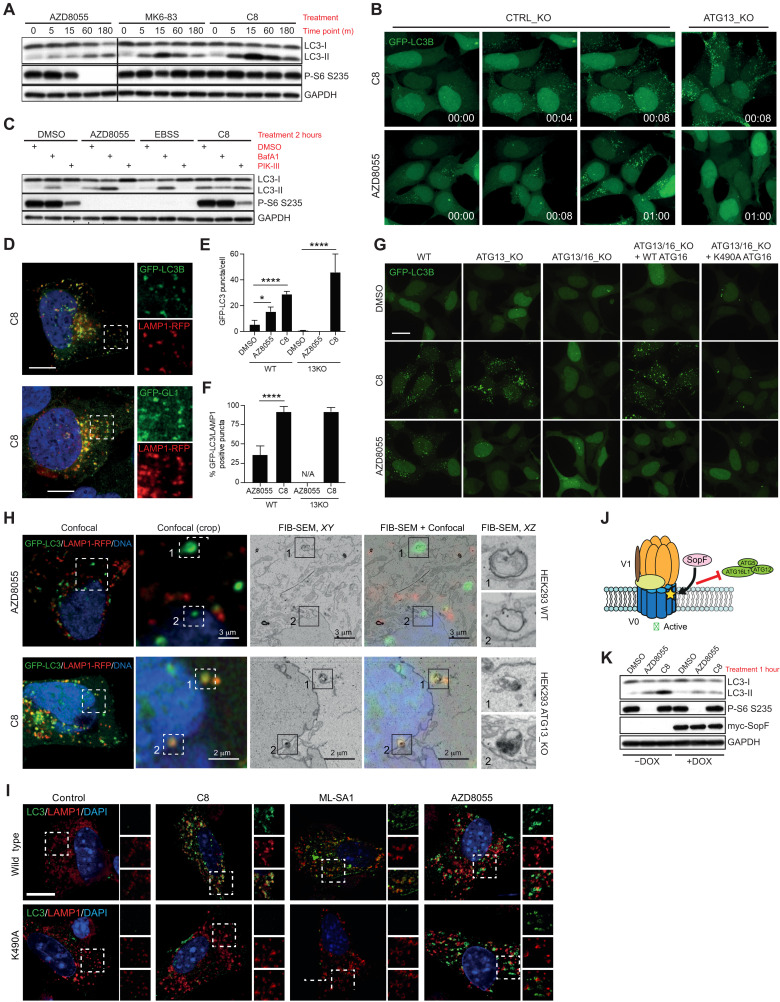
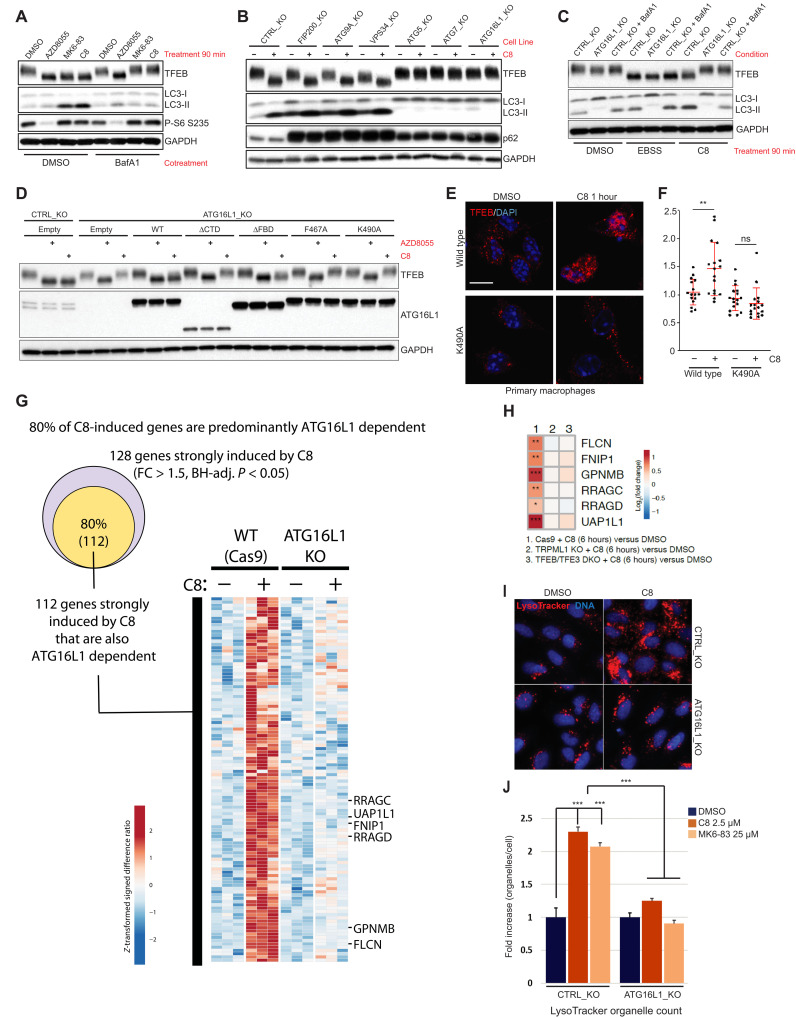
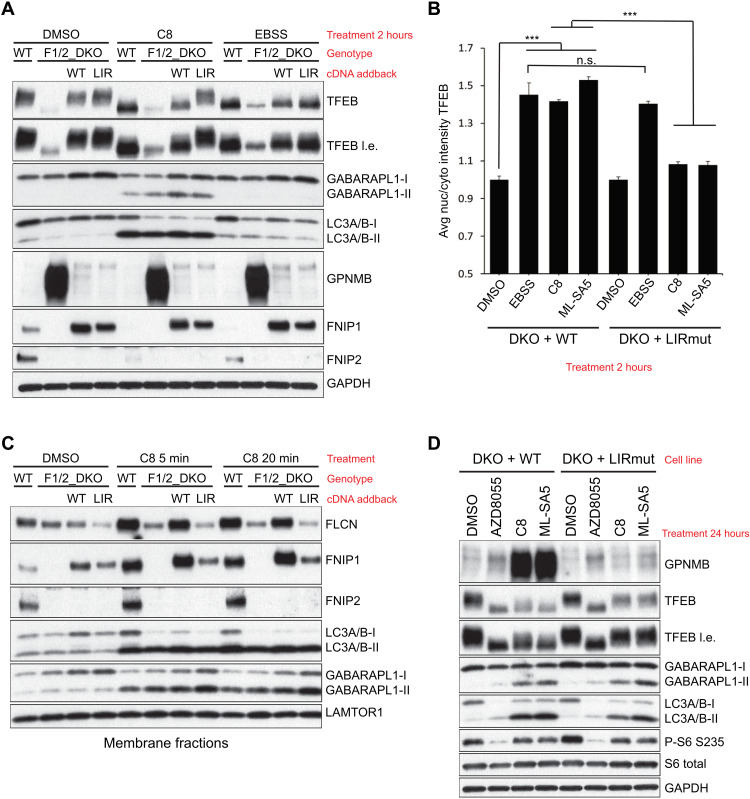
Adaptive changes in lysosomal capacity are driven by the transcription factors TFEB and TFE3 in response to increased autophagic flux and endolysosomal stress, yet the molecular details of their activation are unclear. LC3 and GABARAP members of the ATG8 protein family are required for selective autophagy and sensing perturbation within the endolysosomal system. Here, we show that during the conjugation of ATG8 to single membranes (CASM), Parkin-dependent mitophagy, and Salmonella-induced xenophagy, the membrane conjugation of GABARAP, but not LC3, is required for activation of TFEB/TFE3 to control lysosomal capacity. GABARAP directly binds to a previously unidentified LC3-interacting motif (LIR) in the FLCN/FNIP tumor suppressor complex and mediates sequestration to GABARAP-conjugated membrane compartments. This disrupts FLCN/FNIP GAP function toward RagC/D, resulting in impaired substrate-specific mTOR-dependent phosphorylation of TFEB. Thus, the GABARAP-FLCN/FNIP-TFEB axis serves as a molecular sensor that coordinates lysosomal homeostasis with perturbations and cargo flux within the autophagy-lysosomal network.


Figures

Fig. 1.
Fig. 1.. Activation of the lysosomal ion channel TRPML1 results in ATG8 conjugation to the lysosomal membrane independent of autophagy.
(A) Western blot of HEK293T cells treated with the mTOR inhibitor AZD8055 (1 μM) or the TRPML1 agonists MK6-83 (25 μM) or C8 (2 μM) for the indicated time points. (B) Time-lapse imaging of GFP-LC3B in WT or ATG13_KO HEK2393T cells treated as in (A). (C) Western blot of LC3 lipidation sensitivity to either BafA1 (100 nM) or PIK-III (5 μM). DMSO, dimethyl sulfoxide. (D) Colocalization of GFP-tagged ATG8 homologs with the lysosomal marker LAMP1-RFP in C8-treated HEK293T. (E) GFP-LC3B puncta count in WT or ATG13_KO HEK293T cells. Data represent means ± SD from independent experiments. *P < 0.01 and ****P < 0.001, unpaired t test. (F) GFP-LC3B colocalization with RFP-LAMP1 in WT and ATG13_KO HEK293T cells. Data represent percentage of GFP-LC3B puncta also LAMP1 positive. Means ± SD from independent experiments. ****P < 0.001, unpaired t test. (G) Immunofluorescence analysis of GFP-LC3B puncta formation in HEK293T of the indicated genotype treated as in (A). (H) Ultrastructural CLEM, FIB-SEM analysis of GFP-LC3B HEK293T cells of the indicated genotype. CLEM representative images shown in optimal X/Y resolution. Zoom FIB-SEM images shown in X/Z plane. (I) Immunofluorescence of primary BMDMs treated with the indicated compounds for 1 hour. (J) Diagram of SopF function. (K) Western blot of LC3 lipidation in SopF-inducible (+DOX) HeLa cells upon indicated treatment.
Fig. 2.
Fig. 2.. ATG16L1-dependent ATG8 conjugation to single membranes is required for TFEB activation and lysosomal biogenesis upon TRPML1 activation.
(A) Western blot of TFEB phosphorylation in HeLa cells treated with the indicated compounds. (B) CRISPR KO HeLa panel treated as in (A). (C) Western blot of TFEB activation sensitivity to BafA1 (100 nM) or ATG16L1_KO upon indicated treatments. (D) Western blot of HeLa cells of the indicated genotype expressing ATG16L1 variants treated as in (A). (E) Primary BMDMs of the indicated genotype treated with 2 μM C8 and immunostained for endogenous TFEB. (F) Quantification of nuclear/cytosolic ratio of TFEB in (E). Data represent means ± SD from independent experiments. **P < 0.01, unpaired t test. ns, not significant. (G) RNA-seq profiling of genes induced by C8 compound stimulation for 24 hours in ATG16L1 KO and WT HeLa cells. The Venn diagram shows that 80% of C8-induced genes are also ATG16L1 dependent. Differentially induced genes identified by fold change (FC) > 1.5 and Benjamini and Hochberg’s (BH)–adjusted P < 0.05. (H) TFEB target gene expression upon TRPML1 agonist (C8) treatment of indicated genotype HeLa cells. RNA-seq performed in triplicates. (I) U2OS cells of the indicated genotype treated for 24 hours and stained with LysoTracker dye. Representative images are shown. (J) Quantification of LysoTracker organelle count from (I). Fold change organelles per cell ± SD from independent experiments. ***P < 0.005, unpaired t test.
Fig. 3.
Fig. 3.. GABARAP is required for TFEB activation and FLCN-FNIP sequestration upon acute TRPML1 stimulation.
(A) CRISPR KO of ATG8 homologs in HeLa cells. RAP_TKO = GABARAP, GABARAPL1, and GABARAPL2 KO. LC3_TKO = LC3A, LC3B, and LC3C KO. Western blot of cells treated with TRPML1 agonist. (B) Immunoprecipitation of HEK293T cells transfected with the indicated constructs for 20 hours. (C) Immunoprecipitation of HEK293T cells transfected with the indicated constructs for 20 hours. LIR binding motif (LBM) mutant = K39Q/Y40H/Q74E/F75L. (D) GABARAP_MBP complexes with FLCN/FNIP2 over Superose 6 column. Overlay of individual and complexed chromatograms. (E) GABARAP binds FLCN/FNIP2 with picomolar affinity (300 pM Kd) in single cycle SPR, while LC3B does not bind to FLCN/FNIP2. (F and G) GABARAP and (I and J) LC3B bind to the FIR domain of p62 with equivalent affinity (700 nM Kd) in multicycle SPR. (H) GABARAP binds FLCN/FNIP2 with picomolar affinity in multicycle SPR. (K) Immunofluorescence of U2OS cells of the indicated genotype treated with TRPML1 agonist for 20 min. (L) Western blot analysis of membrane fractions from indicated HeLa cells after treatment with TRPML1 agonist. (M) U2OS cells of the indicated genotype stably expressing 3×HA-TMEM192. LysoIP was performed after treatment with C8 (2 μM, 15 min). (N) Western blot of FLCN-FNIP1 membrane recruitment upon TRPML1 agonist treatment in LAMTOR1_KO cells.
Fig. 4.
Fig. 4.. GABARAP binds the FLCN-FNIP complex through a novel LIR motif-driven interface.
(A) Overview of chemical footprinting assay. GEE and EDC label carboxyl groups of Asp/Glu residues. (B) Significant protection observed for three overlapping peptides in FNIP2. (C) Location of putative LIR domain within reported FLCN-FNIP2 cryo-EM structure. GABARAP binds a region located in an unresolved disordered loop, distinct from the RagGTPase binding interface (purple). (D) Identified LIR domain is required for GABARAP-FNIP1 interaction. Immunoprecipitation of HEK293T cells transfected with the indicated constructs for 20 hours. LIR mutation = Y583A/V586A. (E) Crystal structure of FNIP2-GABARAP fusion protein. HP1 pocket shaded in green, and HP2 shaded in purple. FNIP2 LIR motif forms a β-sheet hairpin structure, with added interactions within the context of the hairpin N terminus to the core LIR motif. (F) Representation of similarity between GABARAP and LC3B in the LIR docking site. (G) Competition SPR of immobilized FLCN/FNIP2 and GABARAP in solution with FLCN/FNIP1 protein and FNIP2 peptide competitors highlights the essential role of the LIR motif in driving the initial GABARAP-FLCN/FNIP2 interaction. Regions outside of the LIR result in stabilization and strengthening of the interaction. (H) Molecular interactions within the FNIP2 hairpin outside the core LIR motif. Key residues are underlined. (I) Sequence divergence of key underlined residues in LC3B.
Fig. 5.
Fig. 5.. GABARAP-dependent sequestration of FLCN-FNIP complex is required to activate TFEB upon disruption of endolysosomal ion balance.
(A) Reconstitution of FNIP1/2 double KO (DKO) cells with either WT or LIR (LIR-mutant Y583A/V586A) FNIP1 reveals functional requirement of GABARAP interaction for TRPML1 agonist, but not EBSS, activation of TFEB. Western blot analysis of FNIP1 allele series treated with the indicated stimuli. l.e., long exposure. (B) Quantification of TFEB nuclear localization in WT or LIR expressing FNIP1/2_DKO HeLa cells treated with the indicated stimuli. Analysis was performed using high-content imaging. Means ± SD representative of independent experiments. Minimum of 1500 cells quantified per condition. C8 = 2 μM. ML-SA5 = 1 μM. ***P < 0.005, unpaired t test. (C) Functional TFEB response upon prolonged TRPML1 activation requires FNIP1 LIR domain. Western blot analysis of WT or LIR expressing FNIP1/2_DKO HeLa cells treated with the indicated stimuli. GPNMB is a validated TFEB/TFE3 transcriptional target. (D) Western blot analysis of membrane fractions from FNIP1 allele series after acute treatment with TRPML1 agonist for the indicated time points.
Fig. 6.
Fig. 6.. GABARAP regulates TFEB activation through FLCN relocalization during selective autophagy.
(A) HeLa.Cas9 or HeLa.Cas9 + Parkin cells treated with the indicated compounds for 4 hours and analyzed by immunofluorescence for TFEB. Data represent means ± SD from independent experiments. ***P < 0.005, unpaired t test. (B) Western blot of HeLa cells expressing Parkin and CRISPR KO for the indicated ATG8 family members treated with 0.78 μM valinomycin for 24 hours. (C) Cells of the indicated genotype treated with mitophagy inducers for 24 hours. (D) Western blot of TFEB mobility shift upon challenge with WT or ΔsopF Salmonella. HeLa cells infected for 30 min with the indicated strain. (E) Immunofluorescence of nuclear TFEB upon infection with Salmonella of the indicated genotype for 2 hours. (F) Quantification of TFEB nuclear localization. Minimum of 100 cells quantified per condition. ****P < 0.001, unpaired t test. (G) Cells of the indicated genotype infected with ΔsopF Salmonella and analyzed by immunofluorescence at 2 hours post-infection (h.p.i.). (H) Quantification of TFEB nuclear localization. A minimum of 100 cells were quantified per condition. ****P < 0.001, unpaired t test. (I) Analysis of TFEB transcriptional activity in cells of the indicated genotype at 10 h.p.i. with ΔsopF Salmonella. GPNMB and RRAGD represent TFEB target genes. (J) Immunofluorescence analysis of FLCN recruitment to Salmonella vacuoles.
Fig. 7.
Fig. 7.. Model.
GABARAP-dependent membrane sequestration of the FLCN-FNIP complex represents a TFEB activation paradigm distinct from nutrient starvation. The FLCN-FNIP GAP complex critically regulates the mTOR-dependent phosphorylation and cytosolic retention of the TFEB/TFE3 transcription factors by promoting the GDP-bound state of RagC/D. GDP-bound RagC/D directly binds to and presents TFEB/TFE3 as a substrate to mTOR (center inset), as described previously. During nutrient starvation (A), recruitment of FLCN-FNIP to the lysosomal membrane helps form the LFC, which has reduced GAP activity toward RagC/D. This is coincident with mTORC1 inhibition. Independently of LFC formation, GABARAP proteins bind directly to the FLCN-FNIP complex and sequester it at diverse intracellular membranes (B). This membrane recruitment is required for TFEB activation in response to endolysosomal ion disruption (CASM) and forms of selective autophagy (xenophagy and mitophagy). This suggests that FLCN-FNIP regulates cytosolic RagC-GTP (guanosine triphosphate) and its sequestration on intracellular membranes reduces access to this substrate, allowing nuclear retention of TFEB/TFE3 due to impaired Rag binding. Unlike (A), this novel TFEB activation pathway is permissive with mTORC1 activity. Subcellular redistribution of the FLCN-FNIP complex to both single and double membranes serves to broadly coordinate lysosomal capacity with homeostasis and perturbations within the endolysosomal network.

References

    1. Dikic I., Proteasomal and autophagic degradation systems. Annu. Rev. Biochem. 86, 193–224 (2017). - PubMed
    1. Lawrence R. E., Zoncu R., The lysosome as a cellular centre for signalling, metabolism and quality control. Nat. Cell Biol. 21, 133–142 (2019). - PubMed
    1. Kaur J., Debnath J., Autophagy at the crossroads of catabolism and anabolism. Nat. Rev. Mol. Cell Biol. 16, 461–472 (2015). - PubMed
    1. Ballabio A., Bonifacino J. S., Lysosomes as dynamic regulators of cell and organismal homeostasis. Nat. Rev. Mol. Cell Biol. 21, 101–118 (2020). - PubMed
    1. Florey O., Kim S. E., Sandoval C. P., Haynes C. M., Overholtzer M., Autophagy machinery mediates macroendocytic processing and entotic cell death by targeting single membranes. Nat. Cell Biol. 13, 1335–1343 (2011). - PMC - PubMed