. 2021 Oct 1;16(10):e0257911.
doi: 10.1371/journal.pone.0257911. eCollection 2021.

An improved statistical method to identify chemical-genetic interactions by exploiting concentration-dependence

Affiliations

An improved statistical method to identify chemical-genetic interactions by exploiting concentration-dependence

Esha Dutta et al. PLoS One. .

Abstract

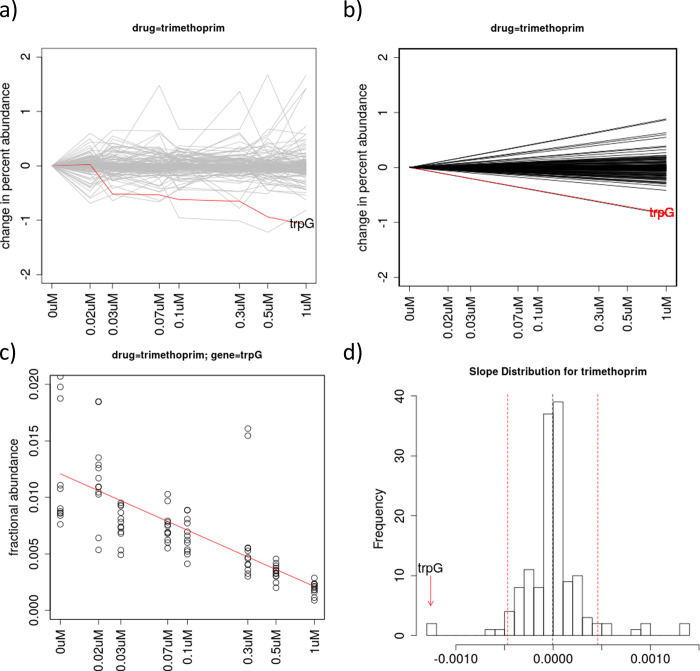
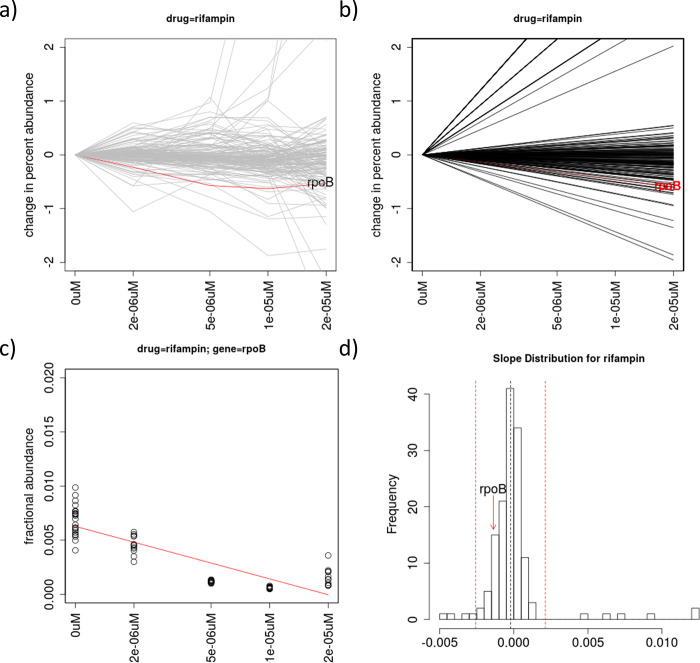
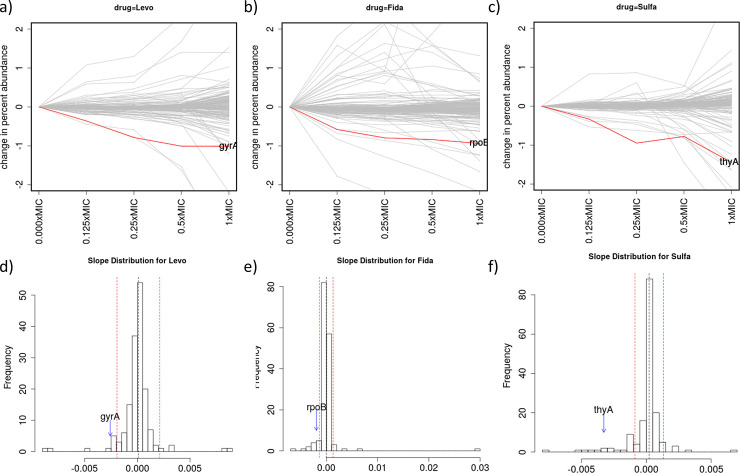
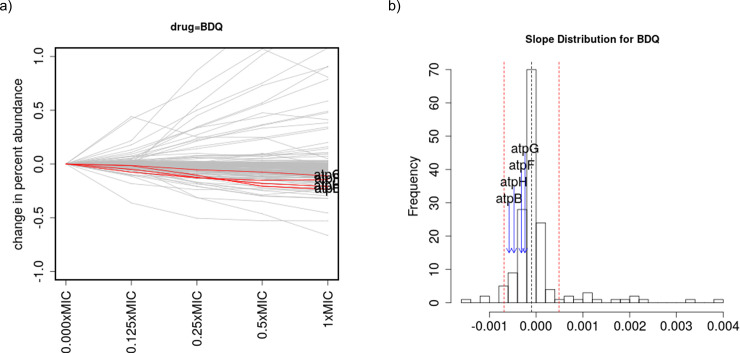
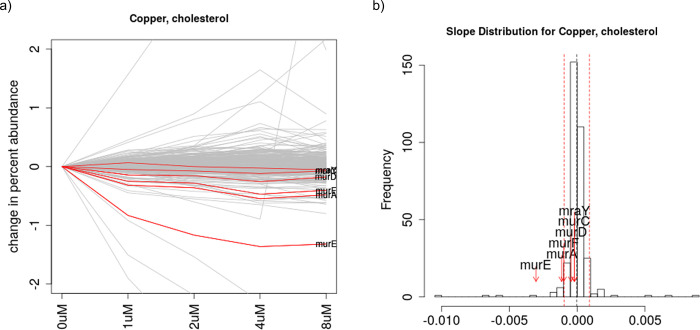
Chemical-genetics (C-G) experiments can be used to identify interactions between inhibitory compounds and bacterial genes, potentially revealing the targets of drugs, or other functionally interacting genes and pathways. C-G experiments involve constructing a library of hypomorphic strains with essential genes that can be knocked-down, treating it with an inhibitory compound, and using high-throughput sequencing to quantify changes in relative abundance of individual mutants. The hypothesis is that, if the target of a drug or other genes in the same pathway are present in the library, such genes will display an excessive fitness defect due to the synergy between the dual stresses of protein depletion and antibiotic exposure. While assays at a single drug concentration are susceptible to noise and can yield false-positive interactions, improved detection can be achieved by requiring that the synergy between gene and drug be concentration-dependent. We present a novel statistical method based on Linear Mixed Models, called CGA-LMM, for analyzing C-G data. The approach is designed to capture the dependence of the abundance of each gene in the hypomorph library on increasing concentrations of drug through slope coefficients. To determine which genes represent candidate interactions, CGA-LMM uses a conservative population-based approach in which genes with negative slopes are considered significant only if they are outliers with respect to the rest of the population (assuming that most genes in the library do not interact with a given inhibitor). We applied the method to analyze 3 independent hypomorph libraries of M. tuberculosis for interactions with antibiotics with anti-tubercular activity, and we identify known target genes or expected interactions for 7 out of 9 drugs where relevant interacting genes are known.


Conflict of interest statement

No. The authors have declared that no competing interests exist.

Figures

Fig 1
Fig 1. Analysis of data for treatment of an M. tuberculosis hypomorph library with trimethoprim.
(a) Plot of relative abundances of knock-down mutants for all 162 genes in the library, with the known interacting gene trpG highlighted in red, showing depletion as concentration increases. The Y-axis represents the change in percent abundance of each gene, which is calculated by subtracting the mean relative abundance for each gene at 0 μM, so they all fan out from 0 in the superposition. (b) Plot of regression lines for all the genes based on slopes as random-effect coefficients in the linear mixed-model, fit to the abundance data in (a). (c) Plot of relative abundance data points and regression line fit specifically for trpG, as an illustration of the variability of the data among concentrations and replicates. (d) Histogram of the slope coefficients for all genes in the library, with trpG highlighted as an outlier (most negative slope). The dashed red lines indicate the outlier cutoffs defined by Zrobust = ±3.5.
Fig 2
Fig 2. Analysis of data for treatment of an M. tuberculosis hypomorph library with rifampin.
(a) Plot of relative abundances of knock-down mutants for all 162 genes in the library, with the known interacting gene rpoB highlighted in red, showing depletion. The Y-axis represents the change in percent abundance of each gene, as in Fig 1. (b) Plot of regression lines for all the genes based on slopes as random-effect coefficients in the linear mixed-model. (c) Plot of relative abundance data points and regression line fit specifically for rpoB. (d) Histogram of the slope coefficients for all genes in the library, with rpoB highlighted (with negative slope, but not an outlier). The dashed red lines indicate the outlier cutoffs defined by Zrobust = ±3.5.
Fig 3
Fig 3. Analysis of chemical-genetic interactions with levofloxacin (Levo), fidaxomicin (Fida), and sulfamethoxazole (Sulfa).
Abundance plots for all genes in the hypomorph library (a-c), and histograms of the distribution of slopes for each gene (d-f). gyrA, rpoB, and thyA clearly stand out as outliers for levofloxacin, fidaxomicin, and sulfamethoxazole, respectively.
Fig 4
Fig 4. Analysis of chemical-genetic interactions with bedaquiline (BDQ).
a) abundance plot for all genes in the hypomorph library, and b) histogram of the distribution of slopes for each gene. For bedaquiline, none of the 4 ATP synthase subunits in the library was detected as an outlier, but collectively, they all exhibited negative slopes, indicating depletion with increasing drug concentration.
Fig 5
Fig 5. Abundance plot and slope histogram for genes in an M. tuberculosis hypomorph library treated with copper.
Six genes of the muramic acid pathway, which is required for peptidoglycan synthesis, are highlighted in red, indicating increased sensitivity of this pathway with increasing concentrations of copper.

References

    1. Cacace E., Kritikos G., and Typas A., Chemical genetics in drug discovery. Curr Opin Syst Biol, 2017. 4: p. 35–42. doi: 10.1016/j.coisb.2017.05.020 - DOI - PMC - PubMed
    1. Evans J.C. and Mizrahi V., The application of tetracyclineregulated gene expression systems in the validation of novel drug targets in Mycobacterium tuberculosis. Front Microbiol, 2015. 6: p. 812. doi: 10.3389/fmicb.2015.00812 - DOI - PMC - PubMed
    1. Schnappinger D. and Ehrt S., Regulated Expression Systems for Mycobacteria and Their Applications. Microbiol Spectr, 2014. 2(1). - PMC - PubMed
    1. Wei J.R., et al.., Depletion of antibiotic targets has widely varying effects on growth. Proceedings of the National Academy of Sciences of the United States of America, 2011. 108(10): p. 4176–4181. doi: 10.1073/pnas.1018301108 - DOI - PMC - PubMed
    1. Rock J.M., et al.., Programmable transcriptional repression in mycobacteria using an orthogonal CRISPR interference platform. Nat Microbiol, 2017. 2: p. 16274. doi: 10.1038/nmicrobiol.2016.274 - DOI - PMC - PubMed

Publication types

MeSH terms

Substances