. 2021 Oct 11;39(10):1422-1437.e10.
doi: 10.1016/j.ccell.2021.08.011. Epub 2021 Sep 30.

The landscape of tumor cell states and ecosystems in diffuse large B cell lymphoma

Affiliations

The landscape of tumor cell states and ecosystems in diffuse large B cell lymphoma

Chloé B Steen et al. Cancer Cell. .

Abstract

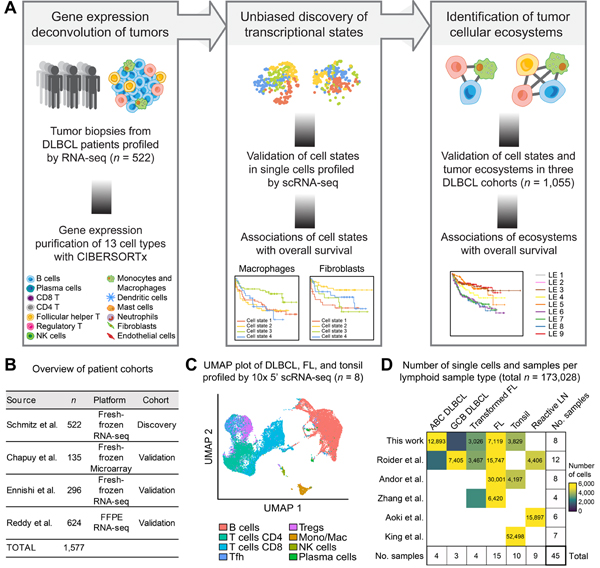
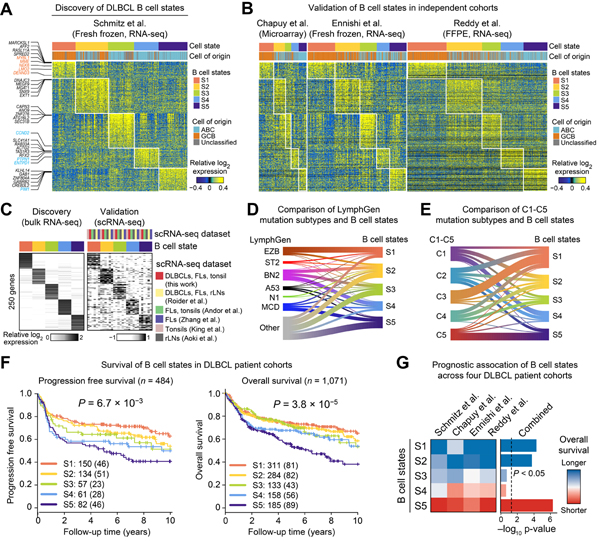
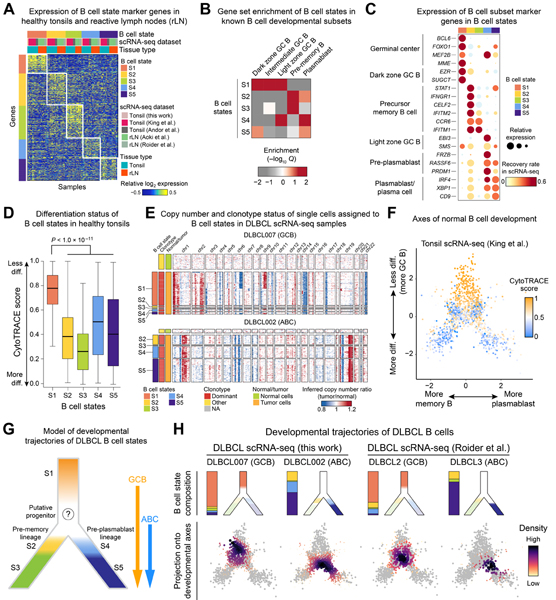
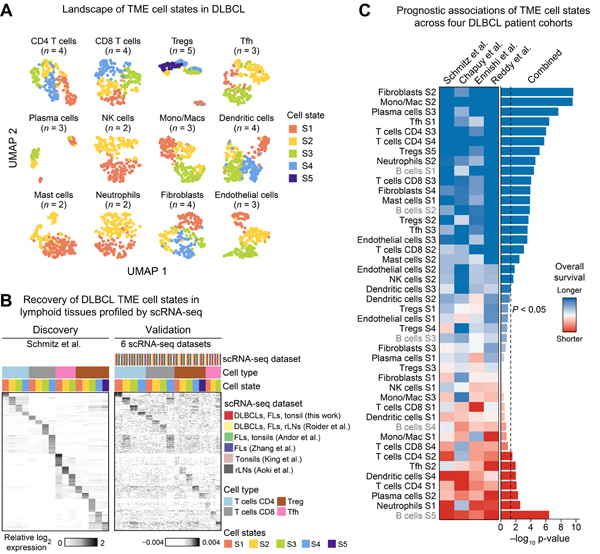
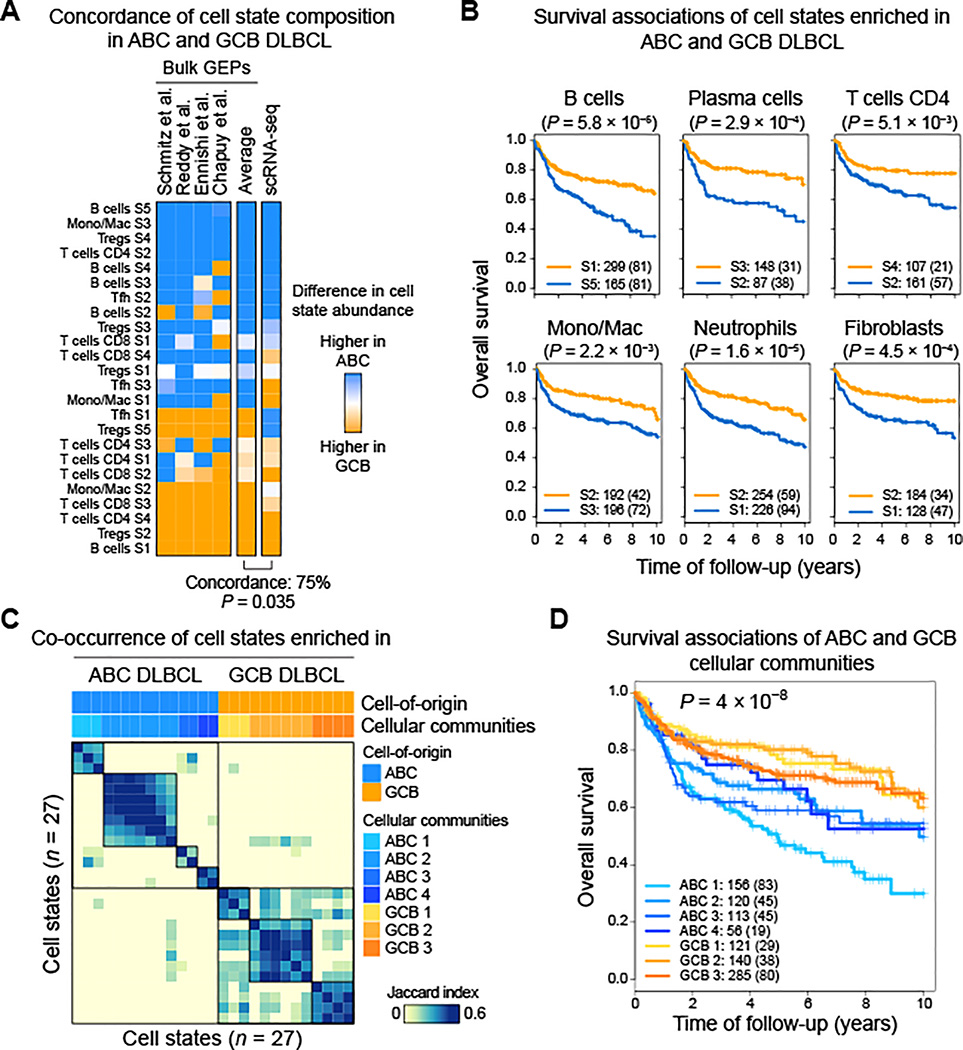
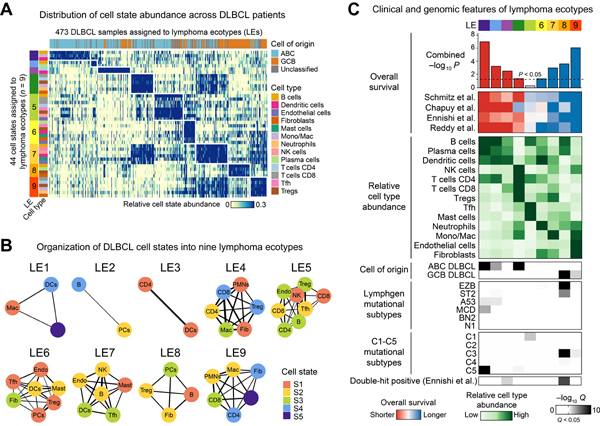
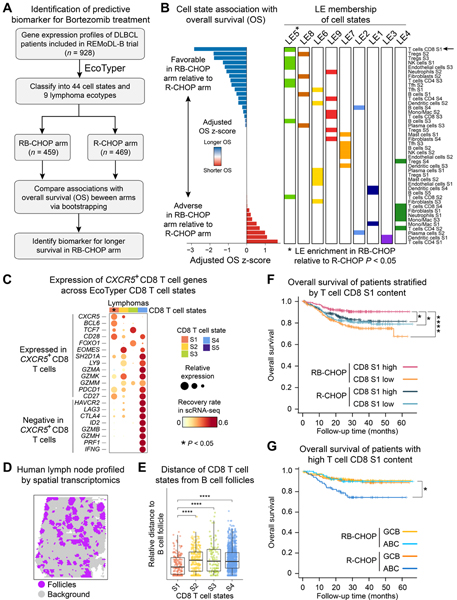
Biological heterogeneity in diffuse large B cell lymphoma (DLBCL) is partly driven by cell-of-origin subtypes and associated genomic lesions, but also by diverse cell types and cell states in the tumor microenvironment (TME). However, dissecting these cell states and their clinical relevance at scale remains challenging. Here, we implemented EcoTyper, a machine-learning framework integrating transcriptome deconvolution and single-cell RNA sequencing, to characterize clinically relevant DLBCL cell states and ecosystems. Using this approach, we identified five cell states of malignant B cells that vary in prognostic associations and differentiation status. We also identified striking variation in cell states for 12 other lineages comprising the TME and forming cell state interactions in stereotyped ecosystems. While cell-of-origin subtypes have distinct TME composition, DLBCL ecosystems capture clinical heterogeneity within existing subtypes and extend beyond cell-of-origin and genotypic classes. These results resolve the DLBCL microenvironment at systems-level resolution and identify opportunities for therapeutic targeting (https://ecotyper.stanford.edu/lymphoma).

Keywords: CIBERSORTx; DLBCL; EcoTyper; diffuse large B cell lymphoma; digital cytometry; expression deconvolution; lymphoma; tumor ecosystems; tumor immunology; tumor microenvironment.


Conflict of interest statement

Declaration of interests D.M.K. reports paid consultancy from Roche Molecular Diagnostics. M.D. reports research funding from Varian Medical Systems and Illumina, ownership interest in CiberMed and Foresight Diagnostics, patent filings related to cancer biomarkers, and paid consultancy from Roche, AstraZeneca, RefleXion, and BioNTech. A.M.N. reports ownership interest in CiberMed and patent filings related to cancer biomarkers. A.A.A. reports research support from Bristol Meyers Squibb, ownership interest in CiberMed, FortySeven Inc., and Foresight Diagnostics, patent filings related to cancer biomarkers, and paid consultancy from Genentech, Roche, Chugai, Gilead, and Celgene. C.B.S., B.A.L., A.J.G., A.M.N., and A.A.A. have filed patent application PCT/US2020/059,196. The remaining authors declare no competing interests.

Figures

Figure 1.
Figure 1.. Framework for Large-Scale Determination of Cell States and Ecosystems in DLBCL.
(A) Overview of EcoTyper and its application to cell state discovery and ecosystem profiling in DLBCL. LE, lymphoma ecotype. (B) Summary of DLBCL patient cohorts and bulk tumor transcriptomes. (C) UMAP of seven lymphoid tumors and one tonsil specimen profiled in this work by scRNA-seq. (D) Heat map showing the number of cells (post-quality control) per lymphoid scRNA-seq dataset analyzed in this study. See also Figure S1.
Figure 2.
Figure 2.. Molecular and Clinical Characteristics of B Cell States in DLBCL.
(A) Heat map depicting five B cell states identified from digitally purified DLBCL B cell transcriptomes (discovery cohort). Patient samples (columns) are organized by the most prevalent cell state and annotated with bulk tumor COO labels. Only genes used for cell state discovery are shown (n = 1,000). (B) Same as A but for three validation cohorts. (C) Expression of B cell state-specific marker genes (n = top 50 by log2 fold change) in the discovery cohort (left) and six lymphoid scRNA-seq datasets (right). (D) Overlap between LymphGen subtypes and DLBCL B cell states in the discovery cohort. (E) Overlap between C1-C5 subtypes and DLBCL B cell states in the Chapuy et al. cohort. Samples were assigned to the most abundant B cell state in D and E (Table S2). (F) Progression free survival (PFS) and overall survival (OS) for each B cell state in four DLBCL cohorts (Figure 1B). Significance was determined by a two-sided log-rank test. (G) Left: Association of each B cell state with OS. Right: Survival associations integrated across cohorts (STAR Methods). Survival associations are expressed as −log10 p-values oriented by survival direction (red, shorter OS; blue, longer OS). See also Figure S2.
Figure 3.
Figure 3.. Developmental Ontogeny of DLBCL.
(A) Expression of DLBCL B cell state-specific marker genes (same as Figure 2A) in healthy lymphoid B cells profiled by scRNA-seq (tonsils, n = 10; reactive lymph nodes, n = 9). Expression values are averaged by sample. (B) Comparison of DLBCL B cell states defined by EcoTyper (rows) with normal tonsillar B cell phenotypes profiled by scRNA-seq (columns) (Holmes et al., 2020). Enrichment was determined by pre-ranked gene set enrichment analysis (STAR Methods). (C) Lineage marker expression in B cells from six lymphoid scRNA-seq datasets (Figure 1D) classified into DLBCL B cell states. The size and color of each bubble represent the relative expression of each state and the proportion of scRNA-seq datasets that show higher expression in the indicated state, respectively. GC, germinal center. (D) Differentiation status of DLBCL B cell states (CytoTRACE) in tonsillar B cells profiled by scRNA-seq. Data are presented as boxplots (center line, median; box limits, upper and lower quartiles; whiskers, largest and smallest values within 1.5×IQR of the box limits; IQR, interquartile range). Significance was assessed relative to S1 by a two-sided Wilcoxon rank sum test. diff., differentiation. (E) BCR clonotype status and B cell copy number profiles from DLBCL tumors profiled by scRNA-seq. Malignant B cells (rows) are organized by B cell state, with genes (columns) ordered by chromosomal location. (F) Low-dimensional embedding of normal tonsillar B cells, shown according to the expression of metagenes capturing two axes of normal development (STAR Methods). CytoTRACE scores (panel D) are shown for each cell. (G) Model of DLBCL development, as informed by EcoTyper. (H) Bottom: Projection of DLBCL B cells onto the same transcriptional embedding from F. Point size reflects the number of DLBCL cells (density). Top: Model from G showing the cell state distribution of each sample, with states colored as in C and with opacity proportional to each state’s relative abundance. See also Figure S3.
Figure 4.
Figure 4.. Composition and Prognostic Atlas of the DLBCL Tumor Microenvironment.
(A) UMAP plots of TME cell states in the DLBCL discovery cohort. Every point represents a cell type-specific GEP classified by its most abundant cell state. The number of states per cell type is provided in parentheses. (B) Relative expression of state-specific marker genes for all evaluated T cell types in the discovery cohort (left) and in six lymphoid scRNA-seq datasets (right). Mean log2 expression is shown for each cell state and dataset. (C) Cell state-specific survival associations in four DLBCL cohorts (Figure 1B, Table S3). TME and B cell state labels are contrasted by black and gray text, respectively. See also Figure S4.
Figure 5.
Figure 5.. The Tumor Microenvironment of ABC and GCB DLBCL.
(A) Average composition of cell states in ABC versus GCB DLBCL, shown for bulk tumors decoded by EcoTyper (‘Bulk GEPs’) and seven de novo DLBCL tumors profiled by scRNA-seq. scRNA-seq data were assigned to EcoTyper states without prior knowledge of COO (STAR Methods). Significance was assessed by a Fisher’s exact test. Only cell types detected in scRNA-seq profiles of DLBCL tumors were analyzed (Figure S1C). (B) OS curves for selected cell states enriched in ABC or GCB DLBCL. Patients were stratified by assigning each tumor to its most prevalent state per cell type (blue, ABC-enriched state; orange, GCB-enriched state). (C) Co-occurrence patterns of cell states with significant enrichment in ABC or GCB tumors profiled in the discovery cohort. Co-occurrence was calculated using the Jaccard index adjusted for statistical significance (STAR Methods). (D) Differences in OS for cellular communities defined in C. All four DLBCL cohorts were analyzed in B,D. Significance in B,D was determined by a two-sided log-rank test. See also Figure S5.
Figure 6.
Figure 6.. Landscape of Cellular Ecosystems in DLBCL.
(A) Cell state abundance patterns in the discovery cohort, with cell states organized into nine lymphoma ecotypes (LEs) and tumor samples (columns) ordered by the most abundant LE per sample. Only tumors assigned to LEs are shown (n = 473). (B) LE-specific cell states. Edge thickness denotes co-association strength as quantified by the Jaccard index. (C) Characteristics of LEs across four DLBCL cohorts. Top: Univariable associations with OS. Center: Estimated cell type composition of tumors classified into LE-specific subgroups on the basis of the most prevalent LE per sample. Relative abundance is shown averaged per LE subgroup and scaled from 0 to 1. Bottom: Enrichment of molecular subtypes in each LE subgroup (defined as above), calculated as described in STAR Methods. See also Figure S6.
Figure 7.
Figure 7.. Prediction of Response to Bortezomib in DLBCL.
(A) Outline of the approach. (B) Association between cell states and therapeutic benefit from RB-CHOP relative to R-CHOP. Cell states were ranked by an adjusted OS z-score that penalizes associations with OS in R-CHOP (Figure S7A,B). LE-specific cell states were tested for their association with benefit from RB-CHOP via pre-ranked gene set enrichment analysis. (C) Expression of positive and negative marker genes of CXCR5+ CD8 T cells, shown for lymphoma-associated T cells profiled by scRNA-seq and mapped to EcoTyper states (Figure S1C, Table S1). Bubble size represents the mean log2 expression of each gene, normalized from 0 to 1, while color represents the fraction of tumors with higher expression in the indicated state. Only CD8 T S1 showed significant overlap with known CXCR5+ CD8 T cell markers (STAR Methods). (D) Localization of genes marking follicles in a normal human lymph node profiled by spatial transcriptomics (ST). (E) Relative distance of each CD8 T cell state from spots annotated as follicles in the ST array (panel D). Data are presented as boxplots (center line, median; box limits, upper and lower quartiles; whiskers, largest and smallest values within 1.5×IQR of the box limits; IQR, interquartile range). Significance was assessed using a two-sided Wilcoxon rank sum test. (F) Differences in OS for patients stratified by treatment arm and by groups with high or low levels of T cell CD8 S1 (median split). (G) Same as F but showing patients with high T cell CD8 S1 content stratified by COO and treatment arm. Significance in C,D was assessed by a two-sided log-rank test. For panels E, F and G: *P < 0.05; ****P < 0.0001. See also Figure S7.

Comment in

Similar articles

Cited by

References

    1. Advani R, Flinn I, Popplewell L, Forero A, Bartlett NL, Ghosh N, Kline J, Roschewski M, LaCasce A, Collins GP, et al. (2018). CD47 Blockade by Hu5F9-G4 and Rituximab in Non-Hodgkin’s Lymphoma. N Engl J Med 379, 1711–1721. - PMC - PubMed
    1. Alizadeh AA, Eisen MB, Davis RE, Ma C, Lossos IS, Rosenwald A, Boldrick JC, Sabet H, Tran T, Yu X, et al. (2000). Distinct types of diffuse large B-cell lymphoma identified by gene expression profiling. Nature 403, 503–511. - PubMed
    1. Altschul SF, Gish W, Miller W, Myers EW, and Lipman DJ (1990). Basic local alignment search tool. J Mol Biol 215, 403–410. - PubMed
    1. Alvaro T, Lejeune M, Salvado MT, Lopez C, Jaen J, Bosch R, and Pons LE (2006). Immunohistochemical patterns of reactive microenvironment are associated with clinicobiologic behavior in follicular lymphoma patients. J Clin Oncol 24, 5350–5357. - PubMed
    1. Andor N, Simonds EF, Czerwinski DK, Chen J, Grimes SM, Wood-Bouwens C, Zheng GXY, Kubit MA, Greer S, Weiss WA, et al. (2019). Single-cell RNA-Seq of follicular lymphoma reveals malignant B-cell types and coexpression of T-cell immune checkpoints. Blood 133, 1119–1129. - PMC - PubMed

Publication types