. 2021 Nov 4;81(21):4440-4456.e7.
doi: 10.1016/j.molcel.2021.09.008. Epub 2021 Sep 30.

The Protexin complex counters resection on stalled forks to promote homologous recombination and crosslink repair

Affiliations

The Protexin complex counters resection on stalled forks to promote homologous recombination and crosslink repair

Richard O Adeyemi et al. Mol Cell. .

Abstract

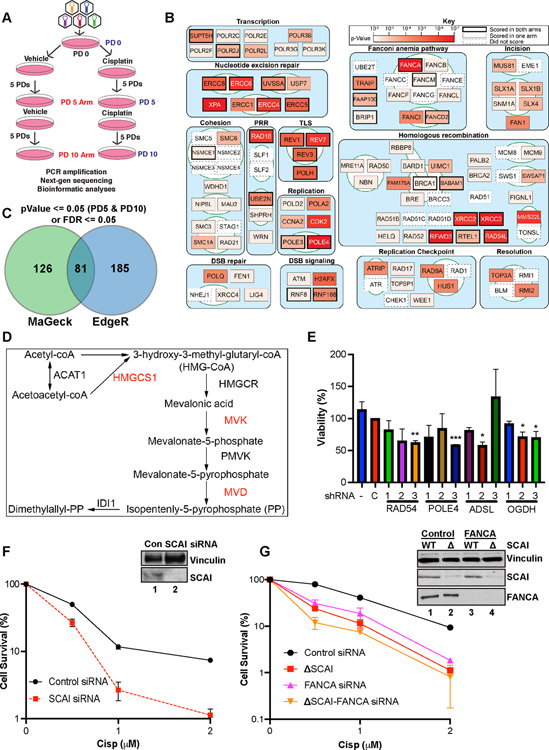
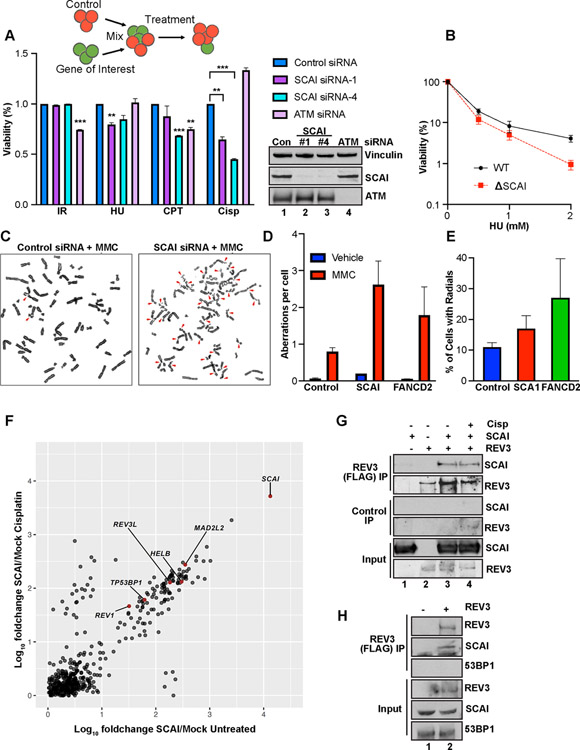
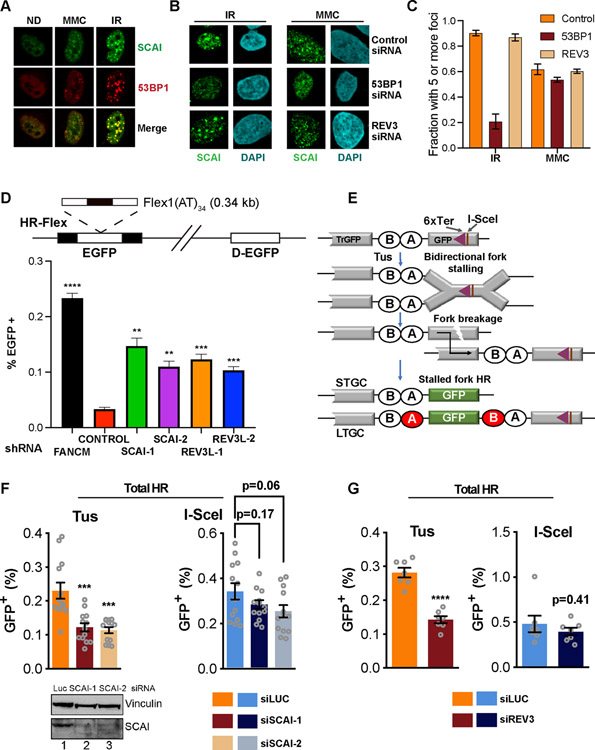
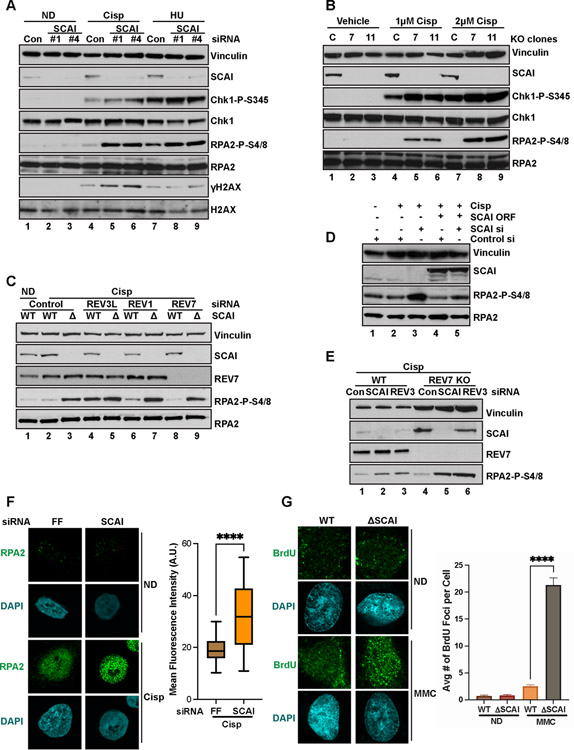
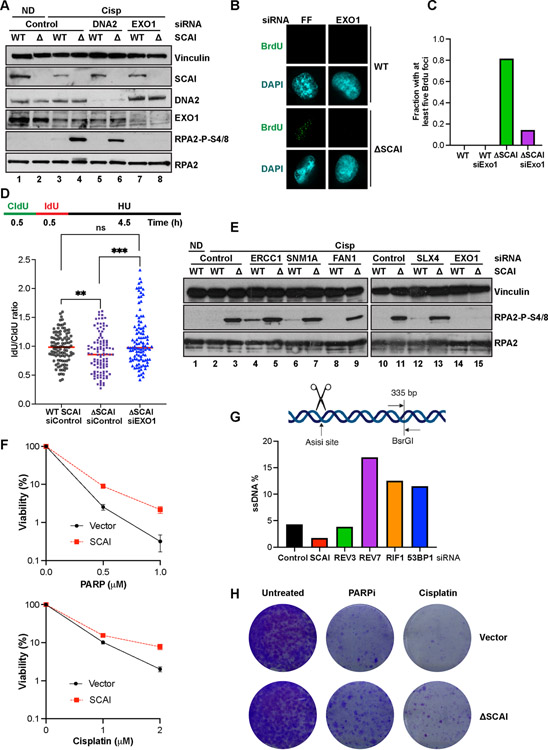
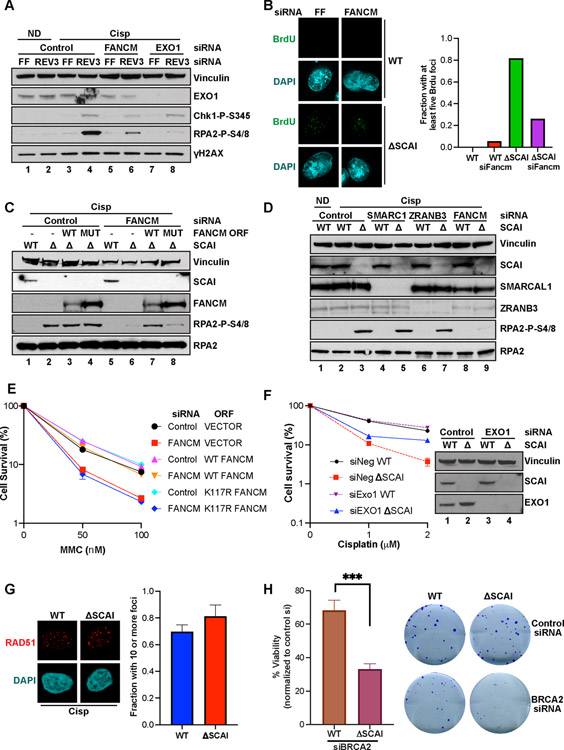
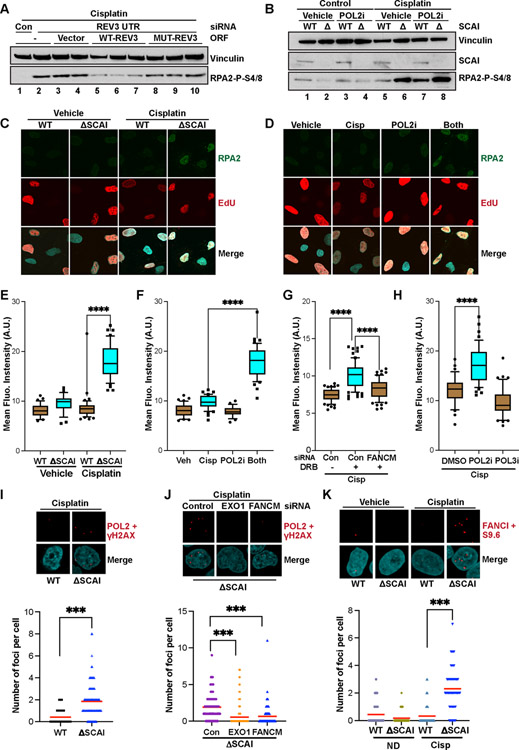
Protection of stalled replication forks is critical to genomic stability. Using genetic and proteomic analyses, we discovered the Protexin complex containing the ssDNA binding protein SCAI and the DNA polymerase REV3. Protexin is required specifically for protecting forks stalled by nucleotide depletion, fork barriers, fragile sites, and DNA inter-strand crosslinks (ICLs), where it promotes homologous recombination and repair. Protexin loss leads to ssDNA accumulation and profound genomic instability in response to ICLs. Protexin interacts with RNA POL2, and both oppose EXO1's resection of DNA on forks remodeled by the FANCM translocase activity. This pathway acts independently of BRCA/RAD51-mediated fork stabilization, and cells with BRCA2 mutations were dependent on SCAI for survival. These data suggest that Protexin and its associated factors establish a new fork protection pathway that counteracts fork resection in part through a REV3 polymerase-dependent resynthesis mechanism of excised DNA, particularly at ICL stalled forks.

Keywords: CRISPR; EXO1; FANCM; Protexin; REV3L; SCAI; homologous recombination; inter-strand crosslinks; replication stress; resection.


Conflict of interest statement

Declaration of interests The authors declare no competing interests. S.J.E. is a member of the Molecular Cell advisory board.

Figures

Figure 1.
Figure 1.. Genetic screen identifies genes important for cisp sensitivity including SCAI.
(A) Screen schematic. Cisp treatment was 1.5 μM at PD0 and was repeated at 1 μM at PD5 for the PD10 arm. PD - population doubling. (B) Pathway map showing the top scoring known DNA repair genes from our screens. Some DNA replication and RNA transcription genes were omitted for space constraints. (C) Genes with significant p-values at both PD5 and PD10 or false discovery rates (FDR) <= 0.05 were included. Venn diagram shows the hits identified by EdgeR and MAGeCK. (D) Mevalonate pathway map. Red - genes that scored in the screen. (E) U2OS cells were transduced with lentiviruses expressing shRNAs against the indicated genes, no shRNA, or a control shRNA, C. Cells in 96-well plates were treated with vehicle or 1 μM cisp for 24 h and analyzed by AlamarBlue viability assays at 72 h. Data is mean ± SEM of two independent experiments. *= p<0.05, **= p<0.01, ***=p<0.001. (F) Colony survival assays (CSA) showing survival of control or SCAI siRNA-treated U2OS cells treated with cisp. Data are normalized to untreated cells for each siRNA condition. Mean ± SEM survival of 2 independent experiments shown. Inset. Western blot showing depletion of SCAI. (G) CSA showing survival of WT and SCAI null with or without siRNA to FANCA. Mean ± SEM of two independent experiments shown. Inset. Western blots showing SCAI and FANCA depletion.
Figure 2.
Figure 2.. SCAI promotes repair during replication stress and forms a novel complex with REV3
(A) Top. Schematic of the MCA assay. Middle. Relative sensitivity of SCAI and ATM depletion following treatment with 3 Gray (Gy) IR, 2 mM HU, 100 nM CPT or 1 μM cisp (Cisp) for 24 h. Data are normalized to untreated cells. Mean ± SEM values are plotted. Bottom panel: Western blots showing SCAI and ATM depletion. (B) CSA showing survival of WT and SCAI null U2OS cells following treatment with 0.5, 1 or 2 mM HU for 24 h. Mean ± SEM of 2 independent experiments shown. (C) Representative images showing increased genomic instability in MMC-treated, 293Ts following SCAI siRNA compared to control. (D, E) Quantification of aberrations (D) and radial percentages (E) from experiment shown in (C). Mean ± SEM of 2 independent experiments shown. (F) IP mass spec analyses showing normalized fold changes of IP’d peptides from FLAG-HA-SCAI vs vector-expressing 293-TREX cells following mock or cisp treatment. (G) 293Ts transfected with vector, GFP-SCAI and/or FLAG-REV3 as indicated for 60 h and treated or not with 2 μM cisp for 3 h. Pellets were IP’d with control or FLAG beads and processed for immunoblotting. (H) 293T cells were transfected with vector or FLAG-REV3 and processed as above.
Figure 3.
Figure 3.. Protexin is important for genomic stability and repair at stalled forks
(A) IF images showing foci of FLAG-SCAI and 53BP1 following 100 nM MMC (6h) or 4Gy IR (4h) treatment. (B) FLAG-SCAI U2OS transfected with the indicated siRNAs (48 h) then treated and processed for IF as in (A). (C) Quantification of the experiment shown in (B). At least 50 cells were counted per condition. (D) Top. Schematic showing the EGFP-based HR-Flex reporter described in experimental procedures. D-EGFP: donor EGFP. Bottom. Reporter cell lines were infected with the indicated shRNAs and assessed for GFP expression by flow after 14d. (E) Schematic of the Tus/6xTer HR reporter and HR repair products of Tus-Ter induced fork stalling. TrGFP is 5’ truncated GFP. The triangle shows the 6xTer site adjacent to I-SceI. Open ovals A and B: 5’ and 3’ artificial RFP exons. STGC, LTGC: short tract and long tract gene conversion HR repair outcomes. LTGC generates wtRFP through splicing (red filled ovals). (F) HR frequencies in mouse 6xTer/HR cells co-transfected with Tus (top left panel) or I-SceI (top right panel) and either control or two different mouse siRNAs against SCAI. Total HR represents combination of STGC and LTGC values. Data represent the mean ± SEM. Welch’s test, ***=p<0.001. (G) HR frequencies in 6xTer/HR cells co-transfected with Tus (top left panel) or I-SceI (top right panel) and either control or siRNAs against REV3. Data represent the mean ± SEM. Welch’s test, ****=p<0.0001.
Figure 4.
Figure 4.. SCAI limits accumulation of nuclear ssDNA during replication stress
(A) U2OS cells transfected with the indicated siRNAs for 72 h, then treated with 2 μM Cisp or 1 mM HU for 18 h, harvested and processed for western blotting with the indicated antibodies. ND-no drug. (B) WT U2OS and two independent SCAI null clones (7, 11) were treated with the indicated doses of cisp for 18 h before immunoblotted. (C) U2OS cells were transduced with vector or siRNA resistant FLAG-SCAI. Cells were then treated with indicated siRNAs, with or without 1.5 μM cisp for 18 h before western blotting. (D) WT and SCAI-null U2OS were treated with the indicated siRNAs for 72 h, then treated with vehicle (ND) or 1.5 μM cisp for 18 h before immunoblotting. (E) WT and REV7-null U2OS were transfected with the indicated siRNAs for 72 h, then treated 2 μM cisp for 18 h before immunoblotting. (F) HeLas were transfected with the indicated siRNA for 60 h before treatment with no drug or 0.5 μM Cisp for 6 h. Cells were processed for RPA2 IF. Intensity of nuclear RPA staining from was quantified in 50 cells using ImageJ and plotted. T-tests, **** = p<0.0001. (G) WT or SCAI null U2OS were BrdU labeled and then treated with vehicle (ND) or 1 μM MMC for 6 h and processed for BrdU IF. Average number of BrdU foci per cell was quantified and plotted on the right. T-tests, **** = p<0.0001.
Figure 5.
Figure 5.. SCAI protects stalled forks but not DSBs against resection by EXO1 and promotes resistance to PARP inhibitors.
(A) Cells treated with the indicated siRNA for 72 h were treated with vehicle or 2 mM cisp for 16 h and analyzed by immunoblotting. (B) IF analyses showing representative BrdU foci from WT and SCAI nulls following 60 h treatment with the indicated siRNAs. Cells were treated with MMC for 6 h prior to IF. (C) Quantification of B. (D) Top. Schematic showing DNA fiber assay protocol. Cells were pulsed with CldU followed by IdU for 30 m each after which forks were stalled by 4 mM HU treatment for 4.5 h. Bottom. WT and SCAI-nulls were treated with indicated siRNAs for 60 h before labeling as in schematic. DNA combing analyses was performed and approximately 100 fibers were quantified and plotted. Mann Whitney test, ns=p>0.05, **=p<0.01, ***=p<0.001. (E) WT and SCAI-null U2OS were treated with the indicated siRNAs for 72 h, then treated with vehicle (ND) or 2 μM cisp for 18 h before immunoblotting. The same samples were run in lanes 2–3 and lanes 10–11. Depletion of indicated proteins is shown in Figure S5F. (F) ER-AsiSi U2OS transfected with the indicated siRNAs for 60 h were treated with Tamoxifen to induce DSBs. Cells were harvested in low-melting agarose, proteinase-treated and genomic DNA was extracted. After restriction digest, qPCR was performed to determine resection efficiency. (G) BRCA1-null, TP53-null RPE1 cells expressing SCAI or vector control were treated with vehicle, or the indicated doses of olaparib or cisp for 2 weeks and allowed to form colonies. Mean ± SD two independent experiments. Representative images shown.
Figure 6.
Figure 6.. Protexin protects FANCM-reversed forks from degradation
(A) U2OS transfected with the indicated siRNAs 60 h were treated with vehicle (ND) or 2 μM cisp for 18 h before immunoblotting. (B) IF showing representative BrdU foci from WT and SCAI nulls 60 h post treatment with indicated siRNAs. Cells were treated with MMC for 6 h prior to IF analyses. Quantification shown on the right. At least 100 cells were counted per condition. (C) WT and SCAI-nulls transduced with vector (V), WT or K117R mutant (Mut) FANCM ORFs were then treated with control or siRNA to FANCM 3’ UTR for 72 h, then treated with vehicle or 1.5 μM cisp for 18 h before immunoblotting. (D) WT and SCAI-null U2OS were treated with control or the indicated siRNAs for 72 h. Cells were then treated with vehicle (ND) or 1.5 μM cisp for 18 h before immunoblotting. (E) U2OS cells expressing vector (VECTOR), WT-FANCM (FANCM-ORF) or K117R-FANCM ORFs (K117R-ORF) were transfected with control (siNeg) or siRNAs to FANCM 3’UTR (siFancm) for 48 h, treated with vehicle or the indicated MMC doses and analyzed by CSAs. Data are normalized to untreated cells for each siRNA condition. Mean ± SEM survival of two independent experiments shown. (F) WT and SCAI-null U2OS were treated with siRNAs to EXO1 or control for 48 h before 16 h treatment with vehicle or 2 μM cisp. CSAs showing increased survival upon depletion of EXO1 in SCAI-nulls. Viability is relative to vehicle-treated cells. Mean ± SEM of two independent experiments shown. Western blots shown on the right. (G) WT and SCAI-null U2OS were treated with 0.5 μM cisp for 18 h before staining for RAD51 foci by IF. Representative images shown. Quantified in right panel. At least 100 cells were counted in each condition. (H). WT and SCAI-nulls were treated with control or siRNA to BRCA2 for 48 h. Cells were seeded onto plates for CSA. Representative images shown on the right.
Figure 7.
Figure 7.. Protexin loss exposes a previously uncharacterized role for RNA polymerase activity and REV3 polymerase activity in fork protection.
(A) WT U2OS were stably transfected with linearized plasmids expressing tagged vector, WT REV3 or REV3 D2781A/D2783A (lacking polymerase activity) and clones were selected. WT U2OS or the above clones were treated with control or an siRNA to endogenous REV3’s 3’ UTR as indicated for 48 h then treated with cisp for 18 h before immunoblotting. (B) WT and SCAI-null U2OS cells were treated with 2 μM cisp or vehicle for 10 h then with vehicle control or 10 μg/ml α-amanitin (POL2i) for 6 h before immunoblotting. (C). WT and SCAI-null U2OS were treated with EdU 15 minutes prior to treatment with vehicle or 5 μM cisp for 3 h. Cells were pre-extracted and stained for RPA2 and EdU (via click-it reaction). Nuclear intensity of EdU positive cells was measured by imageJ. Representative images shown. (D) WT U2OS were treated with EdU and either vehicle, 5 μM cisp for 3 h, α-Amanitin for 2 h or both (α-Amanitin added after 1 h cisp treatment) and processed as in (C). Representative images shown. (E) Quantification of the experiments in (C). T-tests, **** = p<0.0001. (F) Quantification of the experiments in (D). T-tests, **** = p<0.0001. (G) WT U2OS were treated with control or siRNA to FANCM for 48 h then with EdU and 5 μM cisp for 1 hr followed by vehicle or 100 μM DRB for 2 h before processing as in (C). Quantification shown. T-tests, **** = p<0.0001. (H) WT U2OS were treated with EdU and 5 μM cisp for 1 hr. Vehicle, α-Amanitin (POL2i) or ML-60218 (POL3i) were then added for 2 h before processing as in (C). Quantification shown. T-tests, **** = p<0.0001 (I) WT and SCAI-null U2OS treated with 1 μM cisp for 8 h were processed for PLAs using the indicated antibodies. Quantification shown in bottom panel. Mann Whitney test, ***=p<0.001. (J) SCAI-null U2OS transfected with the indicated siRNAs for 60 h, were treated with 1 μM cisp for 8 h and processed for PLAs as in (I). Quantification shown in bottom panel. Mann Whitney test, ***=p<0.001. (K) WT and SCAI-null U2OS transfected with the indicated siRNAs for 60 h, were treated with 1 μM cisp for 8 h, pre-extracted, fixed and processed for PLAs using the indicated antibodies. Quantification shown in bottom panel. Mann Whitney test, ***=p<0.001.

References

    1. Abdullah UB, McGouran JF, Brolih S, Ptchelkine D, El-Sagheer AH, Brown T, and McHugh PJ (2017). RPA activates the XPF-ERCC1 endonuclease to initiate processing of DNA interstrand crosslinks. EMBO J 36, 2047–2060. - PMC - PubMed
    1. Amunugama R, Willcox S, Wu RA, Abdullah UB, El-Sagheer AH, Brown T, McHugh PJ, Griffith JD, and Walter JC (2018). Replication Fork Reversal during DNA Interstrand Crosslink Repair Requires CMG Unloading. Cell Rep 23, 3419–3428. - PMC - PubMed
    1. Andreassen PR, D’Andrea AD, and Taniguchi T (2004). ATR couples FANCD2 monoubiquitination to the DNA-damage response. Genes Dev 18, 1958–1963. - PMC - PubMed
    1. Bluteau D, Masliah-Planchon J, Clairmont C, Rousseau A, Ceccaldi R, d’Enghien CD, Bluteau O, Cuccuini W, Gachet S, de Latour RP, et al. (2017). Biallelic inactivation of REV7 is associated with Fanconi anemia. J Clin Invest 127, 1117. - PMC - PubMed
    1. Brandt DT, Baarlink C, Kitzing TM, Kremmer E, Ivaska J, Nollau P, and Grosse R (2009). SCAI acts as a suppressor of cancer cell invasion through the transcriptional control of beta1-integrin. Nat Cell Biol 11, 557–568. - PubMed

Publication types

MeSH terms