A construction and comprehensive analysis of ceRNA networks and infiltrating immune cells in papillary renal cell carcinoma
- PMID: 34598322
- PMCID: PMC8607257
- DOI: 10.1002/cam4.4309
A construction and comprehensive analysis of ceRNA networks and infiltrating immune cells in papillary renal cell carcinoma
Abstract
Background: As the second most common malignancy in adults, papillary renal cell carcinoma (PRCC) has shown an increasing trend in both incidence and mortality. Effective treatment for advanced metastatic PRCC is still lacking. In this study, we aimed to establish competitive endogenous RNA (ceRNA) networks related to PRCC tumorigenesis, and analyze the specific role of differentially expressed ceRNA components and infiltrating immune cells in tumorigenesis.
Methods: CeRNA networks were established to identify the key ceRNAs related to PRCC tumorigenesis based on the 318 samples from The Cancer Genome Atlas database (TCGA), including 285 PRCC and 33 normal control samples. The R package, "CIBERSORT," was used to evaluate the infiltration of 22 types of immune cells. Then we identified the significant ceRNAs and immune cells, based on which two nomograms were obtained for predicting the prognosis in PRCC patients. Finally, we investigated the co-expression of PRCC-specific immune cells and core ceRNAs via Pearson correlation test.
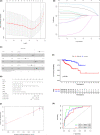
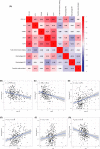
Results: COL1A1, H19, ITPKB, LDLR, TCF4, and WNK3 were identified as hub genes in ceRNA networks. Four prognostic-related tumor-infiltrating immune cells, including T cells CD4 memory resting, Macrophages M1, and Macrophages M2 were revealed. Pearson correlation test indicated that Macrophage M1 was negatively related with COL1A1 (p < 0.01) and LDLR (p < 0.01), while Macrophage M2 was positively related with COL1A1 (p < 0.01), TCF4 (p < 0.01), and H19 (p = 0.032). Two nomograms were conducted with favorable accuracies (area under curve of 1-year survival: 0.935 and 0.877; 3-year survival: 0.849 and 0.841; and 5-year survival: 0.818 and 0.775, respectively).
Conclusion: The study constructed two nomograms suited for PRCC prognosis predicting. Moreover, we concluded that H19-miR-29c-3p-COL1A1 axis might promote the polarization of M2 macrophages and inhibit M1 macrophage activation through Wnt signaling pathway, collaborating to promote PRCC tumorigenesis and lead to poor overall survival of PRCC patients.
Keywords: PRCC; ceRNA network; immune cells; nomogram.
© 2021 The Authors. Cancer Medicine published by John Wiley & Sons Ltd.
Conflict of interest statement
There is no conflict of interest.
Figures


Similar articles
-
Long Non-Coding RNAs as Novel Biomarkers in the Clinical Management of Papillary Renal Cell Carcinoma Patients: A Promise or a Pledge?Cells. 2022 May 17;11(10):1658. doi: 10.3390/cells11101658. Cells. 2022. PMID: 35626699 Free PMC article. Review.
-
The construction and analysis of tumor-infiltrating immune cells and ceRNA networks in metastatic adrenal cortical carcinoma.Biosci Rep. 2020 Mar 27;40(3):BSR20200049. doi: 10.1042/BSR20200049. Biosci Rep. 2020. PMID: 32175564 Free PMC article.
-
Identification of 4-genes model in papillary renal cell tumor microenvironment based on comprehensive analysis.BMC Cancer. 2021 May 17;21(1):553. doi: 10.1186/s12885-021-08319-0. BMC Cancer. 2021. PMID: 33993869 Free PMC article.
-
Comprehensive analysis of differentially expressed profiles and reconstruction of a competing endogenous RNA network in papillary renal cell carcinoma.Mol Med Rep. 2019 Jun;19(6):4685-4696. doi: 10.3892/mmr.2019.10138. Epub 2019 Apr 5. Mol Med Rep. 2019. PMID: 30957192 Free PMC article.
-
Contemporary review of papillary renal cell carcinoma-current state and future directions.Virchows Arch. 2024 Sep;485(3):391-405. doi: 10.1007/s00428-024-03865-x. Epub 2024 Jul 12. Virchows Arch. 2024. PMID: 38995356 Review.
Cited by
-
Long Non-Coding RNAs as Novel Biomarkers in the Clinical Management of Papillary Renal Cell Carcinoma Patients: A Promise or a Pledge?Cells. 2022 May 17;11(10):1658. doi: 10.3390/cells11101658. Cells. 2022. PMID: 35626699 Free PMC article. Review.
-
A Computationally Constructed lncRNA-Associated Competing Triplet Network in Clear Cell Renal Cell Carcinoma.Dis Markers. 2022 Nov 17;2022:8928282. doi: 10.1155/2022/8928282. eCollection 2022. Dis Markers. 2022. PMID: 36438902 Free PMC article.
-
A Novel Pyroptosis-Related Gene Signature for Predicting Prognosis in Kidney Renal Papillary Cell Carcinoma.Front Genet. 2022 Mar 23;13:851384. doi: 10.3389/fgene.2022.851384. eCollection 2022. Front Genet. 2022. PMID: 35401700 Free PMC article.
-
Unlocking the Potential of Kinase Targets in Cancer: Insights from CancerOmicsNet, an AI-Driven Approach to Drug Response Prediction in Cancer.Cancers (Basel). 2023 Aug 10;15(16):4050. doi: 10.3390/cancers15164050. Cancers (Basel). 2023. PMID: 37627077 Free PMC article.
References
-
- Perazella MA, Dreicer R, Rosner MH. Renal cell carcinoma for the nephrologist. Kidney Int. 2018;94(3):471‐483. - PubMed
-
- Sung H, Ferlay J, Siegel RL, et al. Global cancer statistics 2020: GLOBOCAN estimates of incidence and mortality worldwide for 36 cancers in 185 countries. CA Cancer J Clin. 2021;71(3):209‐249. - PubMed
-
- Linehan WM, Ricketts CJ. The Cancer Genome Atlas of renal cell carcinoma: findings and clinical implications. Nat Rev Urol. 2019;16(9):539‐552. - PubMed
-
- Steffens S, Janssen M, Roos FC, et al. Incidence and long‐term prognosis of papillary compared to clear cell renal cell carcinoma – a multicentre study. Eur J Cancer. 2012;48(15):2347‐2352. - PubMed
Publication types
MeSH terms
Substances
LinkOut - more resources
Full Text Sources
Medical
Research Materials
Miscellaneous

