Review
. 2021 Oct 1;14(1):238.
doi: 10.1186/s12920-021-01056-0.

Design and user experience testing of a polygenic score report: a qualitative study of prospective users

Affiliations
Review

Design and user experience testing of a polygenic score report: a qualitative study of prospective users

Deanna G Brockman et al. BMC Med Genomics. .

Abstract

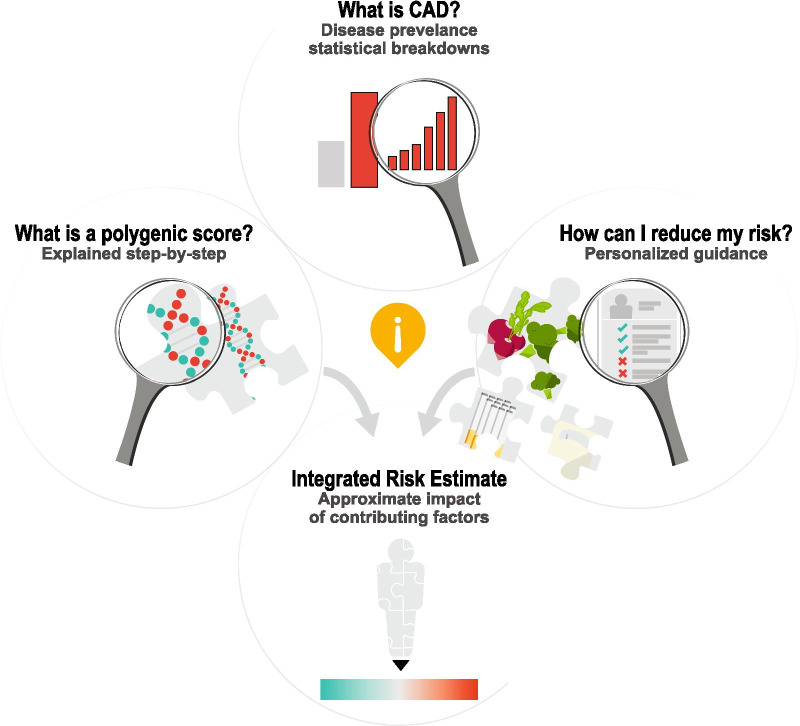
Background: Polygenic scores-which quantify inherited risk by integrating information from many common sites of DNA variation-may enable a tailored approach to clinical medicine. However, alongside considerable enthusiasm, we and others have highlighted a lack of standardized approaches for score disclosure. Here, we review the landscape of polygenic score reporting and describe a generalizable approach for development of a polygenic score disclosure tool for coronary artery disease.

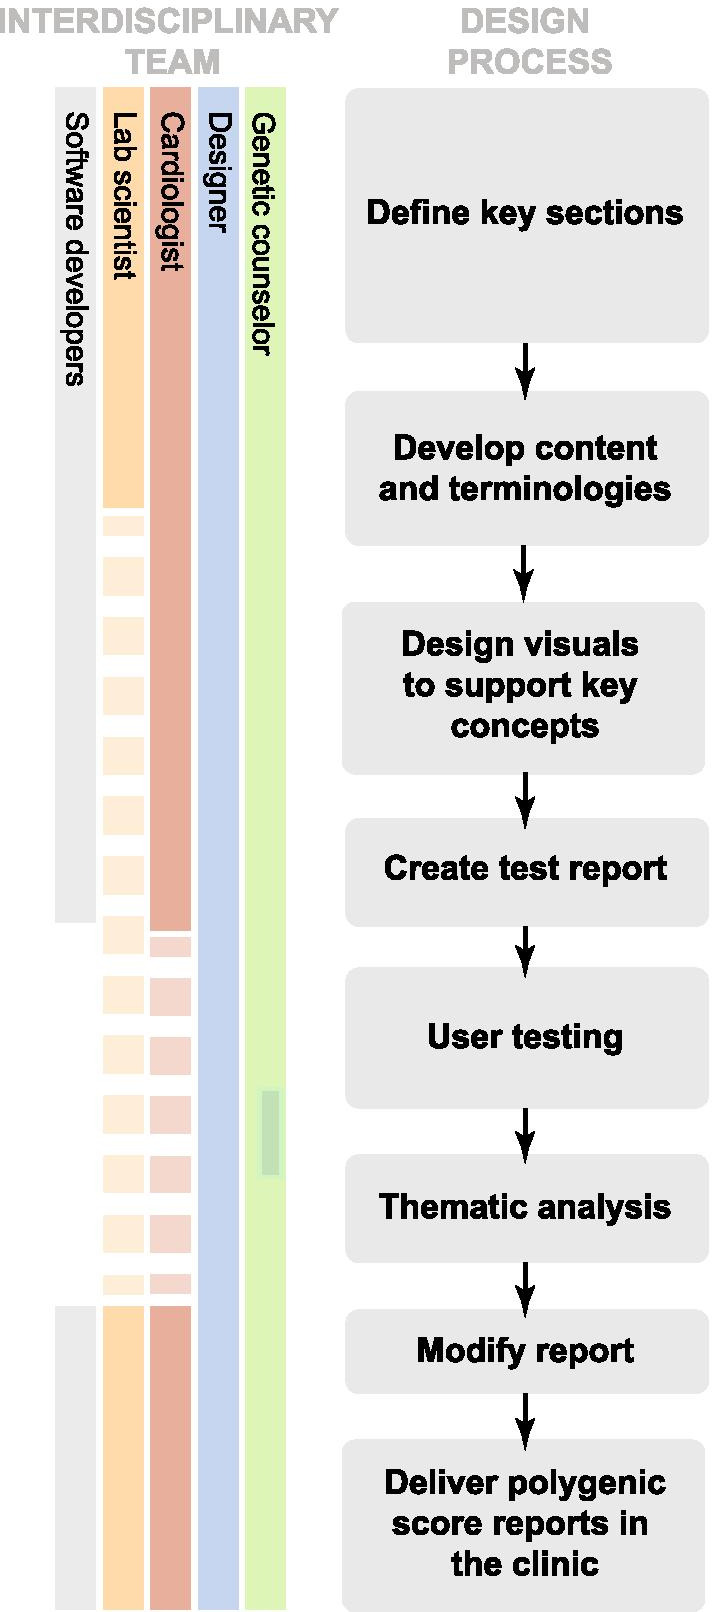
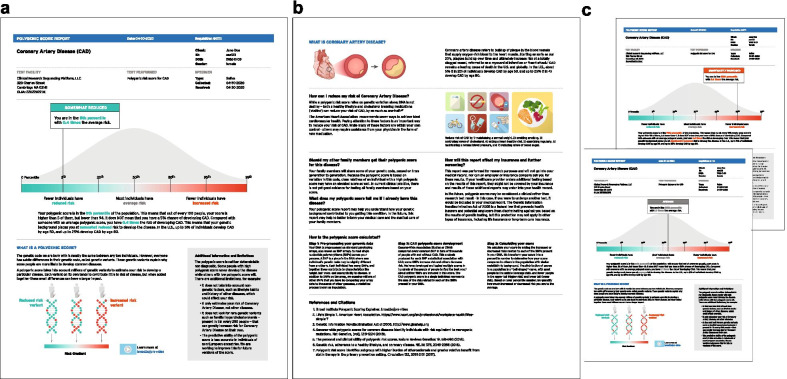
Methods: We assembled a working group of clinicians, geneticists, data visualization specialists, and software developers. The group reviewed existing polygenic score reports and then designed a two-page mock report for coronary artery disease. We then conducted a qualitative user-experience study with this report using an interview guide focused on comprehension, experience, and attitudes. Interviews were transcribed and analyzed for themes identification to inform report revision.

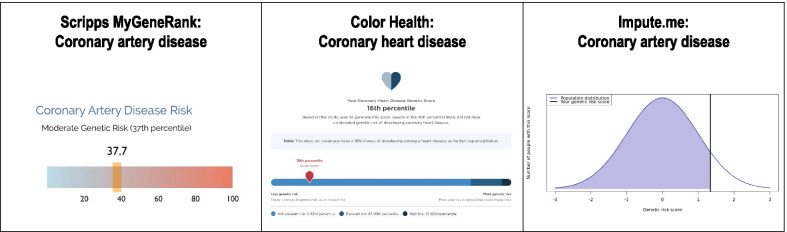
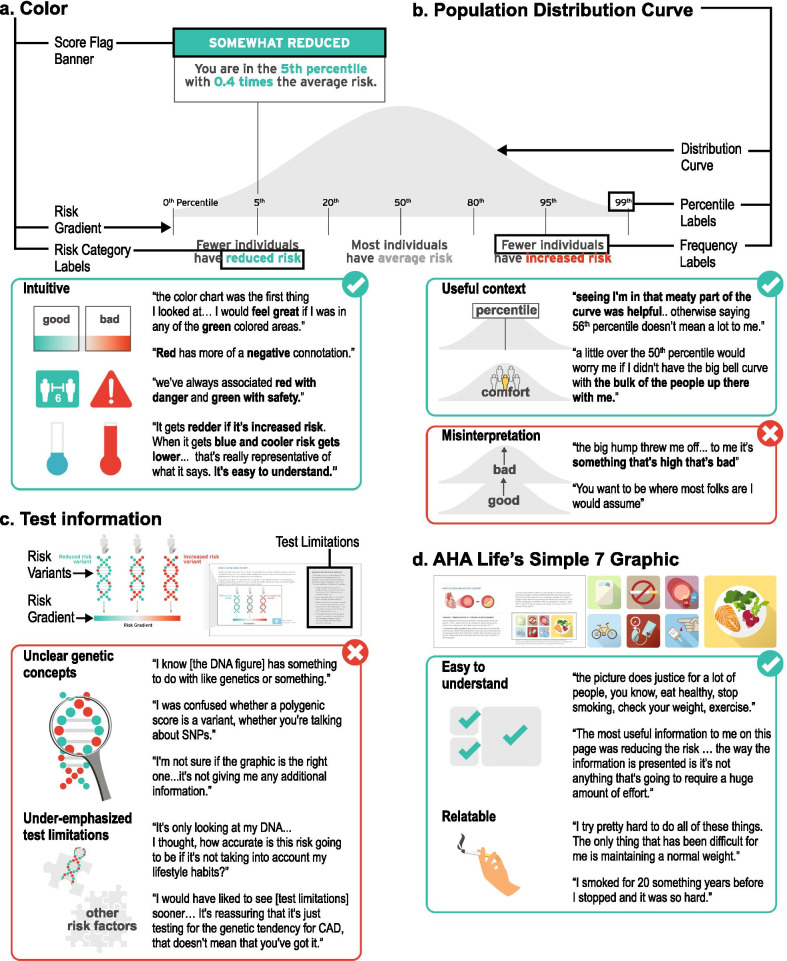
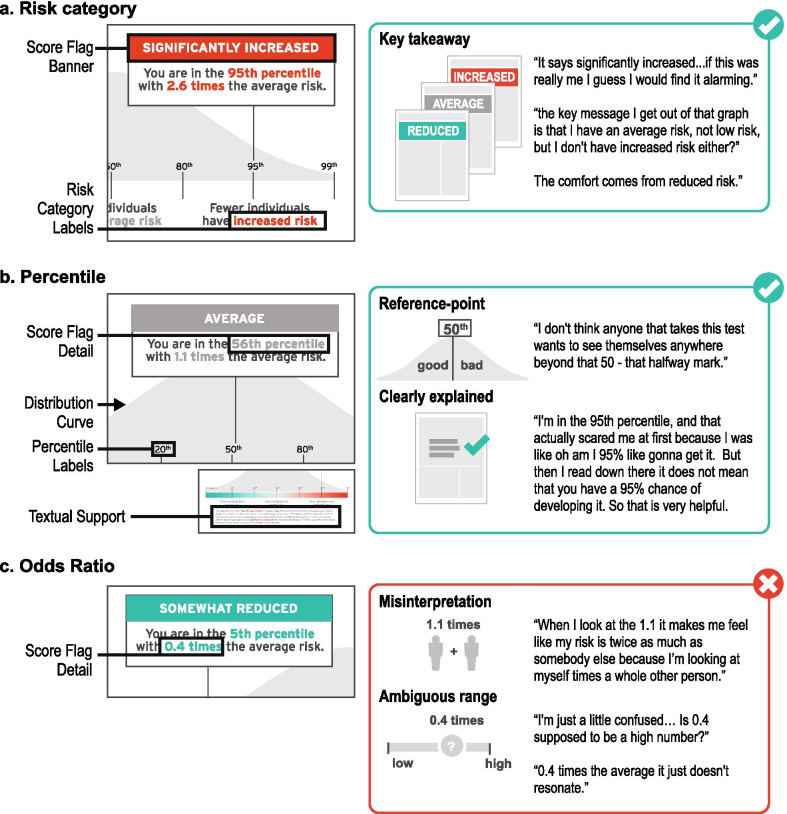
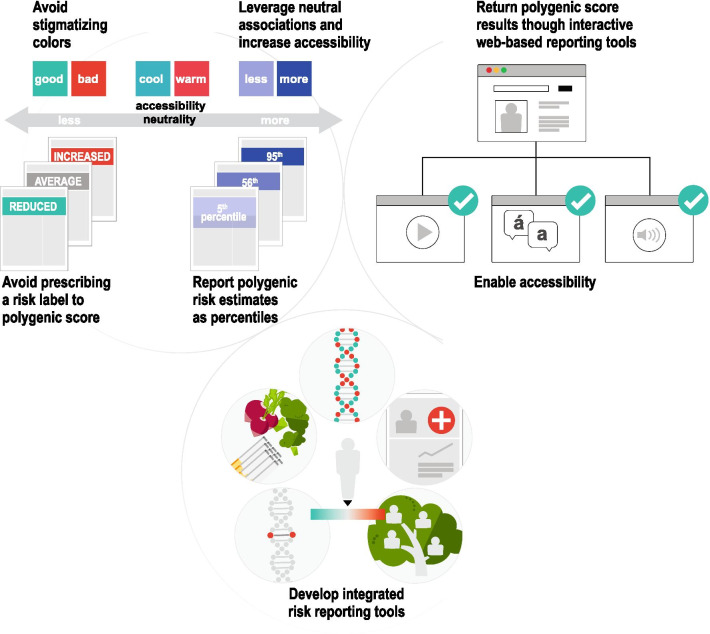
Results: Review of nine existing polygenic score reports from commercial and academic groups demonstrated significant heterogeneity, reinforcing the need for additional efforts to study and standardize score disclosure. Using a newly developed mock score report, we conducted interviews with ten adult individuals (50% females, 70% without prior genetic testing experience, age range 20-70 years) recruited via an online platform. We identified three themes from interviews: (1) visual elements, such as color and simple graphics, enable participants to interpret, relate to, and contextualize their polygenic score, (2) word-based descriptions of risk and polygenic scores presented as percentiles were the best recognized and understood, (3) participants had varying levels of interest in understanding complex genomic information and therefore would benefit from additional resources that can adapt to their individual needs in real time. In response to user feedback, colors used for communicating risk were modified to minimize unintended color associations and odds ratios were removed. All 10 participants expressed interest in receiving a polygenic score report based on their personal genomic information.

Conclusions: Our findings describe a generalizable approach to develop a polygenic score report understandable by potential patients. Although additional studies are needed across a wider spectrum of patient populations, these results are likely to inform ongoing efforts related to polygenic score disclosure within clinical practice.

Keywords: Data visualization; Genomic medicine; Health communication; Laboratory reports; Patient communication; Polygenic scores; Population health.


Conflict of interest statement

BCK and KN are employees of IBM Research. ACF is a consultant and holds equity in Goodpath. AVK has served as a scientific advisor to Sanofi, Amgen, Maze Therapeutics, Navitor Pharmaceuticals, Sarepta Therapeutics, Verve Therapeutics, Veritas International, Color Health, Third Rock Ventures, and Columbia University (NIH); received speaking fees from Illumina, MedGenome, Amgen, and the Novartis Institute for Biomedical Research; and received a sponsored research agreement from the Novartis Institute for Biomedical Research.

Figures

Fig. 1
Fig. 1
Developing a user-centered polygenic score report. An interdisciplinary team adopted a multi-step approach to create and iterate on a polygenic score report for coronary artery disease through a review of existing polygenic score reports and qualitative research methods
Fig. 2
Fig. 2
Comparison of polygenic risk score report visuals. Polygenic risk scores were compared based on numeric estimates reported, risk descriptions, and supporting visuals to convey risk. Written copyright permission was obtained from 3/7 groups to reproduce figures from company websites and provided through personal communication in this manuscript. References for sample polygenic score reports shown here: Scripps MyGeneRank [29], Color Health [32], Impute.me [34]. Copyright permissions were not obtained for the remaining report visuals discussed in the manuscript; sample reports are referenced within the manuscript: Myriad Genetics [27], Gene Plaza [33], 23andMe [36], Ambry Genetics [–24]. Since this review, Ambry Genetics [–24] removed the ‘AmbryScore’ polygenic score product from the market in May 2021 [e-mail communication]
Fig. 3
Fig. 3
Mock polygenic score reports for coronary artery disease. Mock reports consisted of five sections: (1) Participant information, (2) Participant score, (3) ‘What is a polygenic score?’ (4) ‘What is coronary artery disease?’ and (5) ‘How can I reduce my risk of coronary artery disease?’ a Page one of 5th percentile (significantly reduced risk) mock report. b Page two of all reports. c Page one of 95th percentile (significantly increased risk) and 56th percentile (average risk) mock reports
Fig. 4
Fig. 4
User experience testing results: Theme one. Visual elements, such as color and simple graphics, enable participants to interpret, relate to, and contextualize their polygenic score. a Color was the predominant design element that influenced participants’ level of concern about their hypothetical genetic risk. b Participants expressed differences in their understanding of the population distribution curve, interpretation of the underlying data, and association to its meaning. c Participants were often unclear on genetic concepts and felt that test limitations were underemphasized. d Participants found the cardiology and lifestyle graphics to be recognizable, relatable, and helpful for understanding the topic of the risk disclosure tool
Fig. 5
Fig. 5
User experience testing results: Theme two. Word-based descriptions of risk and polygenic scores presented as a percentile were most often recognized and understood by participants. a ‘Risk category’ is an interpretation of the numeric polygenic risk estimate. b ‘Percentile’ is a polygenic risk estimate—on a scale from 0 to 100—describing a participant’s location in a normal distribution. c ‘Odds ratio’ is an estimate of risk that conveys magnitude of risk compared to ‘average risk’ of 1.0
Fig. 6
Fig. 6
User experience testing results: Theme three. Participants had varying levels of interest in understanding complex medical and genomic information and therefore would benefit from resources that can adapt to their individual needs in real time. Participants were interested in receiving further information to answer the following questions: (1) What is a polygenic score? (2) What is CAD? (3) What is my overall risk when all contributing risk factors are considered? and (4) How can I reduce my risk?
Fig. 7
Fig. 7
Next steps in genomic risk disclosure. The following should be considered when developing genomic risk disclosure tools: (1) Use non-stigmatizing colors that leverage neutral associations and are accessible for individuals with color blindness, (2) Report polygenic scores as percentile and avoid prescribing a categorical risk label, (3) Use interactive web-based reporting tools that enable accessibility options and personalized experiences, (4) Develop reporting tools that integrate a range of disease risk factors

References

    1. Lewis CM, Vassos E. Polygenic risk scores: from research tools to clinical instruments. Genome Med. 2020;12:44. doi: 10.1186/s13073-020-00742-5. - DOI - PMC - PubMed
    1. Wand H, Lambert SA, Tamburro C, Iacocca MA, O’Sullivan JW, Sillari C, et al. Improving reporting standards for polygenic scores in risk prediction studies. Nature. 2021;591:211–219. doi: 10.1038/s41586-021-03243-6. - DOI - PMC - PubMed
    1. Lewis ACF, Green RC. Polygenic risk scores in the clinic: new perspectives needed on familiar ethical issues. Genome Med. 2021;13:14. doi: 10.1186/s13073-021-00829-7. - DOI - PMC - PubMed
    1. Haga SB, Mills R, Pollak KI, Rehder C, Buchanan AH, Lipkus IM, et al. Developing patient-friendly genetic and genomic test reports: formats to promote patient engagement and understanding. Genome Med. 2014;6:58. doi: 10.1186/s13073-014-0058-6. - DOI - PMC - PubMed
    1. Williams JL, Rahm AK, Stuckey H, Green J, Feldman L, Zallen DT, et al. Enhancing genomic laboratory reports: a qualitative analysis of provider review. Am J Med Genet A. 2016;170A:1134–1141. doi: 10.1002/ajmg.a.37573. - DOI - PMC - PubMed

Publication types